Oregon’s, nation’s gas prices plummet before Thanksgiving, but still costliest fill-up ever for the holiday

PORTLAND, Ore. (KTVZ) – Drivers fueling up ahead of Thanksgiving will find falling pump prices in all 50 states. Unfortunately, gas prices will be the most expensive ever for the holiday, AAA Oregon-Idaho reported Tuesday.
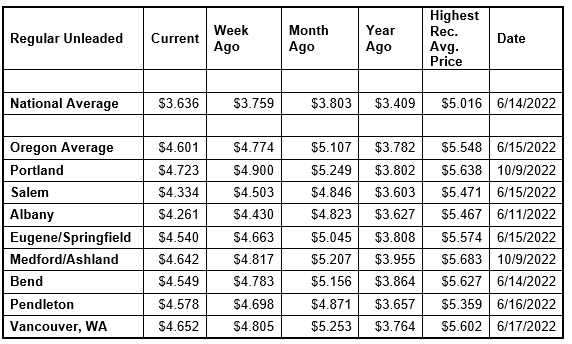
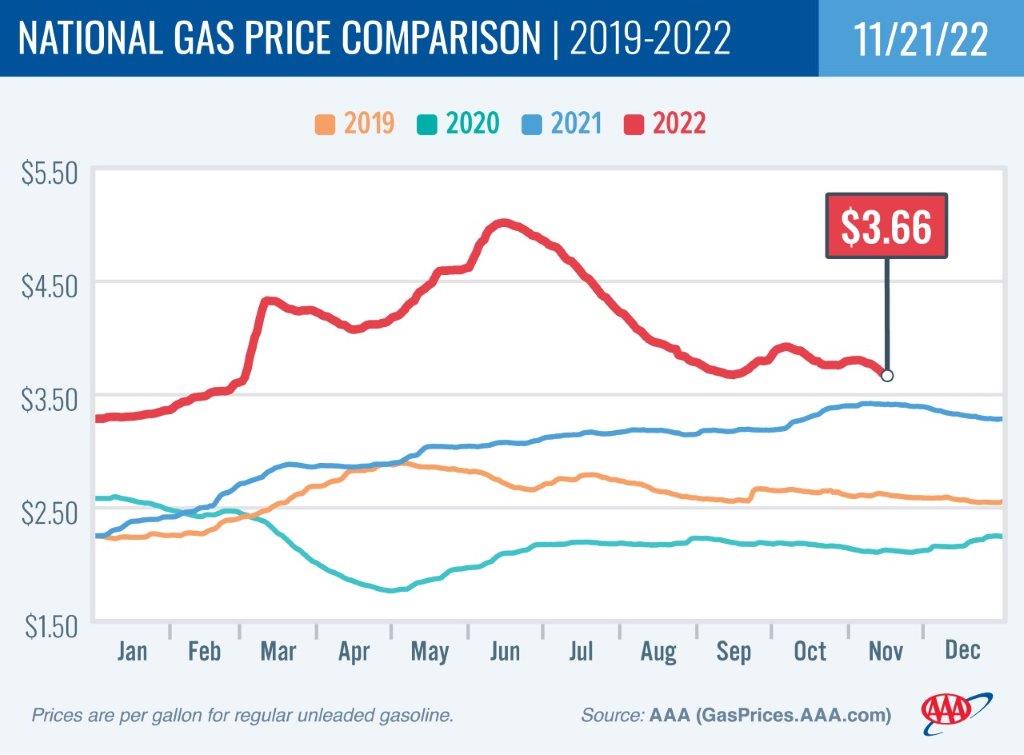
For the week, the national average for regular tumbles 12 cents to $3.76 a gallon. The Oregon average plunges 17 cents to $4.77, the fifth-largest weekly drop for a state in the nation.

AAA projects 54.6 million Americans (16.4% of the population) will travel 50 miles or more from home for the Thanksgiving holiday, up 1.5% from 2021. This year is expected to be the third-busiest for Thanksgiving travel since AAA started tracking in 2000, only behind 2005 and 2019. About 777,000 Oregonians will head over the river and through the woods for turkey and all the trimmings. Find details and tips for travelers in the AAA Thanksgiving news release.
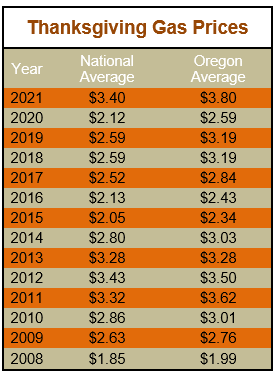
“Gas prices have never been more expensive for Thanksgiving, with the national and Oregon averages at their highest prices ever for the holiday. Those who hit the road for Thanksgiving will find gas prices that are as much as 90 cents a gallon more expensive than last year,” says Marie Dodds, public affairs director for AAA Oregon/Idaho. “Still, we can be thankful that pump prices are moving in the right direction for now.

Crude oil prices are at their lowest prices in 10 months, and that’s helping to put downward pressure on pump prices. Crude prices remained in a fairly tight range between about $85 and $93 per barrel for several weeks until this week when prices fell to $80 as markets focused on a potential slowdown for global economies, driven by the seemingly increasing COVID-19 outbreak in China.
Crude oil prices climbed above $90 briefly earlier this month. Crude reached a recent high of $122.11 per barrel on June 8, and ranged from about $94 to $110 per barrel in July. In August, crude prices ranged between about $86 and $97. In September, crude prices ranged between about $76 and $88 per barrel. In October, crude ranged between $82 and $92 per barrel.
Crude prices rose dramatically leading up to and in the first few months of Russia’s invasion of Ukraine. Russia is one of the world’s top oil producers and its involvement in a war causes market volatility, and sanctions imposed on Russia by the U.S. and other western nations resulted in tighter global oil supplies. Oil supplies were already tight around the world as demand for oil increased as pandemic restrictions eased. A year ago, crude was around $77 per barrel compared to $81 today.
Crude oil is the main ingredient in gasoline and diesel, so pump prices are impacted by crude prices on the global markets. On average, about 56% of what we pay for in a gallon of gasoline is for the price of crude oil, 20% is refining, 11% distribution and marketing, and 14% are taxes, according to the U.S. Energy Information Administration.
Demand for gasoline in the U.S. fell from 9.01 million to 8.74 million b/d for the week ending November 11.
This compares to 9.24 million b/d at this time last year. rose by nearly 2.2 million bbl to 207.9 million bbl. Increasing supply and falling demand have helped to push pump prices lower. As demand remains low and stocks grow, drivers will likely see pump prices dip through the Thanksgiving holiday.
Quick stats
Pump prices are lower this week in all 50 states and the District of Columbia. Wisconsin (-24 cents) has the largest weekly drop. Hawaii (-1 cent) has the smallest weekly decline.
California ($5.12) has the most expensive gas in the country for the 11th week in a row. California and Hawaii ($5.20) are the only two states with averages at or above $5 a gallon. This week nine states, including Oregon, have averages at or above $4, and 41 states and the District of Columbia have averages in the $3-range.
The cheapest gas in the nation is in Texas ($2.98) and Georgia ($3.09). For the 98th week in a row, no state has an average below $2 a gallon.
The difference between the most expensive and least expensive states is $2.23 which continues to be stark.
Oregon is one of 39 states and the District of Columbia with lower prices now than a month ago. The national average is 17 cents less and the Oregon average is 51 cents less than a month ago. Oregon has the third-largest monthly decrease in the nation. California (-58 cents) and Alaska (-55 cents) have the largest monthly declines. Maine (+22 cents) has the largest month-over-month increase.
Oregon is one of 47 states and the District of Columbia with higher prices now than a year ago. The national average is 23 cents more and the Oregon average is 82 cents more than a year ago. This is the fourth-largest year-over-year increase in the nation. Alaska (+87 cents) and Hawaii (+86 cents) have the largest yearly gains. Georgia (-14 cents) has the biggest year-over-year decline.
West Coast
The West Coast region continues to have the most expensive pump prices in the nation with all seven states in the top 10. This is typical for the West Coast as this region tends to consistently have fairly tight supplies, consuming about as much gasoline as is produced. In addition, this region is located relatively far from parts of the country where oil drilling, production and refining occurs, so transportation costs are higher. And environmental programs in this region add to the cost of production, storage and distribution.
Refinery issues in California in September and October exacerbated the situation, creating extremely tight supplies and causing pump prices in this region to skyrocket.
| Rank | Region | Price on 11/22/22 | ||
| 1 | California | $5.21 | ||
| 2 | Hawaii | $5.20 | ||
| 3 | Nevada | $4.83 | ||
| 4 | Washington | $4.64 | ||
| 5 | Oregon | $4.60 | ||
| 6 | Alaska | $4.60 | ||
| 7 | Idaho | $4.18 | ||
| 8 | Arizona | $4.17 | ||
| 9 | Pennsylvania | $4.01 | ||
| 10 | Utah | $3.97 |
As mentioned above, California is the most expensive state for the 11th consecutive week with Hawaii, Nevada, Washington, Oregon, and Alaska rounding out the top six. Arizona is eighth. Oregon is fifth most expensive for the second week in a row.
All of the West Coast states are seeing weekly drops. California (-22 cents) has the largest in the region. Hawaii (-1 cent) has the smallest.
The refinery utilization rate on the West Coast rose from 90.1% to 92.7% for the week ending November 11. This is the highest rate in the last year.
According to EIA’s latest weekly report, total gas stocks in the region increased from 27.19 million bbl. to 27.99 million bbl.
Oil market dynamics
Although crude prices jumped at the end of the week due to a weakening dollar, prices dropped earlier in the week after the EIA reported that total domestic commercial crude stocks increased dramatically by 4 million bbl. The inventory rise could mean that demand is falling due to growing economic concerns in the market. For this week, market concerns that economic growth will stall or reverses course, leading to lower crude demand, could push prices lower.
At the close of Friday’s formal trading session, WTI decreased by $1.56 to settle at $80.08. At the close of Monday’s formal trading session, WTI lost 35 cents to close at $79.73, the first time WTI closed below $80 a barrel since Sept. 30. Today crude is trading around $82, compared to $87 a week ago. Crude prices are about $4 more than a year ago.
Drivers can find current gas prices along their route with the free AAA Mobile app for iPhone, iPad and Android. The app can also be used to map a route, find discounts, book a hotel and access AAA roadside assistance. Learn more at AAA.com/mobile.

Diesel
For the week, the national average loses seven cents to $5.29 a gallon. The record high is $5.816 set on June 19. The Oregon average falls a nickel to $5.51. The record high is $6.47 set on July 3. A year ago the national average for diesel was $3.64 and the Oregon average was $3.80.
Diesel supplies are tight in parts of the U.S., especially in parts of the eastern U.S. However, recent reports that the U.S. has less than a month worth of diesel aren’t accurate. While the U.S. Energy Information Administration shows the U.S. has 26.6 days’ worth of supply of diesel for the week ending November 11, this number actually measures supply IF no more diesel would be produced in the U.S. or imported from other countries. Supplies of diesel have slowly been rising, up from 25.4 days of diesel supply for the week ending Oct. 14. In 2019, diesel supplies were also very tight with the EIA reporting a low of 26.5 days.
Diesel supplies have been impacted by the same factors that have caused supply and demand issues in other industries including the pandemic and the Russian invasion of Ukraine. Tight supplies could result in climbing prices for diesel, but there have not been significant increases yet.
Earlier story:
GasBuddy analyst says prices are expected to keep falling
CHICAGO (KTVZ) -- Average gasoline prices in Oregon have fallen 15.4 cents per gallon in the last week, averaging $4.62/g Monday, according to GasBuddy's survey of 1,307 stations in Oregon.
Prices in Oregon are 48.6 cents per gallon lower than a month ago and stand 87.6 cents per gallon higher than a year ago. The national average price of diesel has declined 6.7 cents in the last week and stands at $5.28 per gallon.
According to GasBuddy price reports, the cheapest station in Oregon was priced at $3.89/g Sunday, while the most expensive was $5.59/g, a difference of $1.70/g.
The national average price of gasoline has fallen 11.9 cents per gallon in the last week, averaging $3.64/g today. The national average is down 16.4 cents per gallon from a month ago and stands 24.5 cents per gallon higher than a year ago, according to GasBuddy data compiled from more than 11 million weekly price reports covering over 150,000 gas stations across the country.
Historical gasoline prices in Oregon and the national average going back ten years:
November 21, 2021: $3.74/g (U.S. Average: $3.39/g)
November 21, 2020: $2.50/g (U.S. Average: $2.11/g)
November 21, 2019: $3.20/g (U.S. Average: $2.60/g)
November 21, 2018: $3.16/g (U.S. Average: $2.58/g)
November 21, 2017: $2.82/g (U.S. Average: $2.52/g)
November 21, 2016: $2.43/g (U.S. Average: $2.13/g)
November 21, 2015: $2.36/g (U.S. Average: $2.08/g)
November 21, 2014: $3.05/g (U.S. Average: $2.83/g)
November 21, 2013: $3.26/g (U.S. Average: $3.21/g)
November 21, 2012: $3.50/g (U.S. Average: $3.42/g)
Oregon areas and their current gas prices:
Eugene- $4.57/g, down 8.4 cents per gallon from last week's $4.65/g.
Salem- $4.34/g, down 15.1 cents per gallon from last week's $4.49/g.
Portland- $4.80/g, down 15.2 cents per gallon from last week's $4.95/g.
"What an incredible turnaround in the last week. While a decline was expected in more states than last week, I didn't expect every single state to hop on the bandwagon so quickly. But, it's terrific news as motorists prepare for Thanksgiving travel, with tens of thousands of stations under $3 per gallon, and thousands more to join in the next few weeks, barring a dramatic turnaround," said Patrick De Haan, head of petroleum analysis at GasBuddy.
"Everyone will be seeing relief at the pump this week, with even more substantial declines on the way, as oil prices plummeted last week to briefly trade under $80 per barrel. It's not impossible that if oil markets hold here, we could see a national average of $2.99 around Christmas, certainly the gift that every motorist is hoping for. Drivers shouldn't be in a rush to fill up, as prices will come down nearly coast-to-coast into the heavily traveled Thanksgiving holiday."
GasBuddy is the authoritative voice for gas prices and the only source for station-level data. GasBuddy's survey updates 288 times every day from the most diverse list of sources covering nearly 150,000 stations nationwide, the most comprehensive and up-to-date in the country. GasBuddy data is accessible at http://prices.GasBuddy.com.
GasBuddy also fuels KTVZ's Pump Patrol, with the cheapest gas prices on the High Desert