Gas prices fall in Bend and across Oregon, but AAA says drivers can expect to see them rise in coming weeks
PORTLAND, Ore. (KTVZ) – Pump prices are heading lower in almost all states, including Oregon, this week. However, refinery maintenance season is not over yet, so gas prices will likely rise in the coming weeks, AAA Oregon/Idaho reported Tuesday.
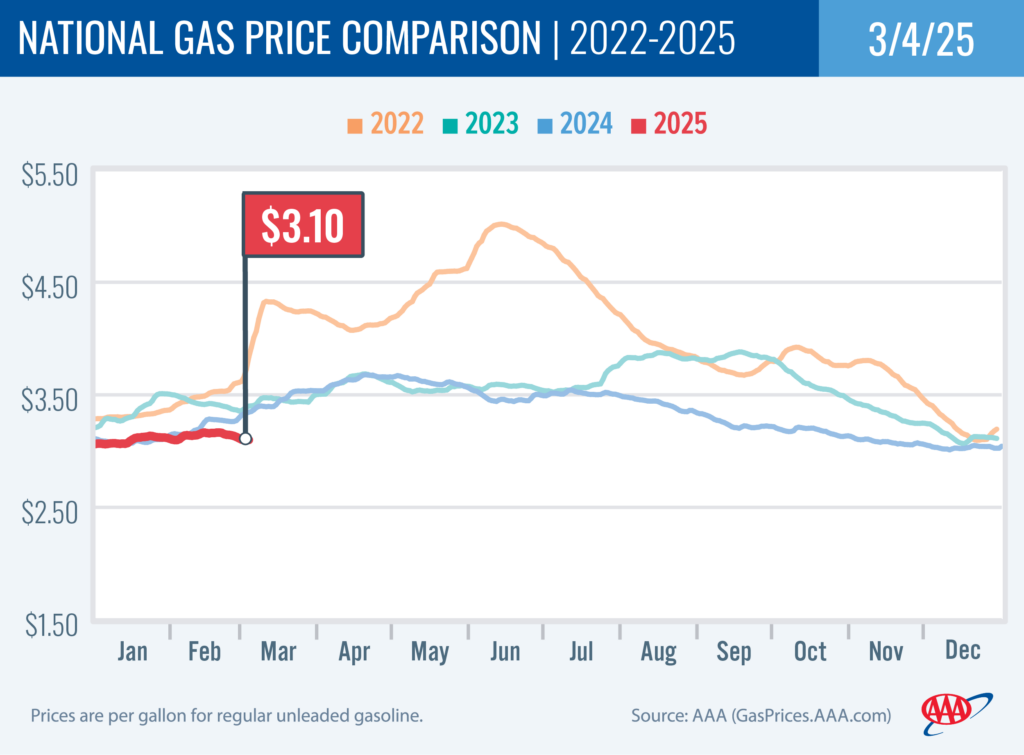
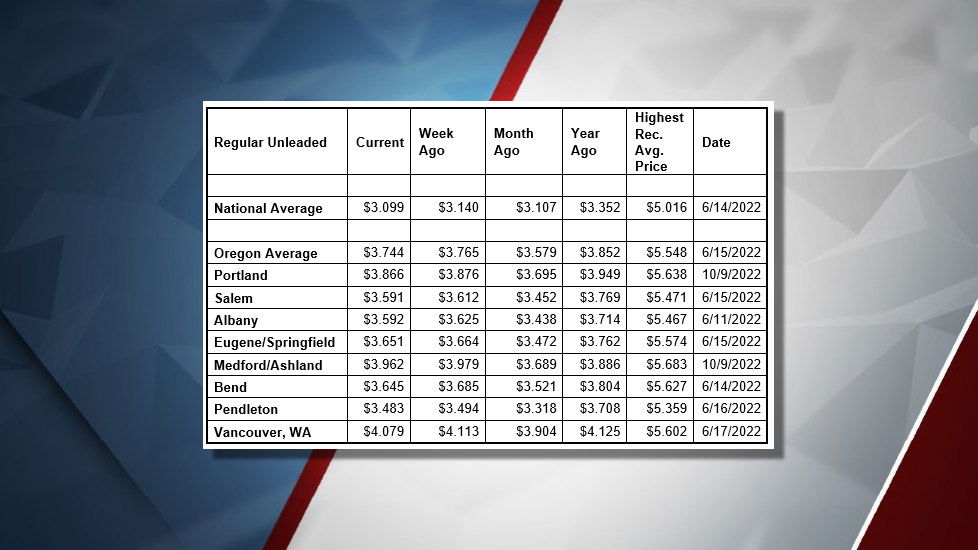
Also, the Trump Administration tariffs went into effect early Tuesday, and some regions may see impacts at the pumps as the tariffs apply to crude oil coming to the U.S. from Canada and Mexico. For the week, the national average for regular falls four cents to $3.10 a gallon.
The Oregon average dips two cents, to $3.74 a gallon, while Bend's prices dropped four cents, to $3.64 a gallon. That's 12 cents lower than a month ago and down 16 cents from a year ago.
“It’s been a quiet week for gas prices as they continue to tick lower here in Oregon and nationwide. However, the normal seasonal increases will come, due to refinery maintenance season and the switch to summer-blend fuel, which is more expensive to produce,” says Marie Dodds, public affairs director for AAA Oregon/Idaho.
Also, some regions that rely on crude oil from Canada may see pump prices climb soon, due to the 10% tariff on Canadian energy. The Northeast region will likely be impacted first.
The Oregon average began 2025 at $3.45 a gallon and is currently at $3.74. The lowest price of the year so far is just under $3.45 a gallon on January 2, and the highest price of the year so far is $3.77 on February 22.
The national average began 2025 at $3.06 a gallon and is currently at $3.10. The lowest price of the year so far is $3.06 on January 5, and the highest is $3.165 on February 14.
On February 1, President Trump signed an executive order issuing 25% tariffs on goods coming into the U.S. from Canada and Mexico and a 10% tariff on goods from China. The only products subject to a lower tariff are Canadian energy products, which have a lower rate of 10%. These tariffs were implemented for Canada and Mexico early Tuesday (March 4).
Nearly 70% of U.S. crude oil imports come from Canada and Mexico, with the bulk coming from Canada. Most gasoline, diesel and jet fuel produced in the U.S. stays in the U.S. and is used by American consumers. While tariffs could play a role in gas prices, they are one of several factors including global and U.S. supply and demand, seasonal demand, refinery maintenance, and geo-political events around the world.
Gas prices typically rise starting in mid-to-late winter and early spring as refineries undergo maintenance ahead of the switch to summer-blend fuel. The switch occurs first in California, which is why pump prices on the West Coast often rise before other parts of the country. The East Coast is the last major market to switch to summer-blend fuel.
Most areas have a May 1 compliance date for refiners and terminals, while most gas stations have a June 1 deadline to switch to selling summer-blend until June 1. Switch-over dates are earlier in California with some areas in the state requiring summer-blend fuel by April 1. Some refineries will begin maintenance and the switchover in February.
Gas prices usually drop in the fall, due to the switch from summer-blend to winter-blend fuel, which costs less to produce. The switch starts in September. Many areas, including Oregon, can sell winter-blend fuel starting September 15. However, Northern and Southern California require summer-blend fuel through October 31. Prices usually decline to their lowest levels of the year in late fall and early winter before increasing again in the late winter and early spring.
Meanwhile, crude oil production in the U.S. remains near record highs. The U.S. Energy Information Administration (EIA) reports that crude production in this country ticked up from 13.497 to 13.502 million barrels per day for the week ending February 21. The record high is 13.63 million barrels per day for the week of December 6. Production has been at 13.5 million barrels per day many times since October. The U.S. has been the top producer of crude oil in the world since 2018 and has been increasing its oil production since about 2009.
The U.S. price of crude oil (West Texas Intermediate) has been in the upper $60s to mid-$70s for much of the last three months, but did soar to $80.04 per barrel on January 15, which is the highest price since last August.
Crude oil is trading around $67 today compared to $69 a week ago and $79 a year ago. In 2024, West Texas Intermediate ranged between $66 and $87 per barrel. In 2023, WTI ranged between $63 and $95 per barrel. WTI reached recent highs of $123.70 on March 8, 2022, shortly after the Russian invasion of Ukraine, and $122.11 per barrel on June 8, 2022. The all-time high for WTI crude oil is $147.27 in July 2008.
Crude oil prices have moved lower to start this week after OPEC+ announced that it would end its production cuts on April 1 and would return to full production by next year. This would end about 2.2 million barrels per day of production cuts which have been in effect since 2023. OPEC+ had hoped that its production cuts would boost crude oil prices, but that didn’t happen, in part due to sluggish demand in China and a boost in production by non-members of OPEC+.
Crude prices are impacted by economic news as well as geopolitical events around the world including the unrest in the Middle East and the war between Russia and Ukraine. Russia is a top global oil producer, behind the U.S. and Saudi Arabia.
Crude prices have been volatile after the attack on Israel by Hamas in October 2023. While Israel and the Palestinian territory are not oil producers, concerns remain that the conflict could spread in the Middle East, which could potentially impact crude production in other oil-producing nations in the region. In addition, production cuts by OPEC+ have tightened global crude oil supplies, which will continue to impact prices. The cartel has said it would start monthly production increases on April 1 but could still decide to postpone any hike in oil output.
Crude oil is the main ingredient in gasoline and diesel, so pump prices are impacted by crude prices on the global markets. On average, about 56% of what we pay for in a gallon of gasoline is for the price of crude oil, 8% is refining, 20% distribution and marketing, and 17% are taxes, according to the U.S. Energy Information Administration.
Demand for gasoline in the U.S. increased from 8.24 million b/d to 8.45 for the week ending February 21, according to the U.S. Energy Information Administration (EIA). This compares to 8.47 million b/d a year ago. Meanwhile, total domestic gasoline supply increased from 247.9 million barrels to 248.3, while gasoline production ticked down last week, averaging 9.17 million barrels per day, compared to 9.19 million barrels daily the previous week.
Pump prices may remain fairly steady for now, but will likely rise soon due to the usual seasonal factors. And tariffs will also play a role in pump prices, but it’s difficult to quantify what could happen as there are many variables.
Quick stats
Oregon is one of 46 states and the District of Columbia with lower prices now than a week ago. South Carolina (-12 cents) has the largest week-over-week drop in the nation. Colorado (+5 cents) has the largest week-over-week increase.
California ($4.77) has the most expensive gas in the nation for the 4th week in a row. Hawaii ($4.55) is second, and Washington ($4.13) is third. These are the three states in the country with averages at or above $4 a gallon. This week 18 states and the District of Columbia have averages in the $3-range. There are 29 states with an average in the $2 range this week.
The cheapest gas in the nation is in Mississippi ($2.66) and Texas ($2.69). No state has had an average below $2 a gallon since January 7, 2021, when Mississippi and Texas were below that threshold. At the time, the COVID-19 pandemic drove significant declines in crude oil and gasoline demand in the U.S. and around the world.
The difference between the most expensive and least expensive states is $2.12 this week, compared to $2.16 a week ago.
Oregon is one of 19 states with higher prices now than a month ago. The national average is one cent less and the Oregon average is 17 cents more than a month ago. This is the second-largest monthly increase in the country. California (+29 cents) has the largest month-over-month increases in the country, due to the California refinery issues in the last few weeks. Delaware (-23 cents) has the largest month-over-month drop in the nation.
Oregon is one of 47 states and the District of Columbia with lower prices now than a year ago. The national average is 25 cents less and the Oregon average is 11 cents less than a year ago. Indiana (-57 cents) has the largest yearly drop. Colorado (+14 cents) has the largest year-over-year increase.
West Coast
The West Coast region continues to have the most expensive pump prices in the nation with all seven states in the top 10. It’s typical for the West Coast to have six or seven states in the top 10 as this region tends to consistently have fairly tight supplies, consuming about as much gasoline as is produced. In addition, this region is located relatively far from parts of the country where oil drilling, production and refining occurs, so transportation costs are higher. And environmental programs in this region add to the cost of production, storage and distribution.
| Rank | Region | Price on 3/4/2025 |
| 1 | California | $4.77 |
| 2 | Hawaii | $4.55 |
| 3 | Washington | $4.13 |
| 4 | Nevada | $3.81 |
| 5 | Oregon | $3.74 |
| 6 | Alaska | $3.45 |
| 7 | Arizona | $3.39 |
| 8 | Pennsylvania | $3.30 |
| 9 | Illinois | $3.22 |
| 10 | District of Columbia | $3.22 |
As mentioned above, California has the most expensive gas in the country for the 4th week in a row. Hawaii, Washington, Nevada, Oregon, Alaska, and Arizona round out the top seven. Oregon is fifth for the 22nd week in a row.
All seven states in the West Coast region have week-over-week declines, now that refinery issues in the region have eased:
California (-6 cents), Nevada (-6 cents), Washington (-3 cents), Oregon (-2 cents), Arizona (-2 cents), Alaska (-1 cent), and Hawaii (-1 cent).
The refinery utilization rate on the West Coast dipped from 85.8% to 84.5% for the week ending February 21. This rate has ranged between about 74% to 92% in the last year. The latest national refinery utilization rate rose from 84.9% to 86.5%.
The refinery utilization rate measures how much crude oil refineries are processing as a percentage of their maximum capacity. A low or declining rate can put upward pressure on pump prices, while a high or rising rate can put downward pressure on pump prices.
According to EIA’s latest weekly report, total gas stocks in the region increased from 28.59 million bbl. to 29.36 million bbl. An increase in gasoline stocks can put downward pressure on pump prices, while a decrease in gasoline stocks can put upward pressure on pump prices.
Oil market dynamics
Crude oil prices are lower this week as investors weigh the decision by OPEC+ to end oil production cuts, the war between Russia and Ukraine, and the impact of U.S. tariffs.
At the close of Friday’s formal trading session, WTI slipped 59 cents to settle at $69.76. At the close of Monday’s formal trading session, WTI fell $1.39 to close at $68.37. Today crude is trading around $68 compared to $69 a week ago. Crude prices are about $10 less than a year ago. ($78.74 on March 4, 2024)
Drivers can find current gas prices along their route with the free AAA Mobile app for iPhone, iPad and Android. The app can also be used to map a route, find discounts, book a hotel and access AAA roadside assistance. Learn more at AAA.com/mobile.