35 cities with the most competitive office lease markets
Canva
35 cities with the most competitive office lease markets
Savannah, Georgia, as viewed from the Savannah River.
The years of the COVID-19 pandemic have permanently altered the future of work—and of commercial office space. That’s just fine with most employees who can work remotely, according to polling done in recent months. People whose jobs can be done remotely make up 56% of all full-time workers, according to Gallup, and 60% of them want a permanent work arrangement that is at least hybrid.
That means employers have big decisions anytime a contract on office space comes up for renewal. Higher interest rates, a slowing economy, and shifting work habits have all sent the office real estate market into tumult. And layoffs rippling through the tech sector this year could spell even more vacant office space in cities like San Francisco and New York City, which have traditionally served as tech hubs.
Swyft Filings examined data from commercial real estate firm Lee & Associates’ 2022 North American Market Report to see which real estate markets are the most competitive for securing an office lease. Markets, which can include the main city as well as surrounding towns, were ranked by the percentage of vacant office space available. To be considered competitive, markets had to have a vacancy rate below the national average, which was 12.5% in the U.S. Cities and data for Canada were excluded from this analysis.
Many businesses are still maintaining onsite operations, but American offices are hovering around 44% of prepandemic occupancy in 2022, according to commercial office security firm Kastle Systems. The firm tracks how much use physical offices get across 2,600 buildings and 41,000 companies in 47 states. The popularity of remote work—and decreased interest in returning fully onsite— is just one factor associated with the demand for leasing office space.
In fall 2022, the major metropolitan areas of Dallas-Fort Worth, Houston, and Austin led occupancy rates in the country with offices that were nearly half-full some weeks, according to Kastle Systems. But that’s still far below how full office spaces were before the pandemic. And Texas metros still have far more vacancies than the most competitive office leasing markets. That’s because competitiveness has more to do with how much overall office space has been leased—regardless of the use that space gets by the company.
Competitive markets in this list tend to be in smaller cities where people have been moving to since 2020, coming in well above the U.S. national average of $2.92 per square foot rent and $339 per square foot sale price. Metros including Savannah, Georgia; San Luis Obispo, California; and Spartanburg, South Carolina, are currently seeing some of the most competitive office space markets in the country.
![]()
Canva
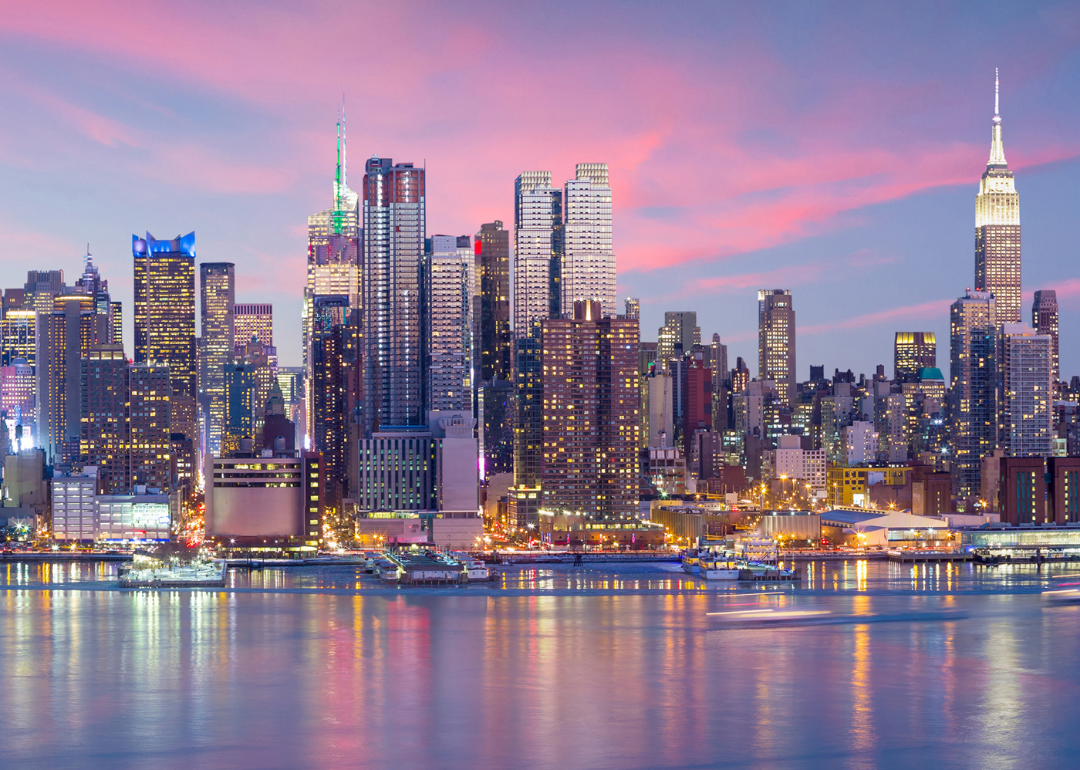
#35. New York City
The New York City skyline.
– Vacancy rate: 12.3%
– Market rent: $4.77 per square foot
– Market sale price: $691 per square foot
– Office space under construction: 17,874,850 square feet
– Office space inventory: 971,927,770 square feet
Canva
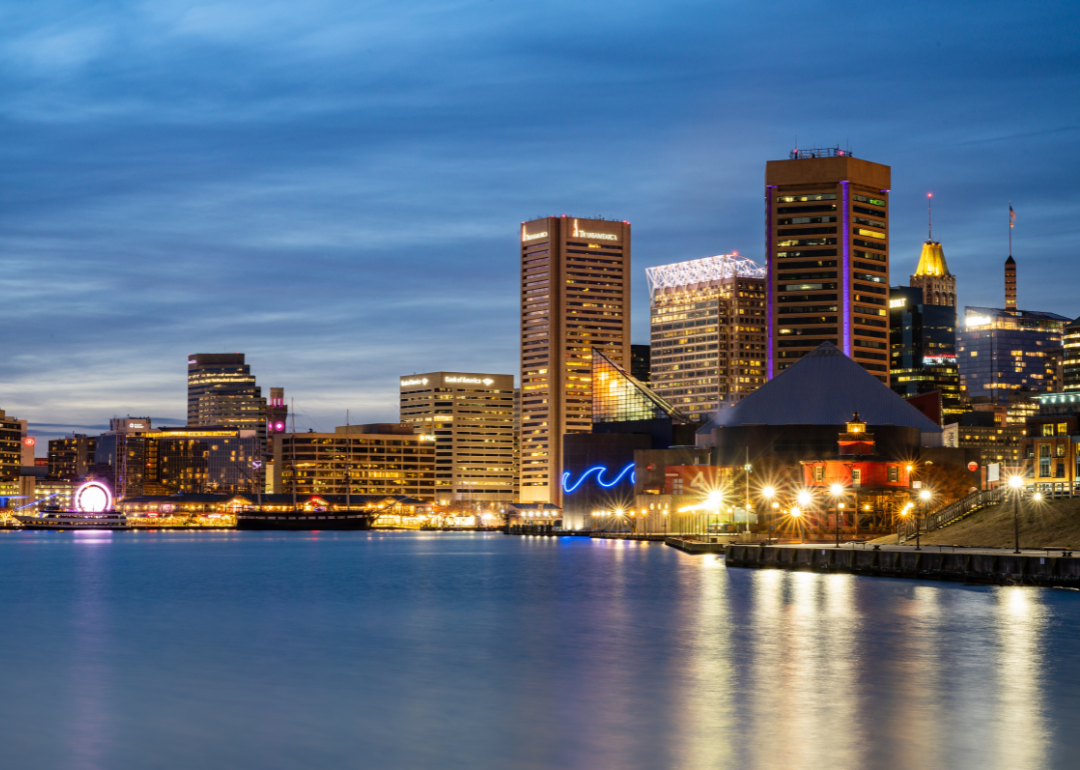
#34. Baltimore
Baltimore at dusk.
– Vacancy rate: 11.6%
– Market rent: $2.03 per square foot
– Market sale price: $184 per square foot
– Office space under construction: 1,640,147 square feet
– Office space inventory: 151,210,535 square feet
Canva
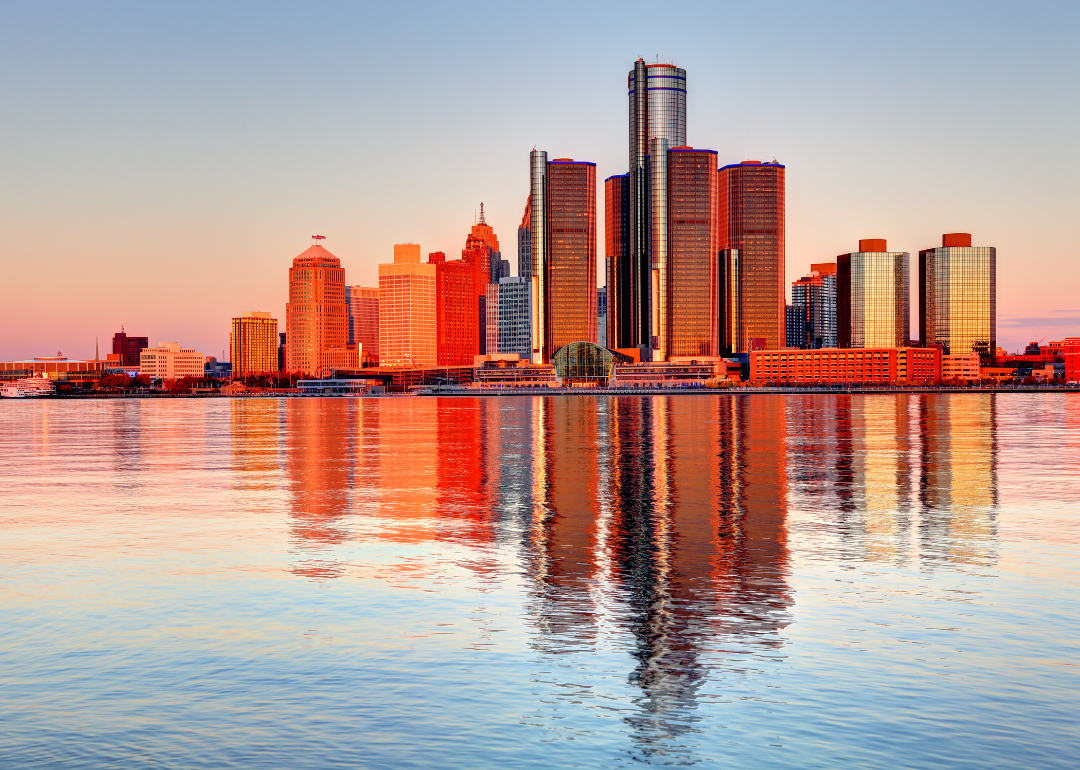
#33. Detroit
Detroit as viewed from the water.
– Vacancy rate: 11.4%
– Market rent: $1.78 per square foot
– Market sale price: $132 per square foot
– Office space under construction: 1,480,551 square feet
– Office space inventory: 198,968,136 square feet
Canva
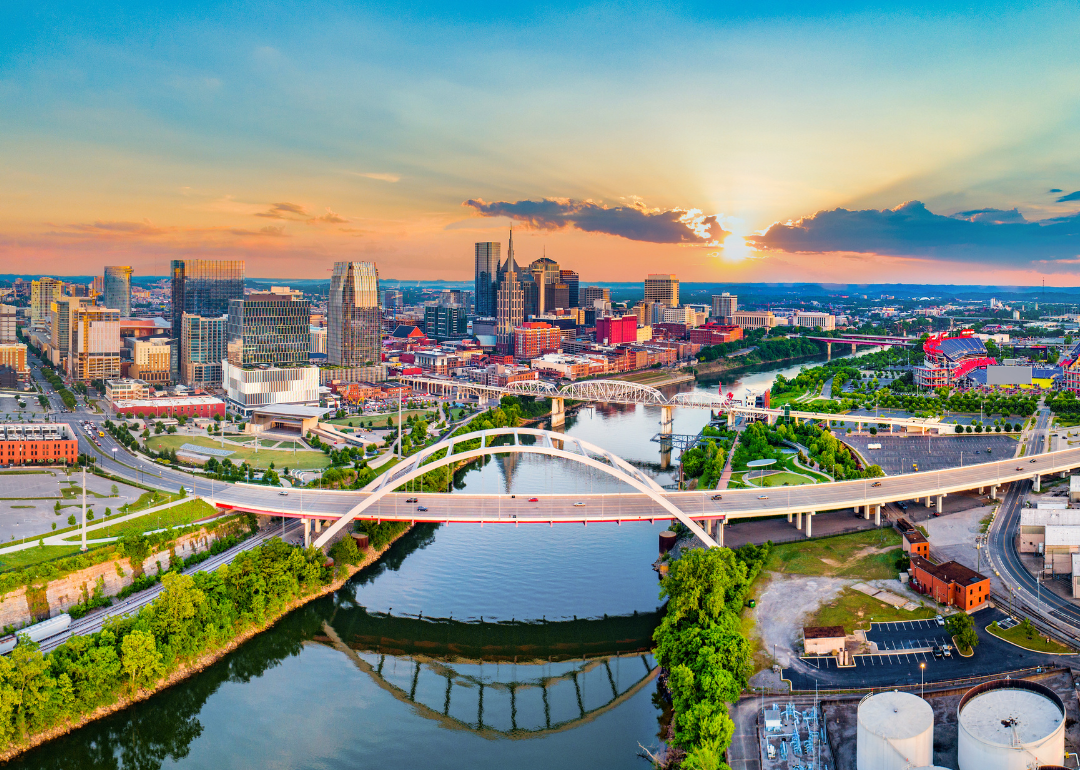
#32. Nashville, Tennessee
An aerial view of Nashville, Tennessee.
– Vacancy rate: 11.2%
– Market rent: $2.49 per square foot
– Market sale price: $243 per square foot
– Office space under construction: 3,866,778 square feet
– Office space inventory: 101,173,941 square feet
Canva
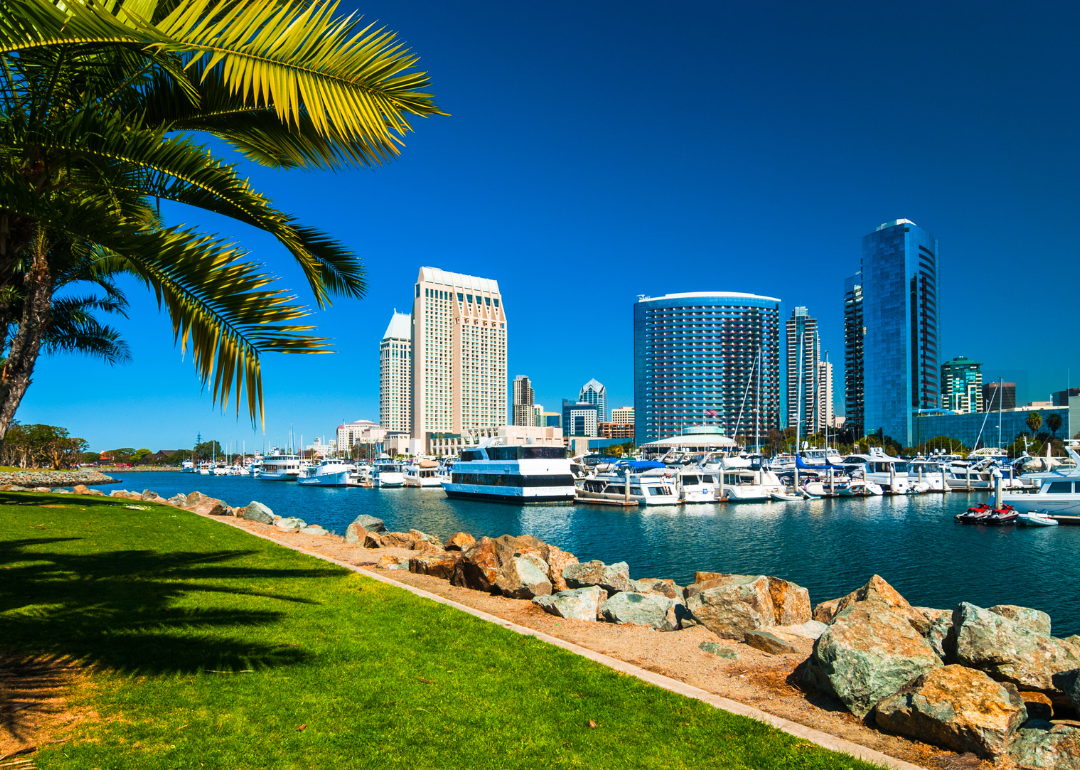
#31. San Diego
The San Diego skyline.
– Vacancy rate: 11.0%
– Market rent: $3.14 per square foot
– Market sale price: $373 per square foot
– Office space under construction: 3,964,079 square feet
– Office space inventory: 119,345,048 square feet

Canva
#30. Cincinnati
Cincinnati, Ohio, at night.
– Vacancy rate: 10.7%
– Market rent: $1.68 per square foot
– Market sale price: $112 per square foot
– Office space under construction: 280,522 square feet
– Office space inventory: 104,247,147 square feet
Canva
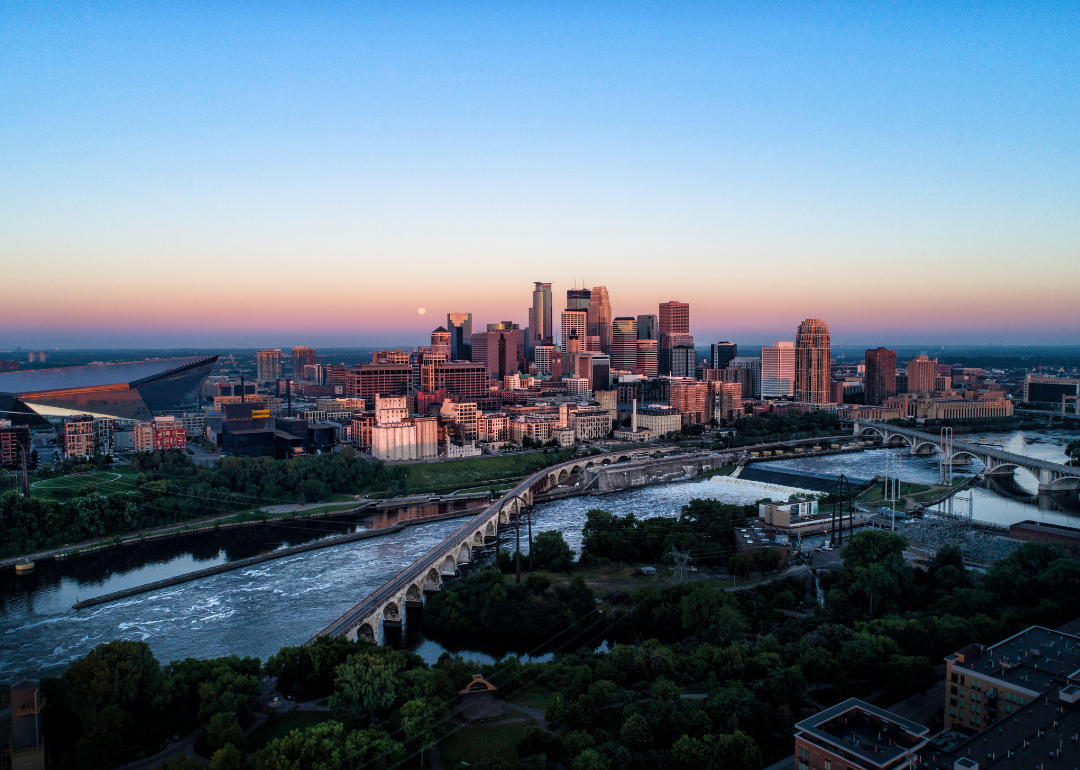
#29. Minneapolis
Minneapolis at sunsrise.
– Vacancy rate: 10.5%
– Market rent: $2.18 per square foot
– Market sale price: $175 per square foot
– Office space under construction: 867,528 square feet
– Office space inventory: 201,989,507 square feet
Canva
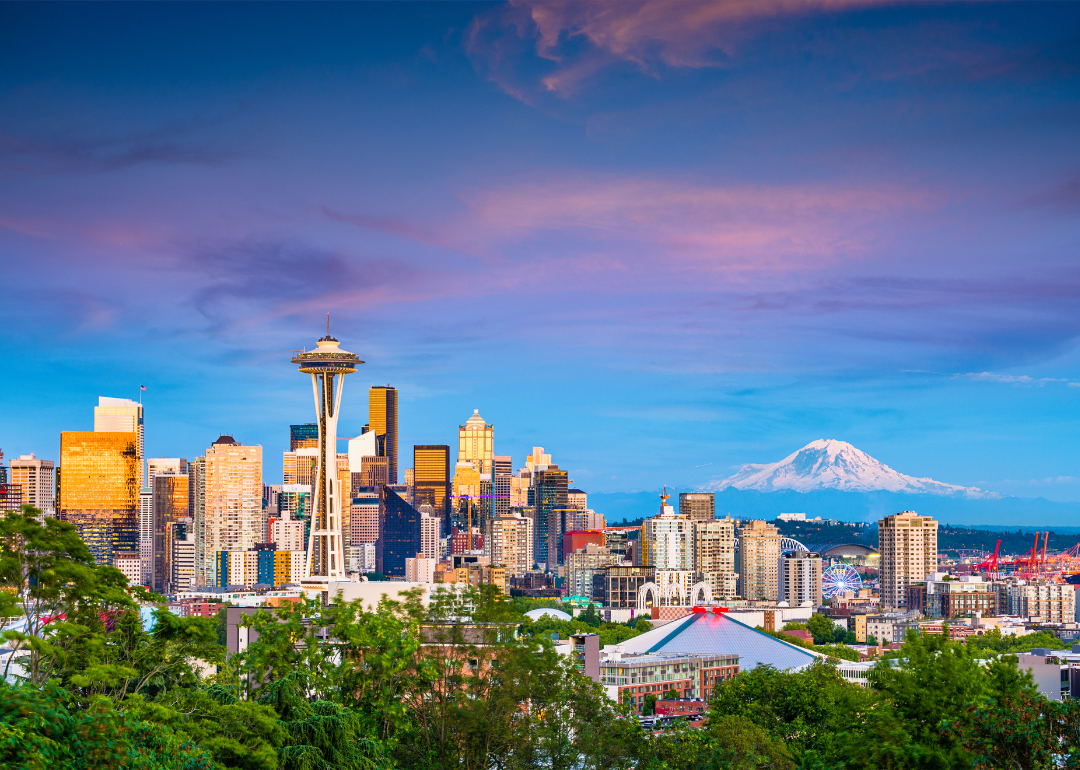
#28. Seattle
The Seattle skyline.
– Vacancy rate: 10.5%
– Market rent: $3.21 per square foot
– Market sale price: $515 per square foot
– Office space under construction: 11,542,742 square feet
– Office space inventory: 227,264,528 square feet

Canva
#27. Philadelphia
The downtown skyline of Philadelphia.
– Vacancy rate: 10.3%
– Market rent: $2.24 per square foot
– Market sale price: $194 per square foot
– Office space under construction: 2,328,362 square feet
– Office space inventory: 323,121,188 square feet
Canva
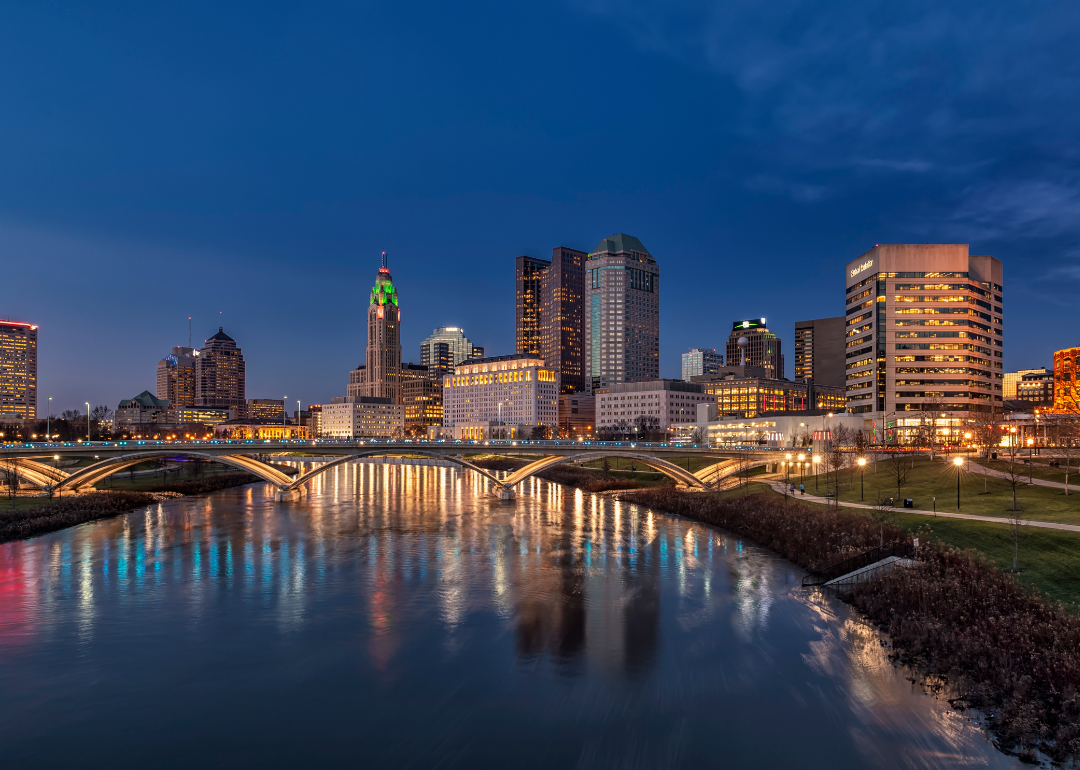
#26. Columbus, Ohio
Columbus, Ohio, at night.
– Vacancy rate: 10.0%
– Market rent: $1.78 per square foot
– Market sale price: $120 per square foot
– Office space under construction: 1,650,071 square feet
– Office space inventory: 116,424,108 square feet
Canva
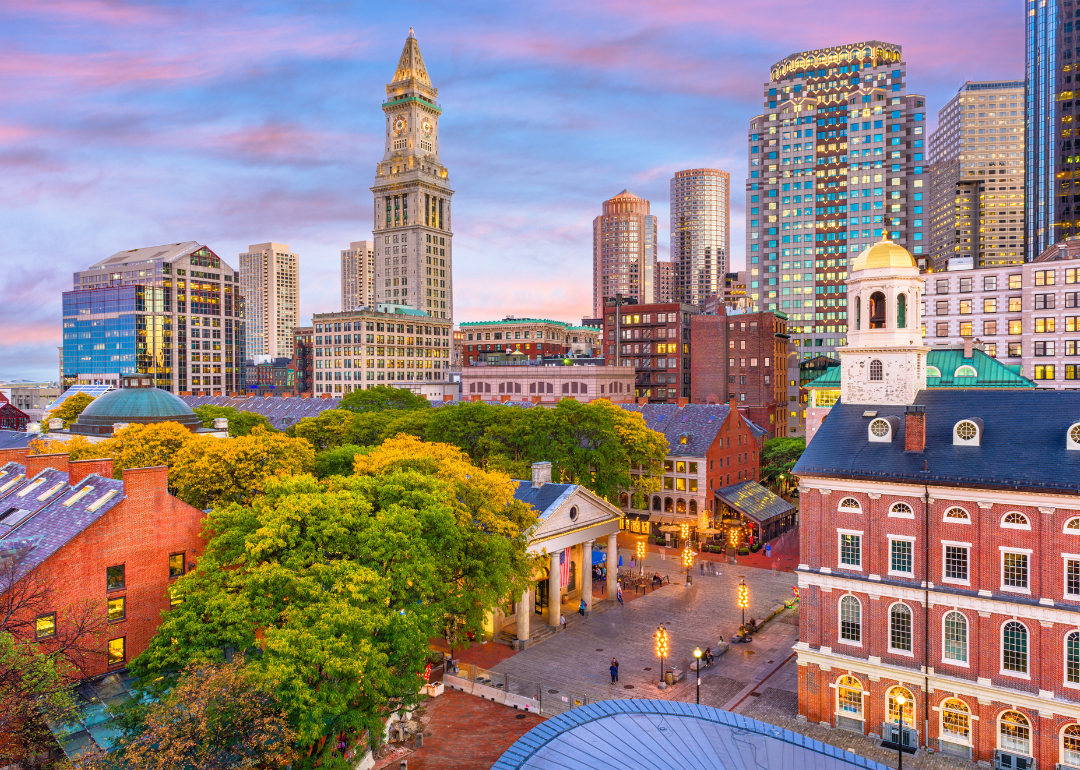
#25. Boston
Boston, Massachusetts.
– Vacancy rate: 9.9%
– Market rent: $3.53 per square foot
– Market sale price: $479 per square foot
– Office space under construction: 15,992,227 square feet
– Office space inventory: 367,720,289 square feet
Canva
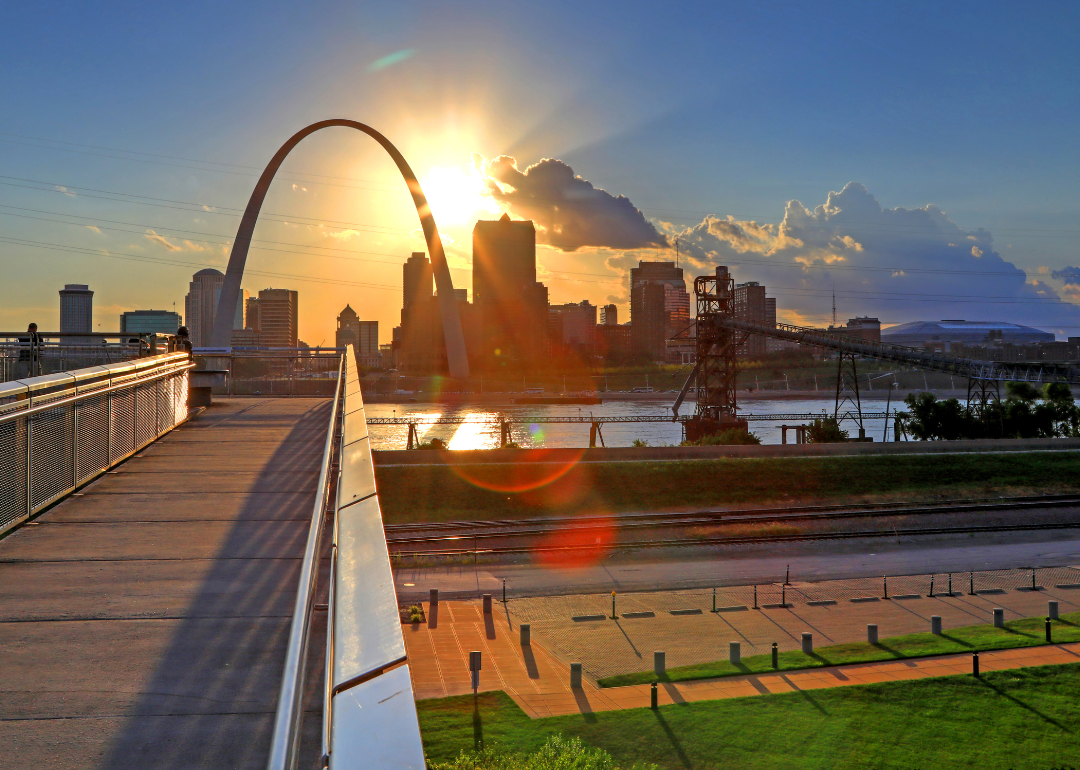
#24. St. Louis
The St. Louis, Missouri, skyline.
– Vacancy rate: 9.8%
– Market rent: $1.77 per square foot
– Market sale price: $134 per square foot
– Office space under construction: 2,791,747 square feet
– Office space inventory: 145,638,836 square feet
Canva
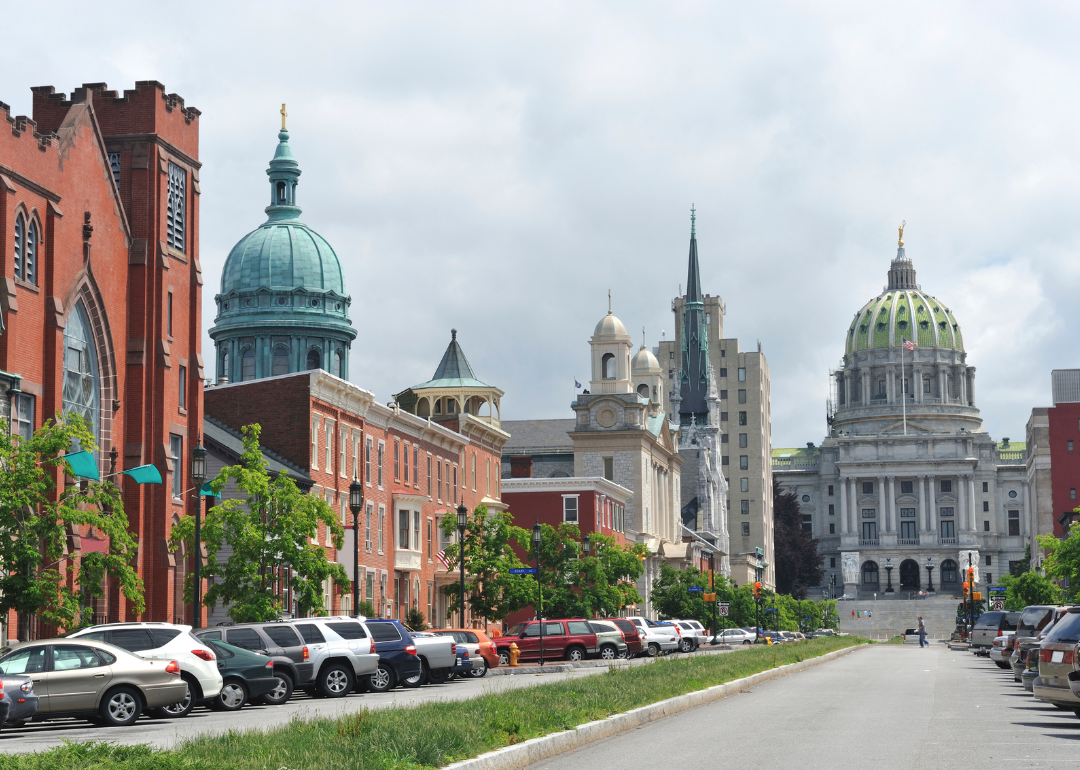
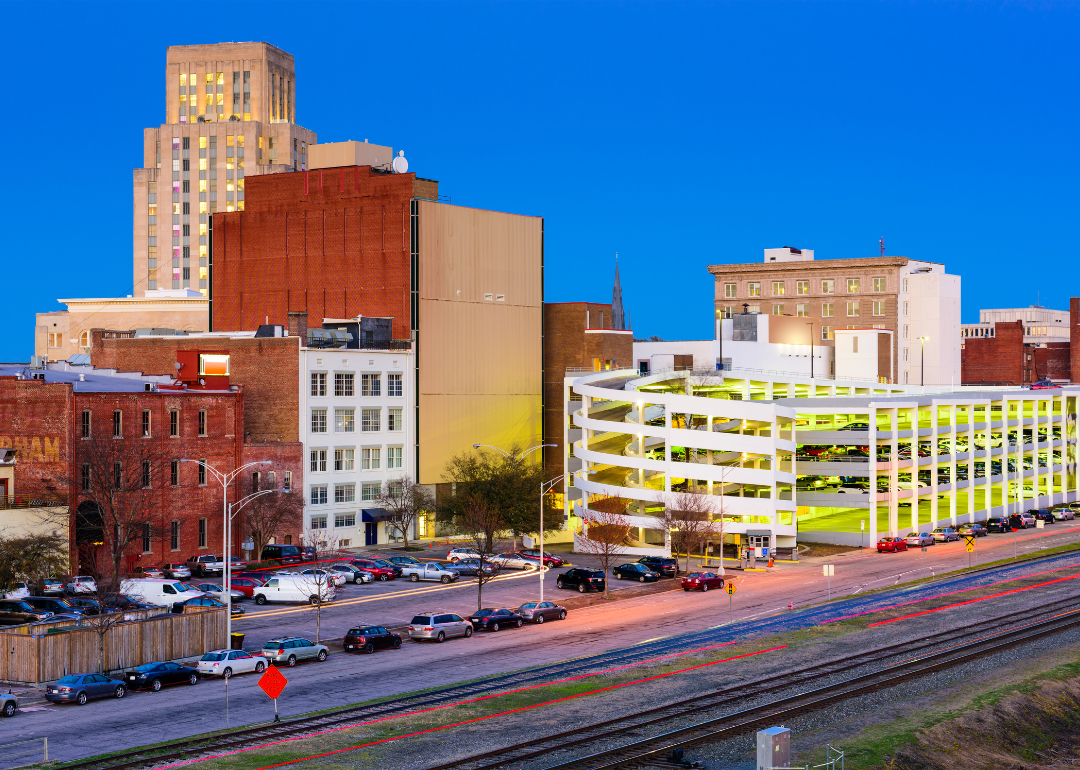
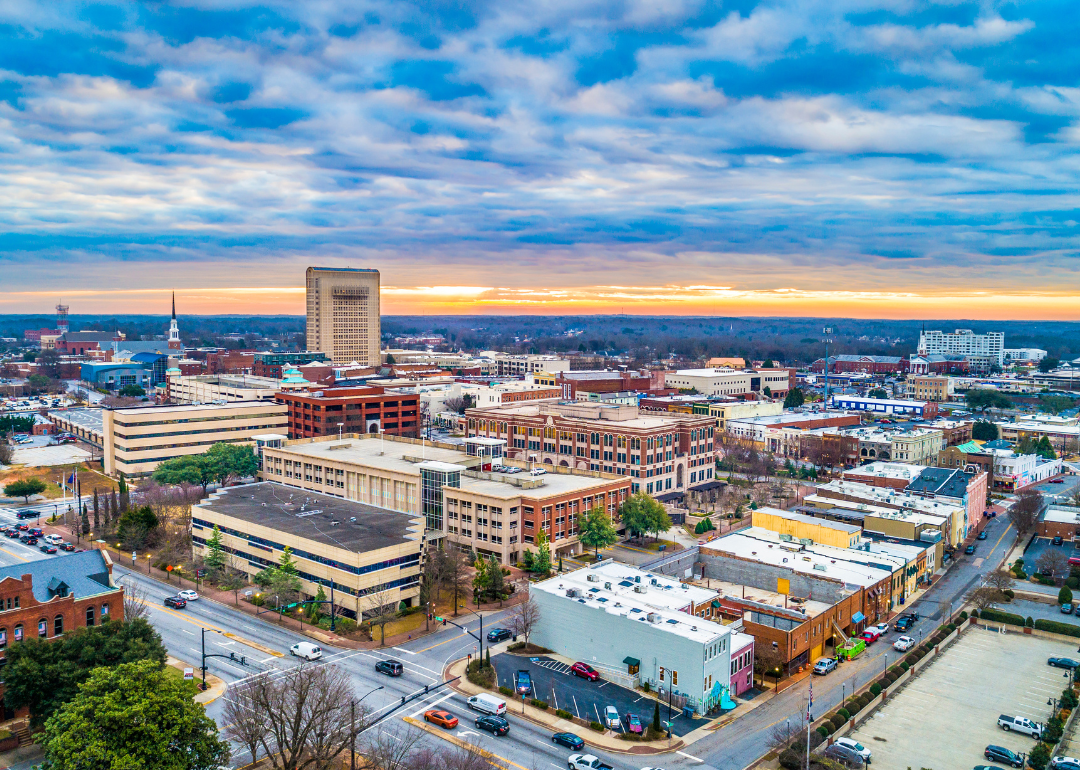
#23. Harrisburg, Pennsylvania
A street view of Harrisburg, Pennsylvania.
– Vacancy rate: 9.6%
– Market rent: $1.52 per square foot
– Market sale price: $128 per square foot
– Office space under construction: 102,990 square feet
– Office space inventory: 36,890,894 square feet
Canva
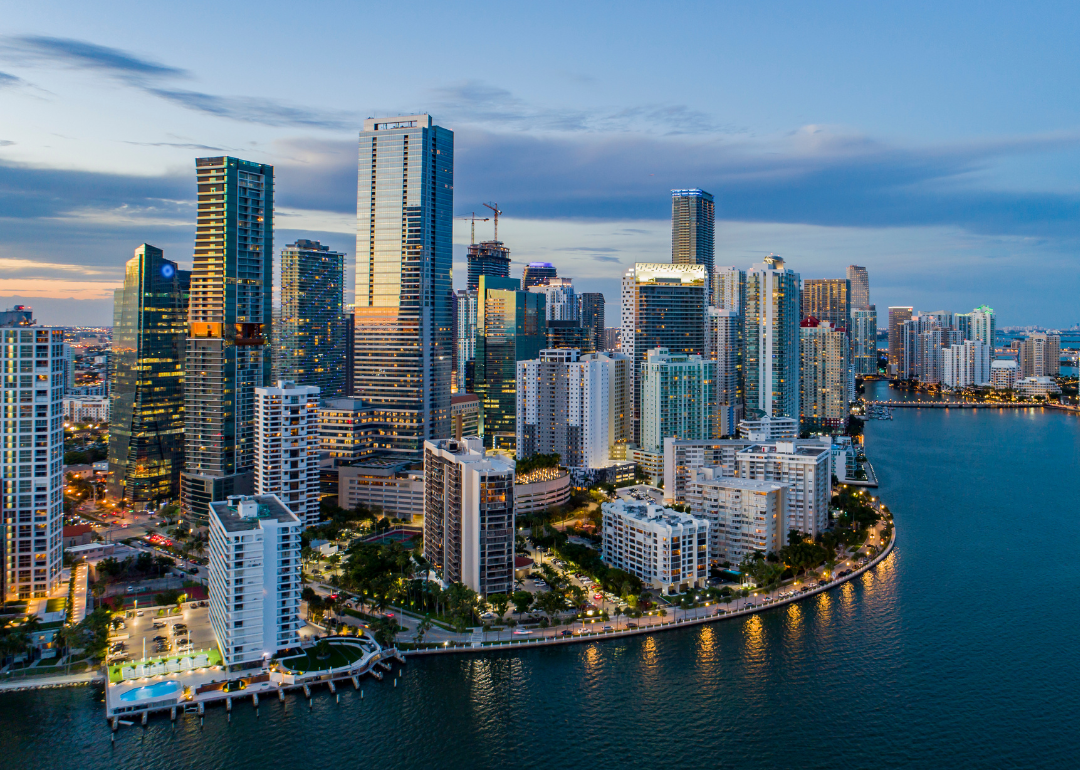
#22. Miami
Downtown Miami, Florida, at night.
– Vacancy rate: 9.5%
– Market rent: $3.68 per square foot
– Market sale price: $389 per square foot
– Office space under construction: 4,371,345 square feet
– Office space inventory: 112,668,267 square feet
Canva
#21. Durham, North Carolina
Durham, North Carolina.
– Vacancy rate: 9.4%
– Market rent: $2.22 per square foot
– Market sale price: $243 per square foot
– Office space under construction: 675,625 square feet
– Office space inventory: 36,086,937 square feet
Canva
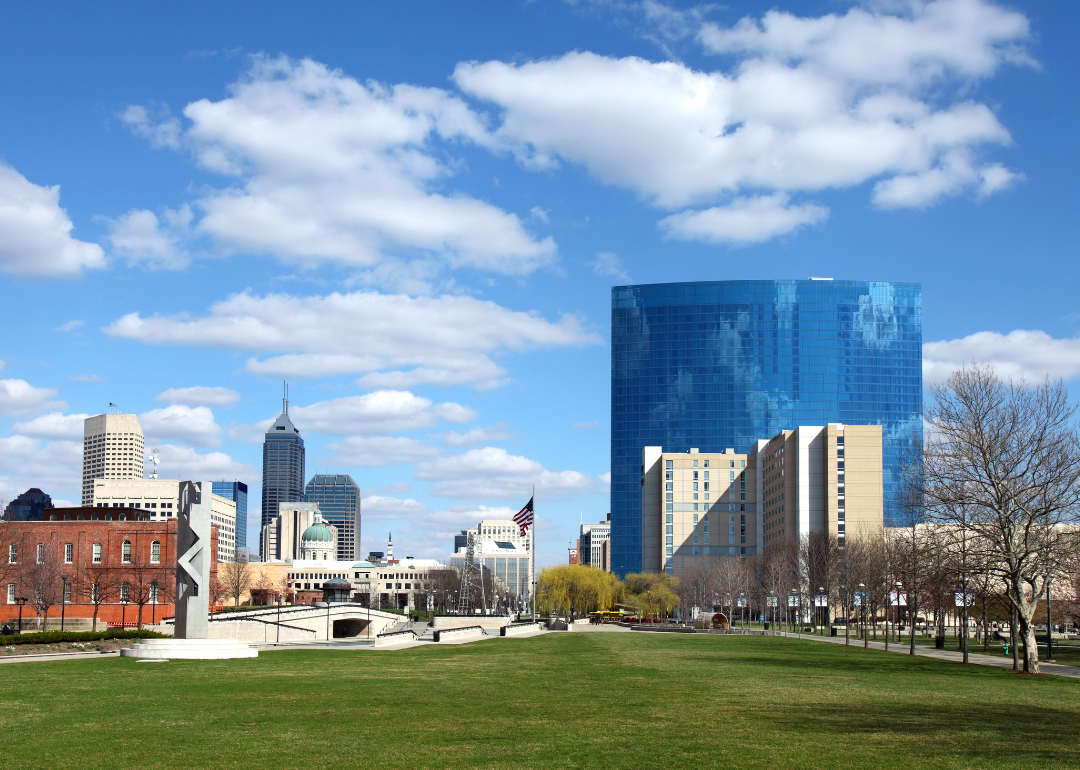
#20. Indianapolis
Indianapolis, as viewed from a park.
– Vacancy rate: 8.6%
– Market rent: $1.75 per square foot
– Market sale price: $135 per square foot
– Office space under construction: 271,602 square feet
– Office space inventory: 109,830,369 square feet
Canva
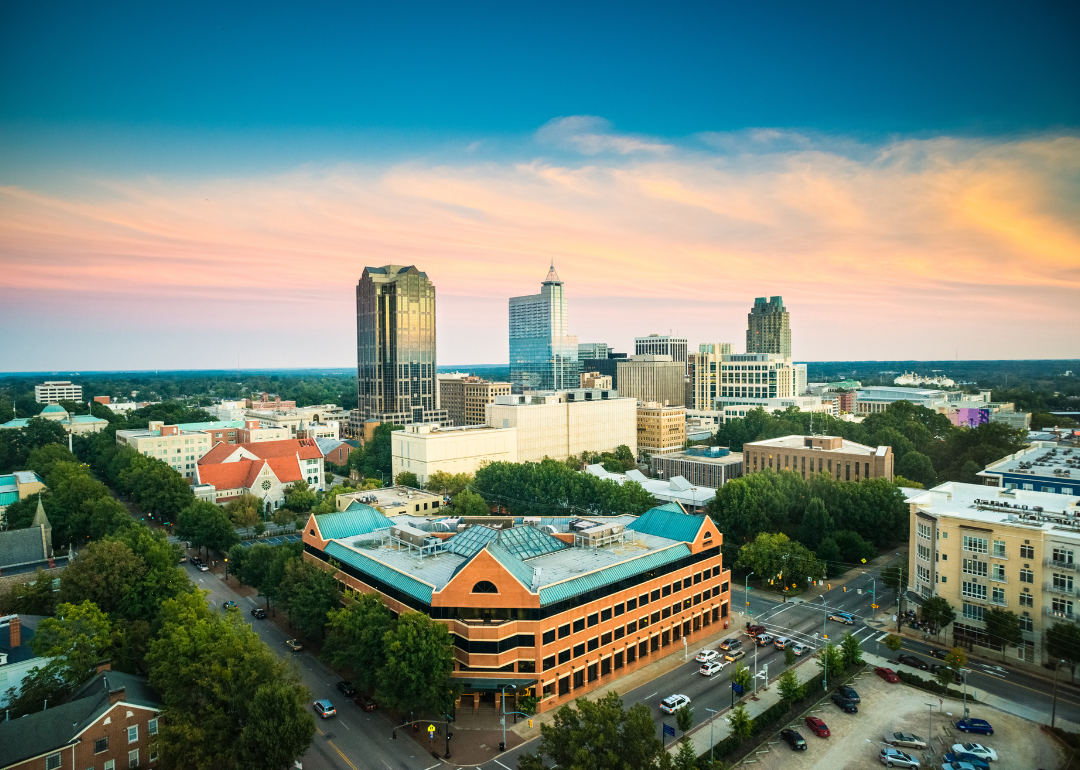
#19. Raleigh, North Carolina
An aerial view of Raleigh, North Carolina.
– Vacancy rate: 8.5%
– Market rent: $2.35 per square foot
– Market sale price: $236 per square foot
– Office space under construction: 2,239,565 square feet
– Office space inventory: 77,287,269 square feet
Canva
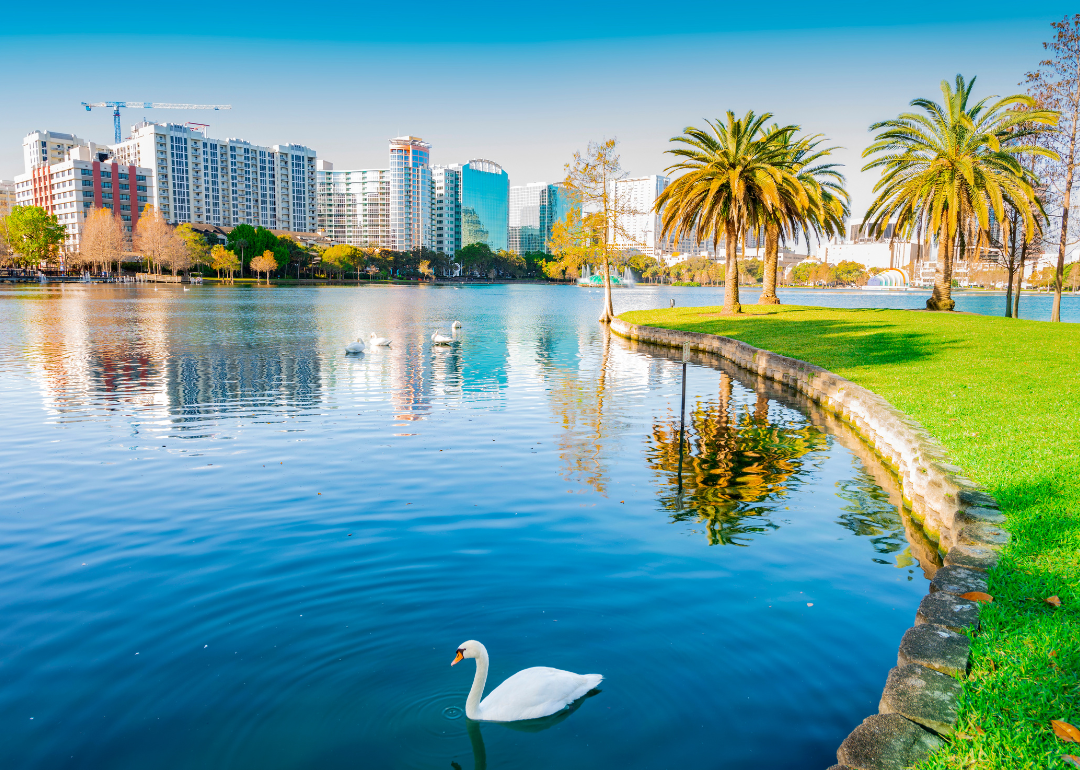
#18. Orlando, Florida
The Orlando skyline, as seen from a distance.
– Vacancy rate: 8.1%
– Market rent: $2.26 per square foot
– Market sale price: $203 per square foot
– Office space under construction: 1,758,393 square feet
– Office space inventory: 102,505,999 square feet
Canva
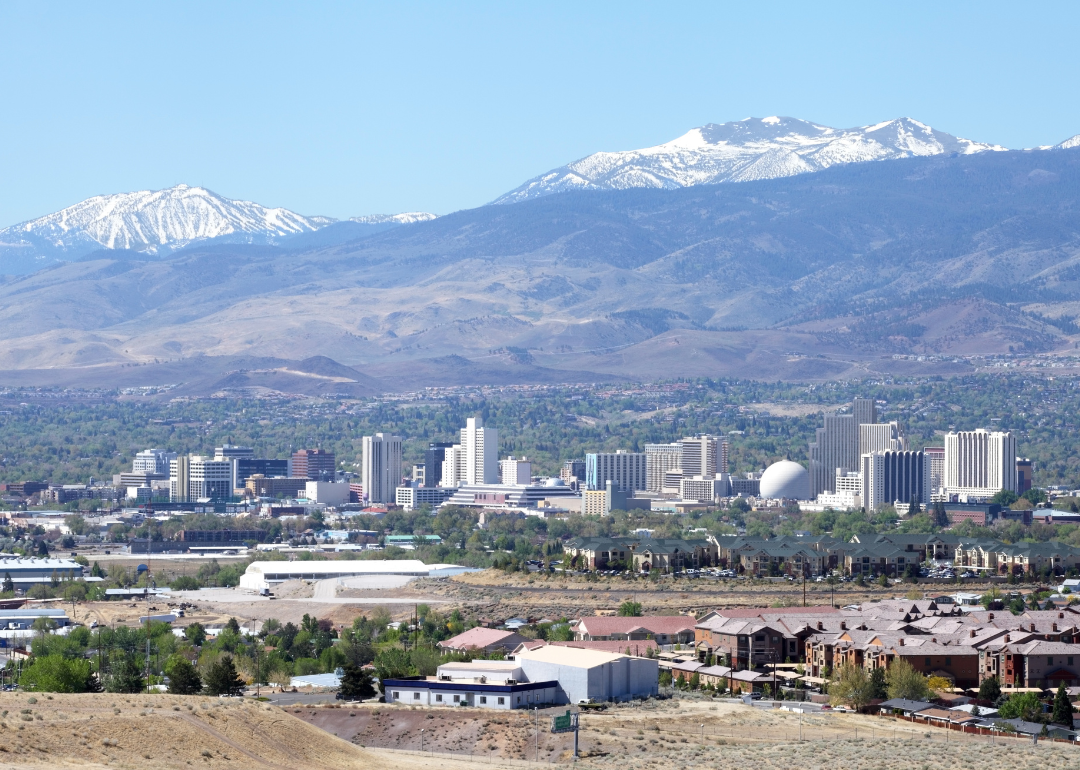
#17. Reno, Nevada
Reno, Nevada, and the mountains in the distance.
– Vacancy rate: 8.1%
– Market rent: $2.05 per square foot
– Market sale price: $206 per square foot
– Office space under construction: 330,267 square feet
– Office space inventory: 17,268,092 square feet
Canva
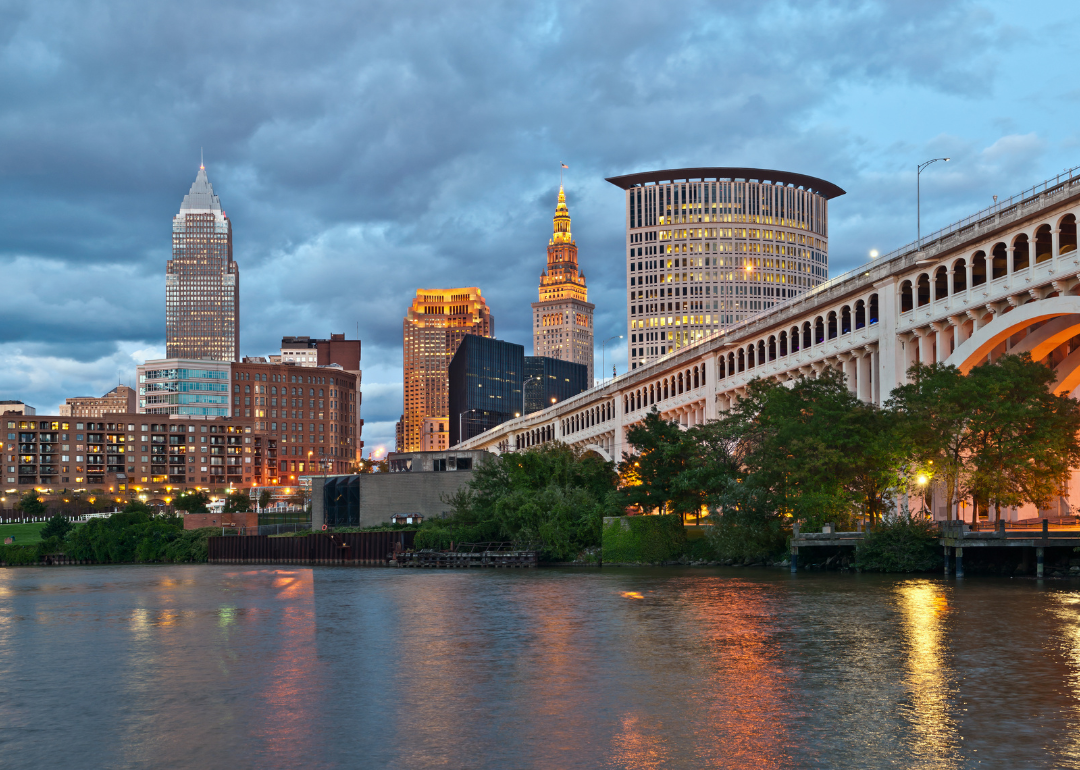
#16. Cleveland
Cleveland, Ohio.
– Vacancy rate: 8.1%
– Market rent: $1.60 per square foot
– Market sale price: $114 per square foot
– Office space under construction: 2,180,131 square feet
– Office space inventory: 108,514,401 square feet
Canva
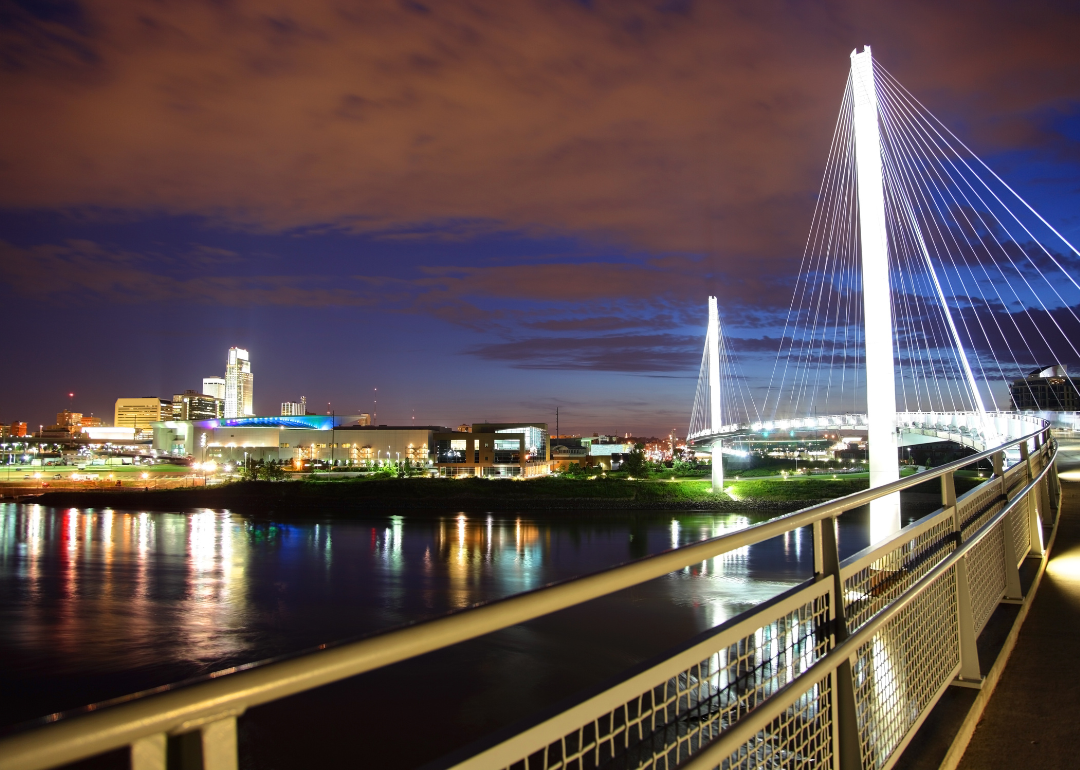
#15. Omaha, Nebraska
Omaha, Nebraska, at night.
– Vacancy rate: 8.0%
– Market rent: $1.97 per square foot
– Market sale price: $150 per square foot
– Office space under construction: 413,298 square feet
– Office space inventory: 47,618,507 square feet
Canva
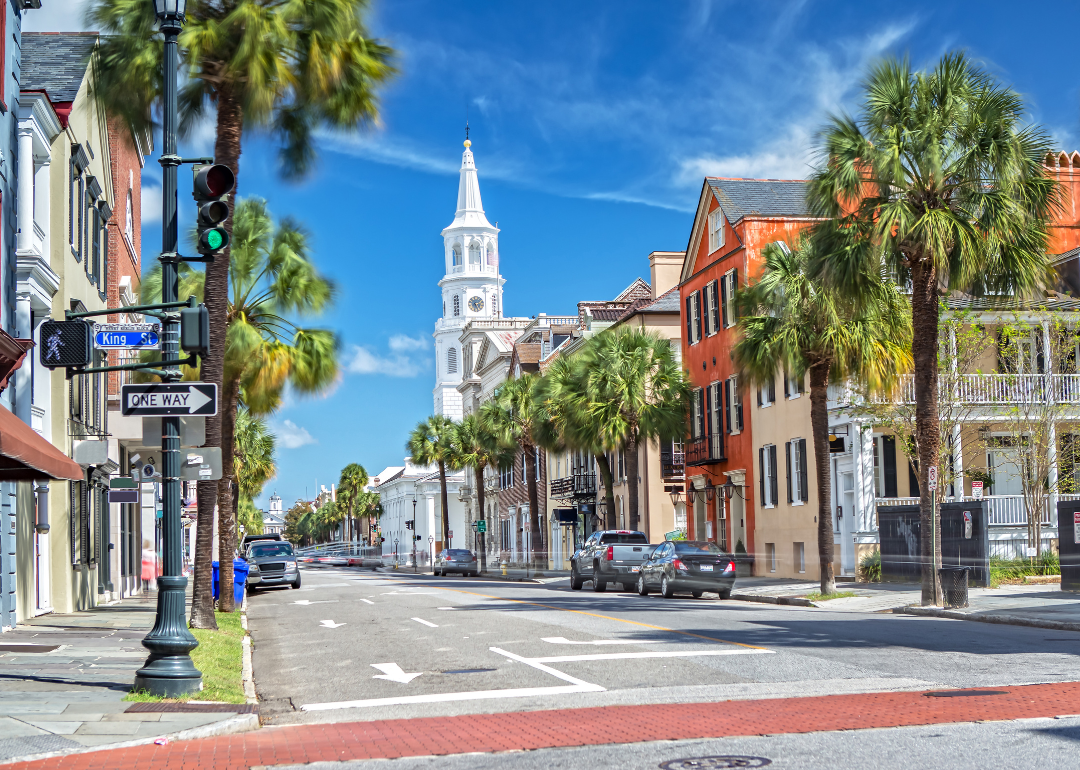
#14. Charleston, South Carolina
St. Michaels Church and Broad St. in Charleston, South Carolina.
– Vacancy rate: 7.8%
– Market rent: $2.48 per square foot
– Market sale price: $219 per square foot
– Office space under construction: 764,109 square feet
– Office space inventory: 32,644,417 square feet
Canva
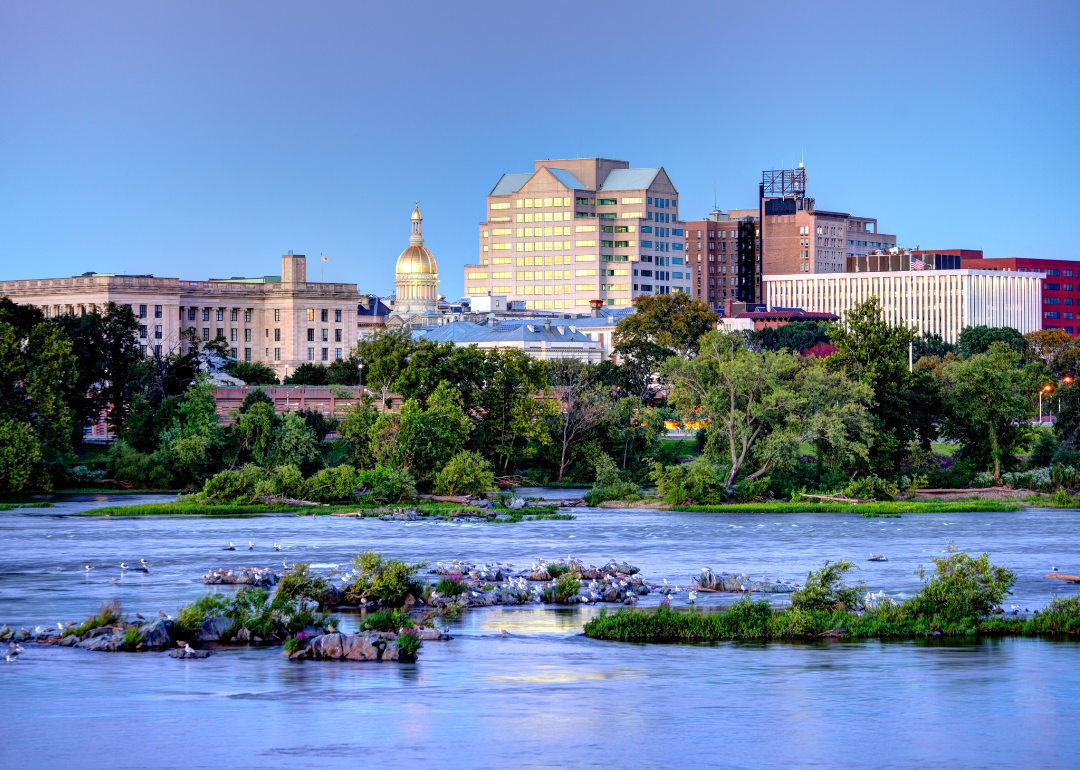
#13. Trenton, New Jersey
Trenton, New Jersey.
– Vacancy rate: 7.6%
– Market rent: $2.42 per square foot
– Market sale price: $182 per square foot
– Office space under construction: 0 square feet
– Office space inventory: 32,047,005 square feet
Canva
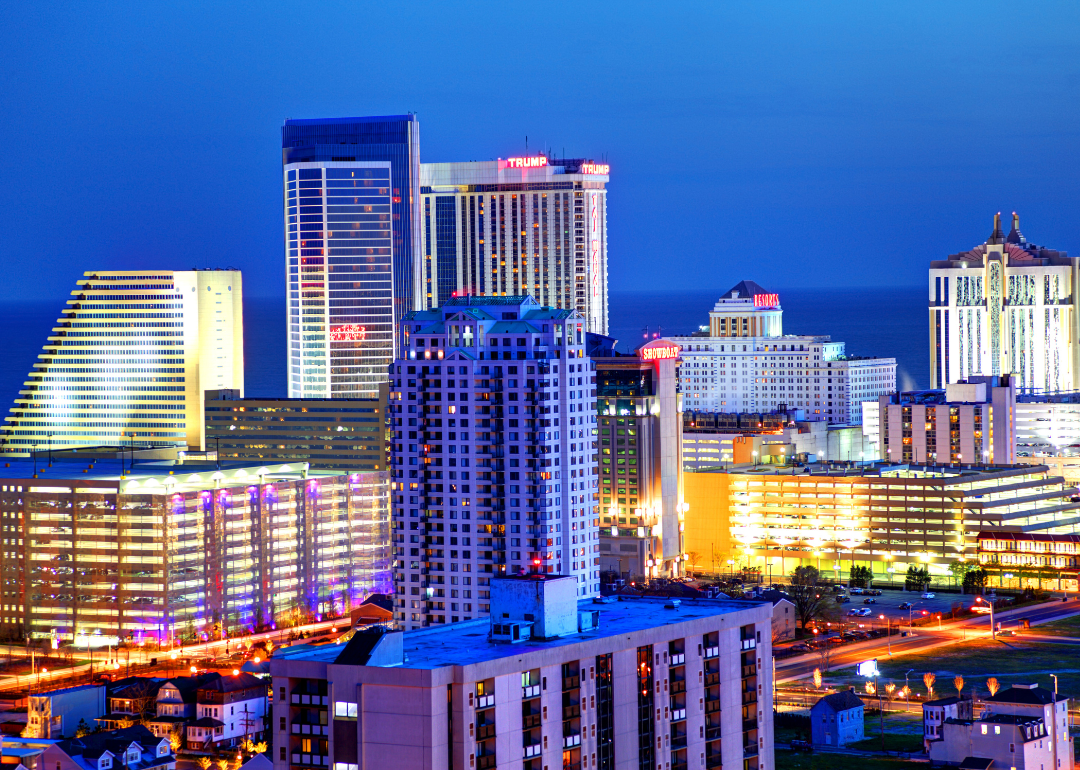
#12. Atlantic City, New Jersey
Atlantic City, New Jersey, at night.
– Vacancy rate: 7.3%
– Market rent: $1.89 per square foot
– Market sale price: $151 per square foot
– Office space under construction: 11,000 square feet
– Office space inventory: 7,321,777 square feet
Canva
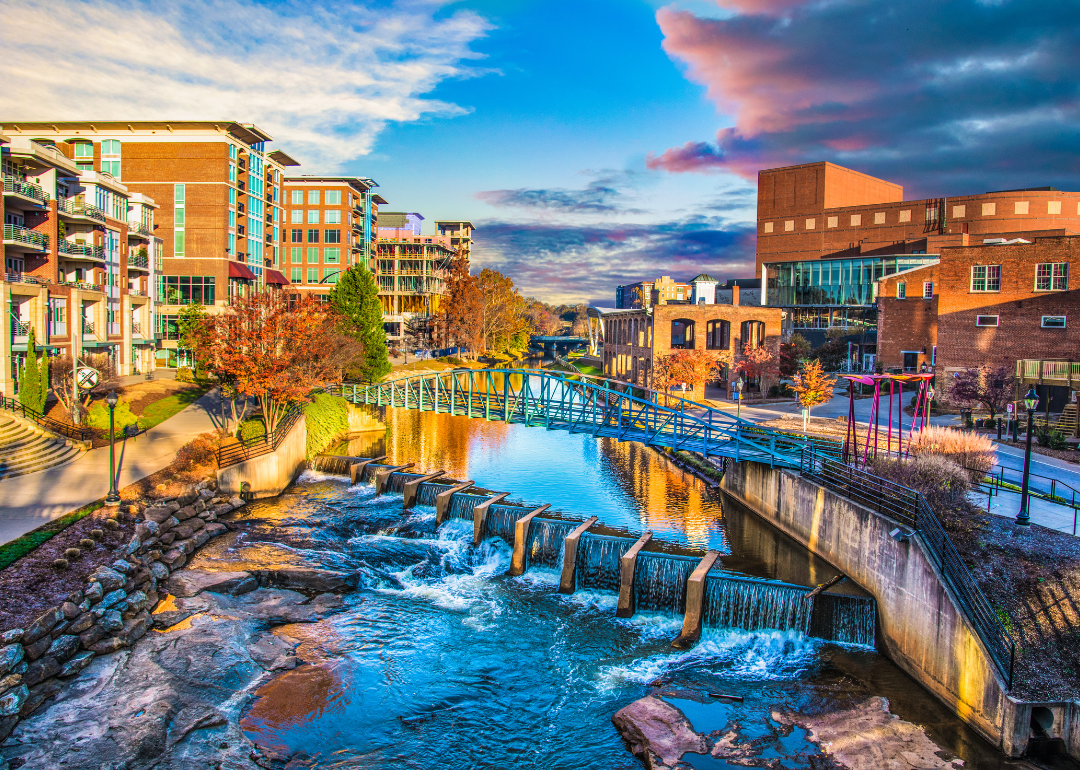
#11. Greenville, South Carolina
Greenville, South Carolina.
– Vacancy rate: 7.1%
– Market rent: $1.76 per square foot
– Market sale price: $151 per square foot
– Office space under construction: 663,275 square feet
– Office space inventory: 34,883,145 square feet
Canva
#10. Naples, Florida
The skyline in Naples, Florida.
– Vacancy rate: 6.0%
– Market rent: $2.53 per square foot
– Market sale price: $262 per square foot
– Office space under construction: 149,060 square feet
– Office space inventory: 9,983,247 square feet
Canva
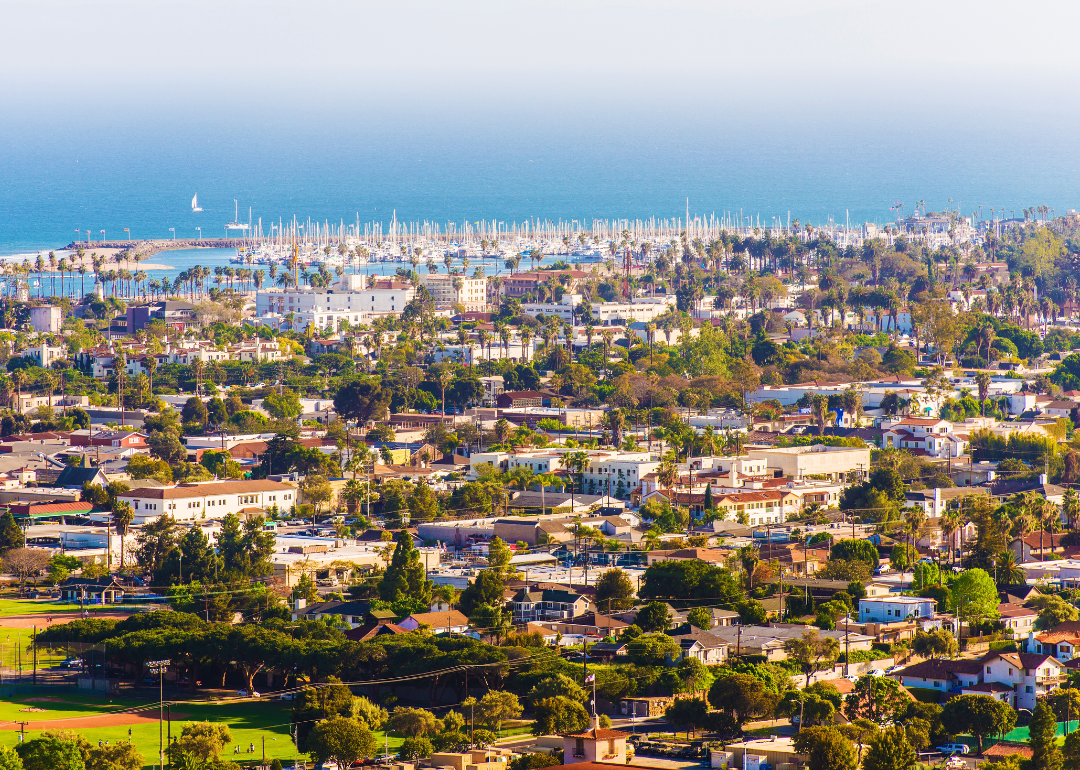
#9. Santa Barbara, California
Santa Barbara, California, on a sunny day.
– Vacancy rate: 5.7%
– Market rent: $2.61 per square foot
– Market sale price: $380 per square foot
– Office space under construction: 20,000 square feet
– Office space inventory: 12,809,700 square feet
Canva
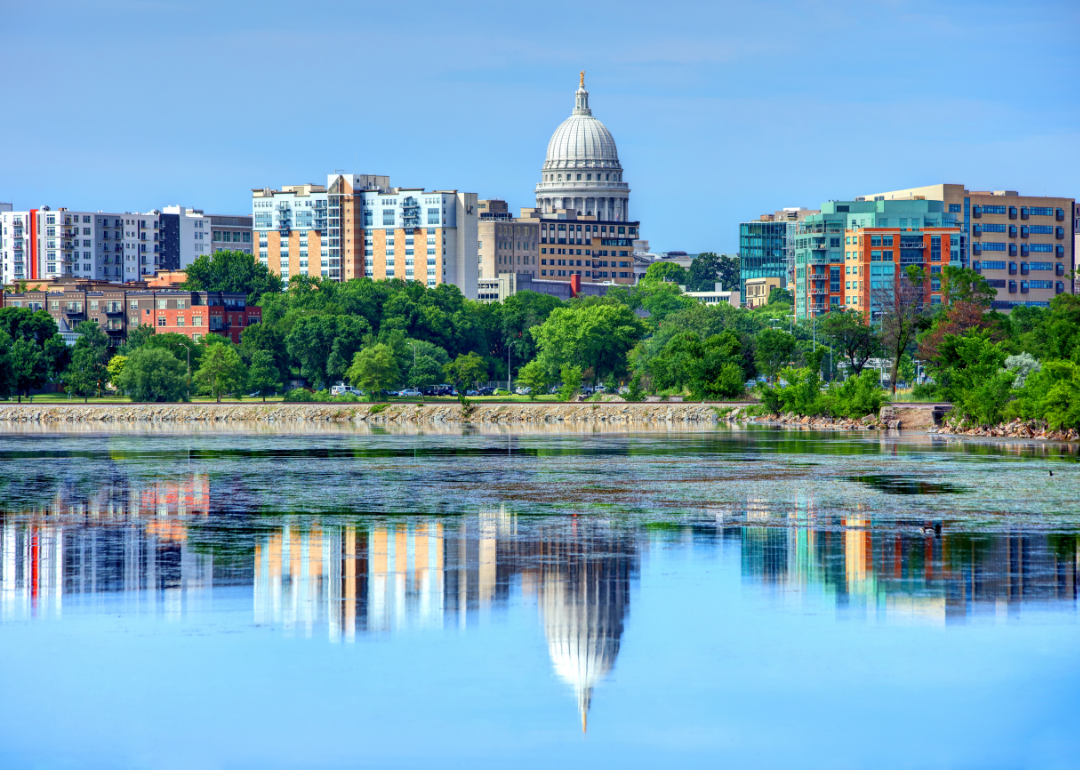
#8. Madison, Wisconsin
Madison, Wisconsin.
– Vacancy rate: 5.6%
– Market rent: $1.88 per square foot
– Market sale price: $140 per square foot
– Office space under construction: 244,800 square feet
– Office space inventory: 38,086,219 square feet
Canva
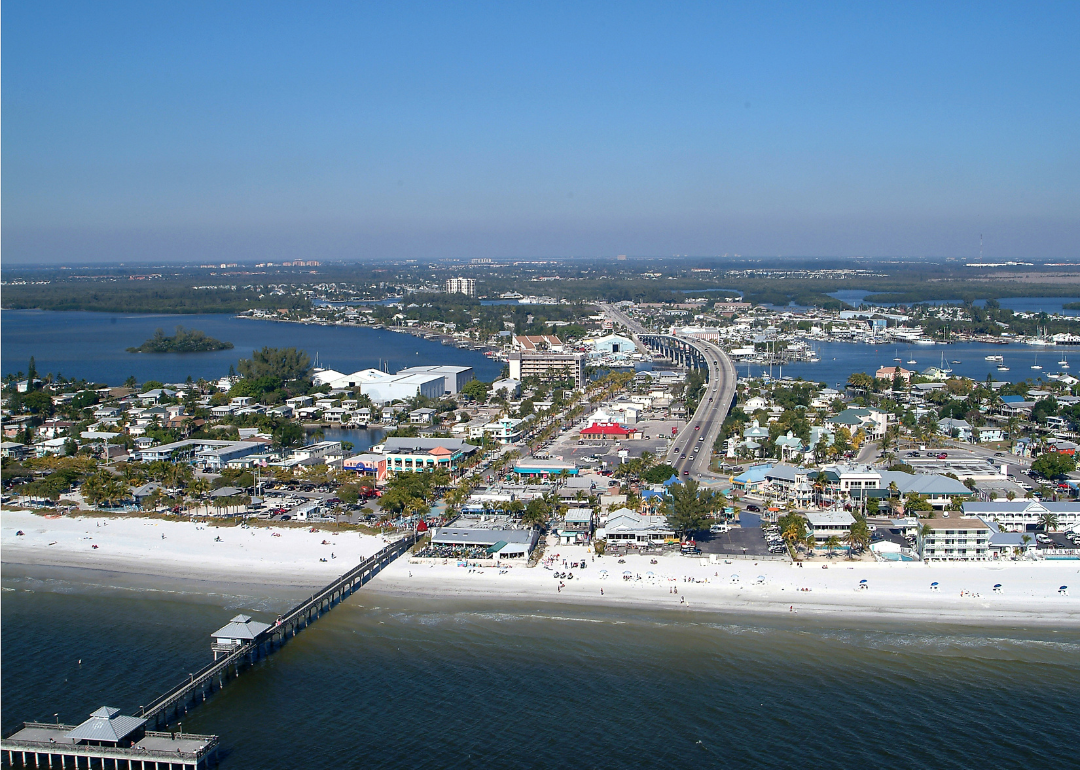
#7. Fort Myers, Florida
An aerial view of Fort Myers Beach.
– Vacancy rate: 4.9%
– Market rent: $1.81 per square foot
– Market sale price: $178 per square foot
– Office space under construction: 154,942 square feet
– Office space inventory: 21,627,928 square feet
Nick Vendetta // Shutterstock
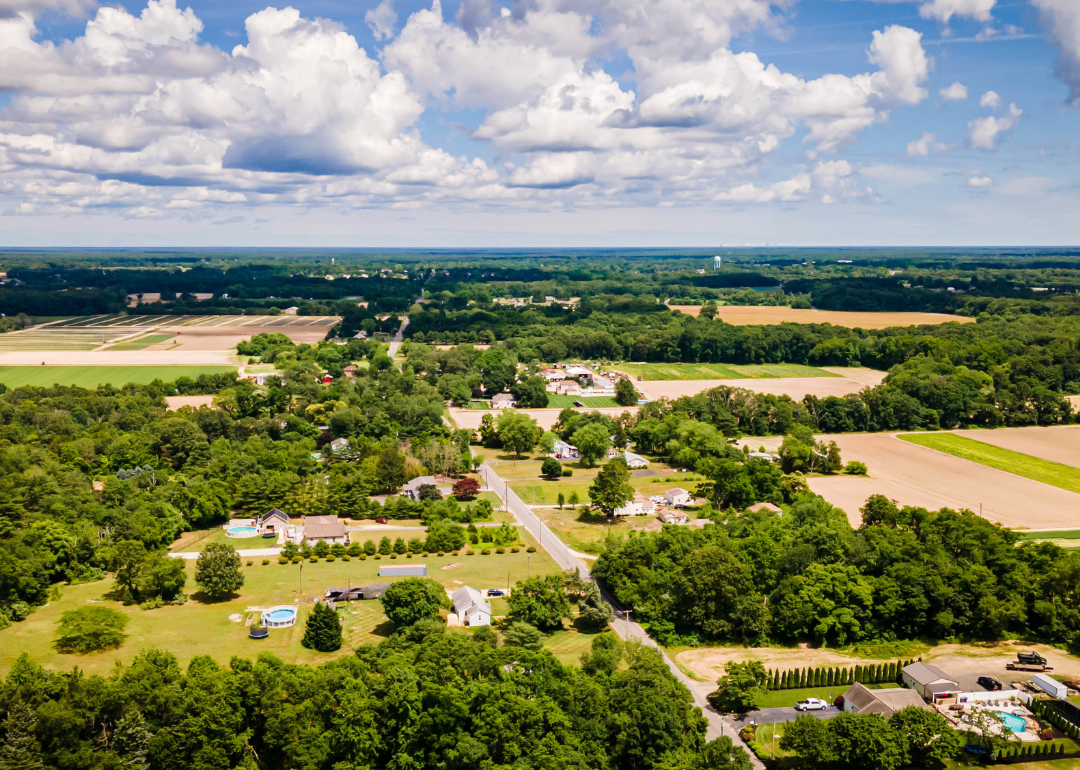
#6. Vineland, New Jersey
An aerial view of Vineland, New Jersey.
– Vacancy rate: 4.9%
– Market rent: $1.58 per square foot
– Market sale price: $121 per square foot
– Office space under construction: 0 square feet
– Office space inventory: 2,595,882 square feet
Canva
#5. Stockton, California
Stockton, California.
– Vacancy rate: 4.7%
– Market rent: $1.81 per square foot
– Market sale price: $194 per square foot
– Office space under construction: 0 square feet
– Office space inventory: 12,982,648 square feet
Canva
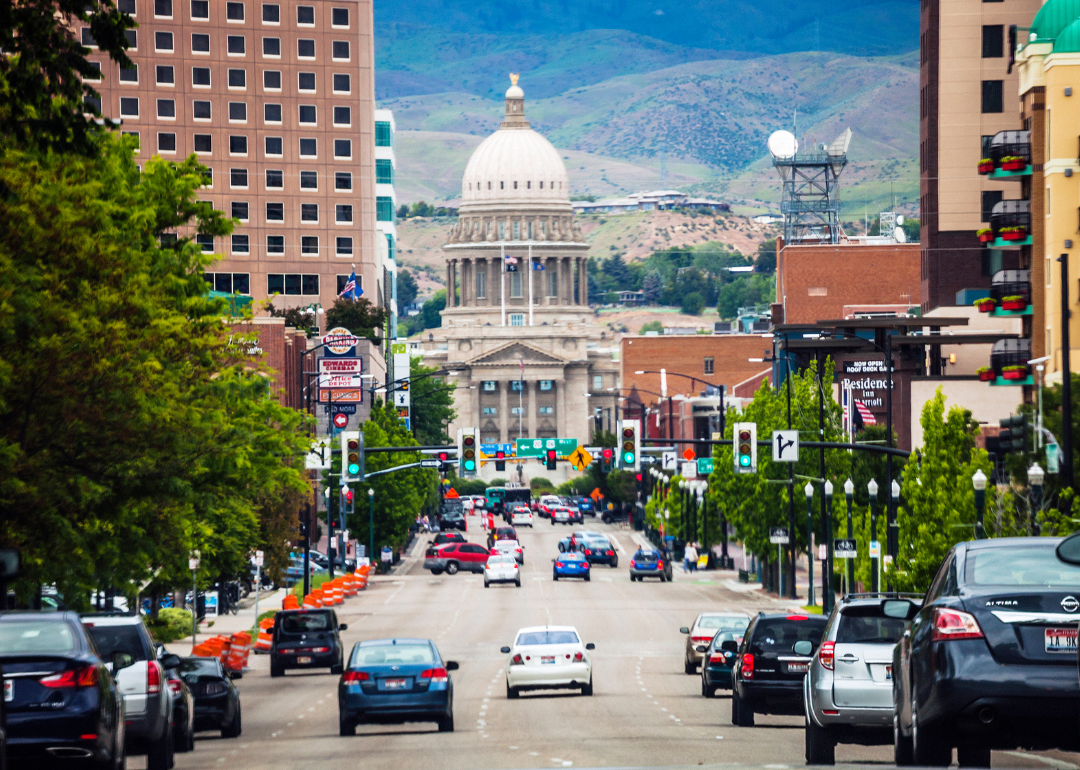
#4. Boise, Idaho
A street-level view of Boise, Idaho.
– Vacancy rate: 4.5%
– Market rent: $1.76 per square foot
– Market sale price: $169 per square foot
– Office space under construction: 481,508 square feet
– Office space inventory: 33,417,644 square feet
Canva
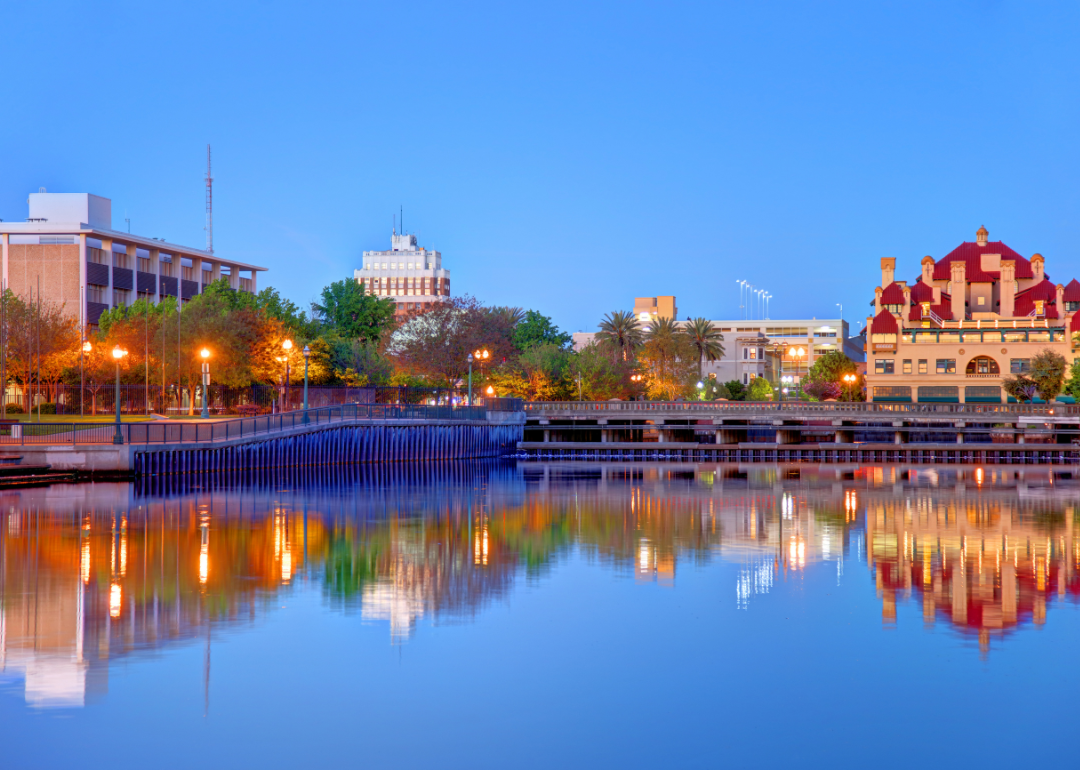
#3. Spartanburg, South Carolina
An aerial view of Spartanburg, South Carolina.
– Vacancy rate: 4.2%
– Market rent: $1.64 per square foot
– Market sale price: $126 per square foot
– Office space under construction: 81,200 square feet
– Office space inventory: 7,631,016 square feet
Alisa_Ch // Shutterstock
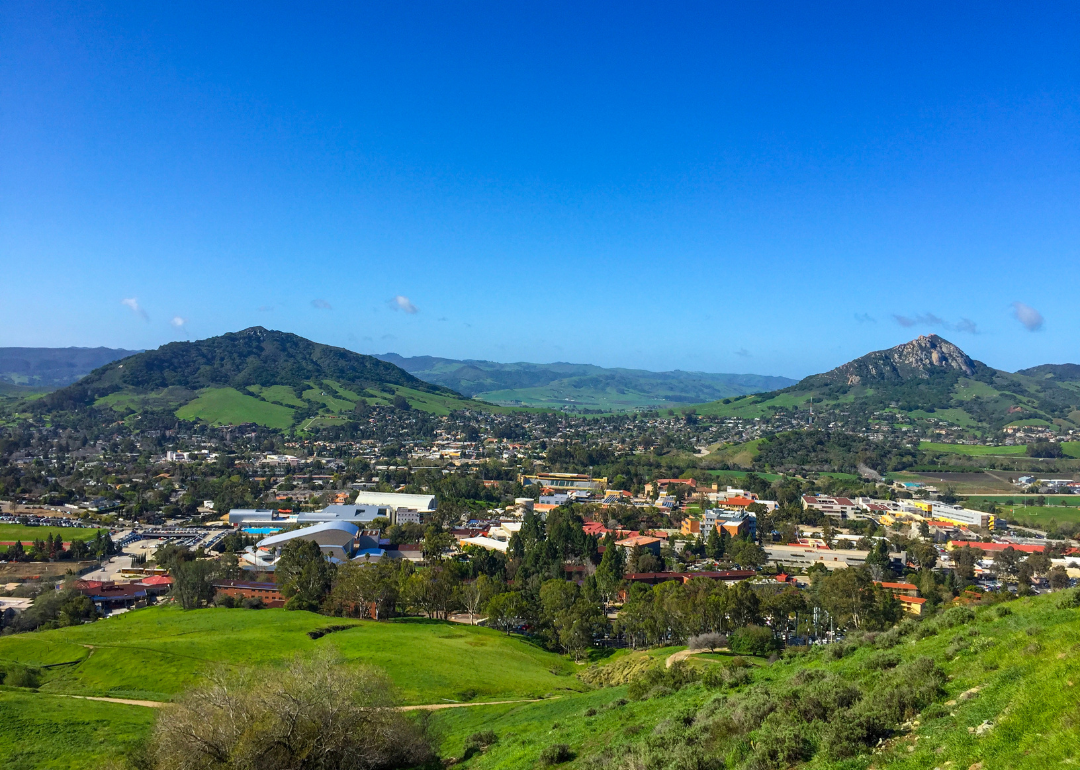
#2. San Luis Obispo, California
San Luis Obispo, as viewd from Cerro San Luis Peak.
– Vacancy rate: 3.0%
– Market rent: $2.33 per square foot
– Market sale price: $277 per square foot
– Office space under construction: 36,039 square feet
– Office space inventory: 6,504,543 square feet
Canva
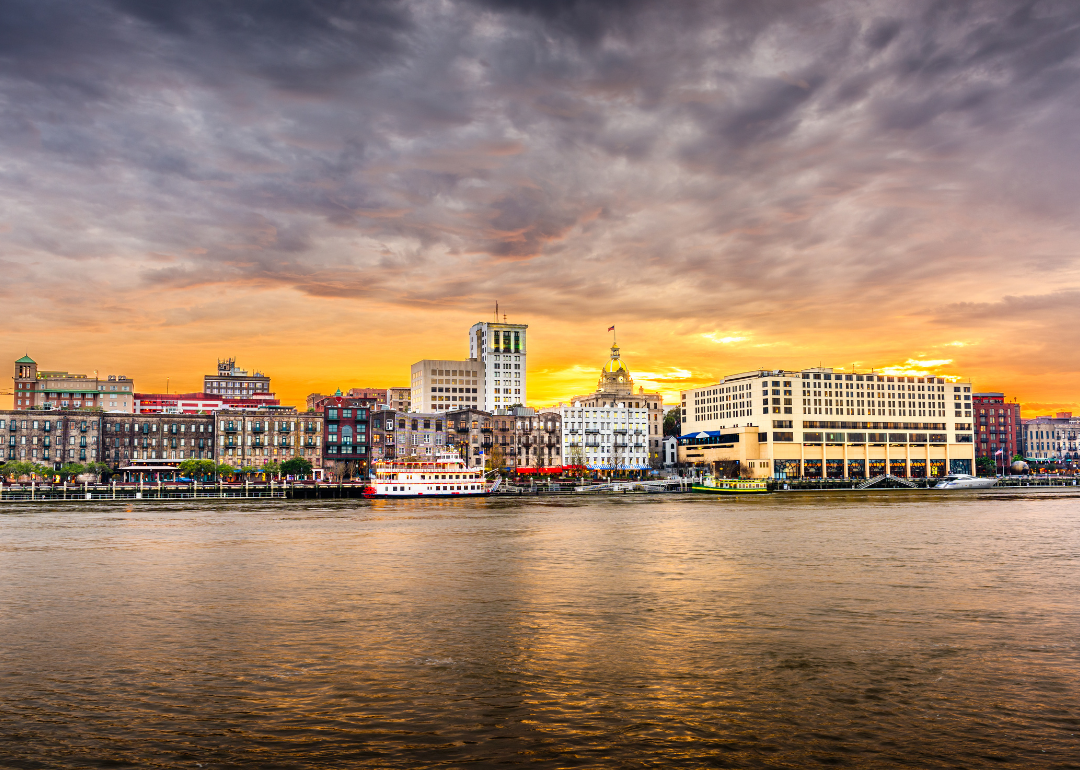
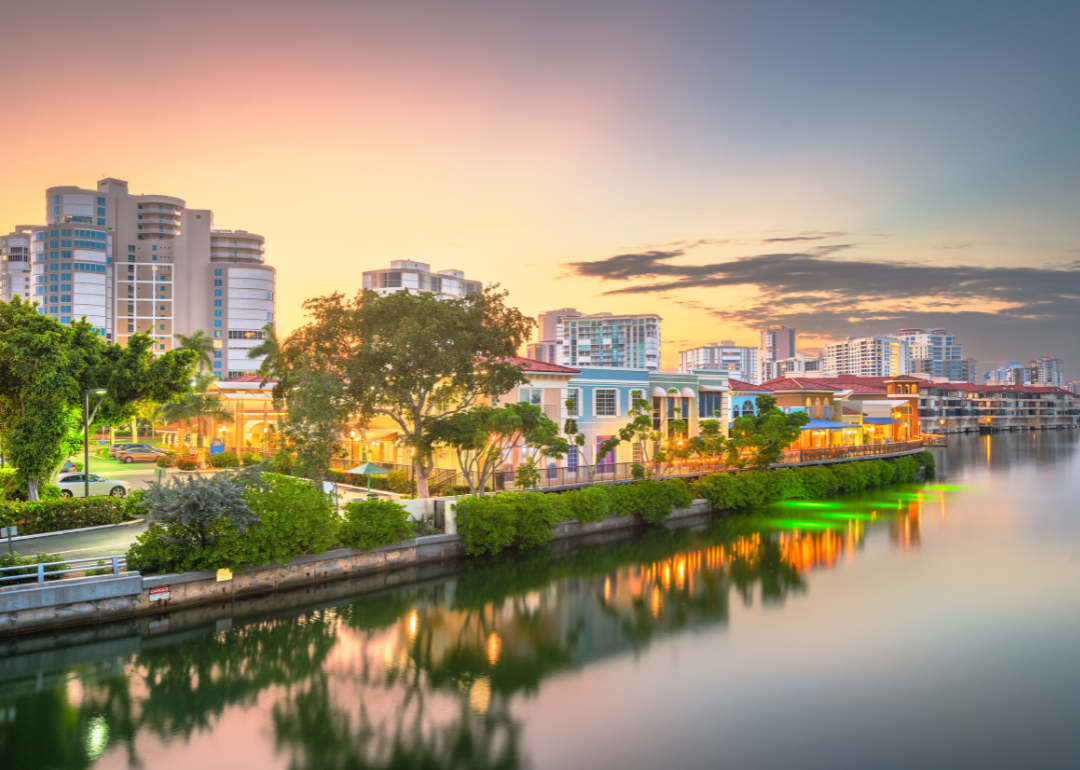
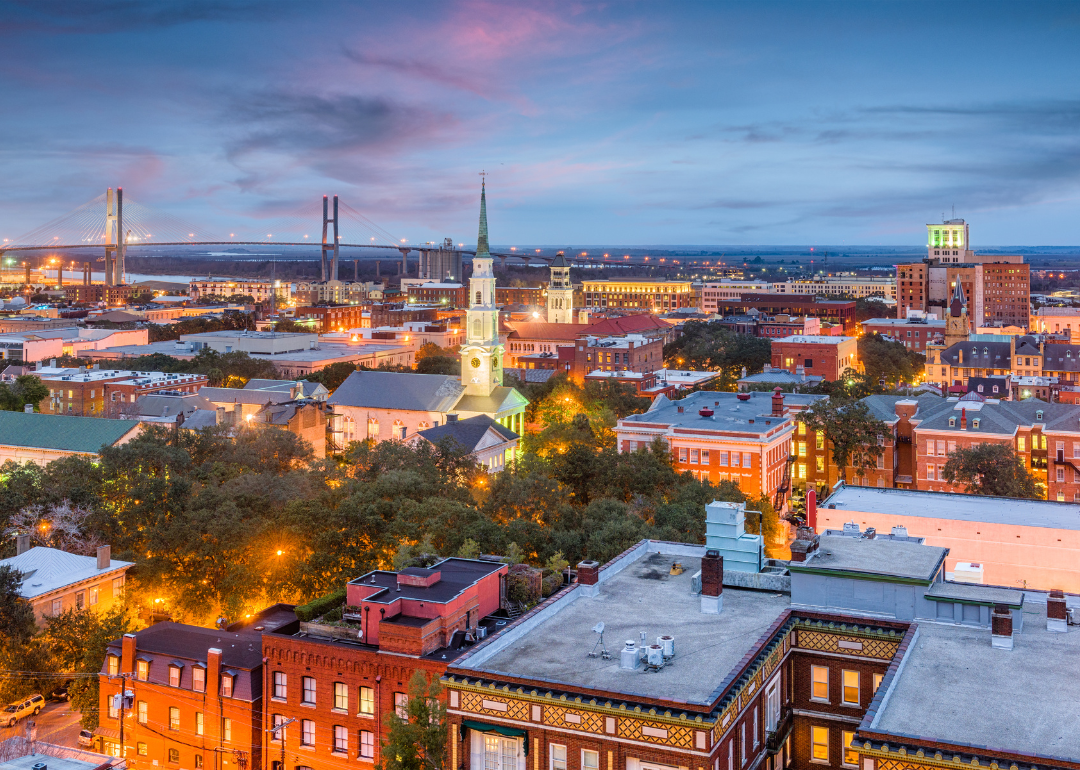
#1. Savannah, Georgia
Savannah, Georgia, as pictured from above.
– Vacancy rate: 2.2%
– Market rent: $1.92 per square foot
– Market sale price: $186 per square foot
– Office space under construction: 57,999 square feet
– Office space inventory: 12,576,939 square feet
This story originally appeared on Swyft Filings and was produced and
distributed in partnership with Stacker Studio.
