Prices are rising fastest in these US metros
Canva
Prices are rising fastest in these US metros
Inflation across the U.S. is finally cooling, but some metros are feeling more relief than others.
Annual inflation hit 3% in June 2023 and has risen slightly since, to about 3.7% in August. That’s still well below the heights of 2022, when prices rose 9% from the prior year. But the latest rate is nearly double the Fed’s ultimate goal of 2% inflation.
The past couple of years saw record inflation in the wake of a tight labor market, gas and energy price increases resulting from the Russia-Ukraine war and production cuts, and the long-lasting COVID-19-spurred supply chain delays.
Areas with rapidly growing populations and heightened demand for housing—like Florida and Phoenix—have maintained inflation rates well above national levels. In these areas, inflation is a far cry from pre-COVID levels and Fed target rates.
Meanwhile, inflation in Urban Alaska has nearly met the Fed target. Food costs actually fell in Alaska, and housing costs saw more moderate increases than the national average. Prices in metros such as Minneapolis, Hawaii, and Washington D.C., also increased less than overall national urban prices. Minneapolis, in particular, attributes its success in lower inflation to residential construction, which has eased housing price pressures.
High inflation has limited people’s spending. And even with recent lower inflation rates, overall prices have remained high, shifting spending habits.
Tier One Outsourcing used Bureau of Labor Statistics data to identify the metropolitan areas where prices inflated the most from the first half of 2022 to the first half of 2023 and compared those rates to overall U.S. urban inflation during that span, which was 4.9%. Inflation is measured as the 12-month change in the consumer price index, which measures price changes of goods across U.S. urban areas. The analysis considered all 23 metros with BLS data available.
![]()

Daniel Case // Shutterstock
#23. Urban Alaska
– Annual inflation, H1 2023: 2.2%
— 2.7 percentage points below the national city average

ostreetphotography // Shutterstock
#22. Minneapolis
– Annual inflation, H1 2023: 3.2%
— 1.7 percentage points below the national city average
Leigh Trail // Shutterstock
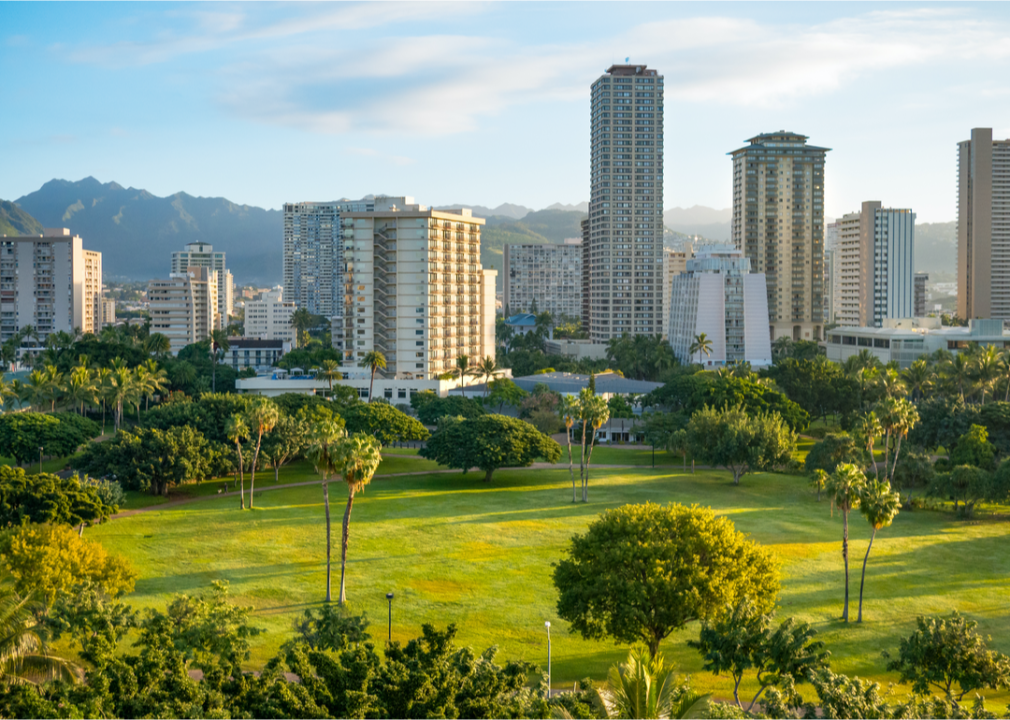
#21. Urban Hawaii
– Annual inflation, H1 2023: 3.4%
— 1.5 percentage points below the national city average

Orhan Cam // Shutterstock
#20. Washington DC
– Annual inflation, H1 2023: 3.5%
— 1.4 percentage points below the national city average
Canva
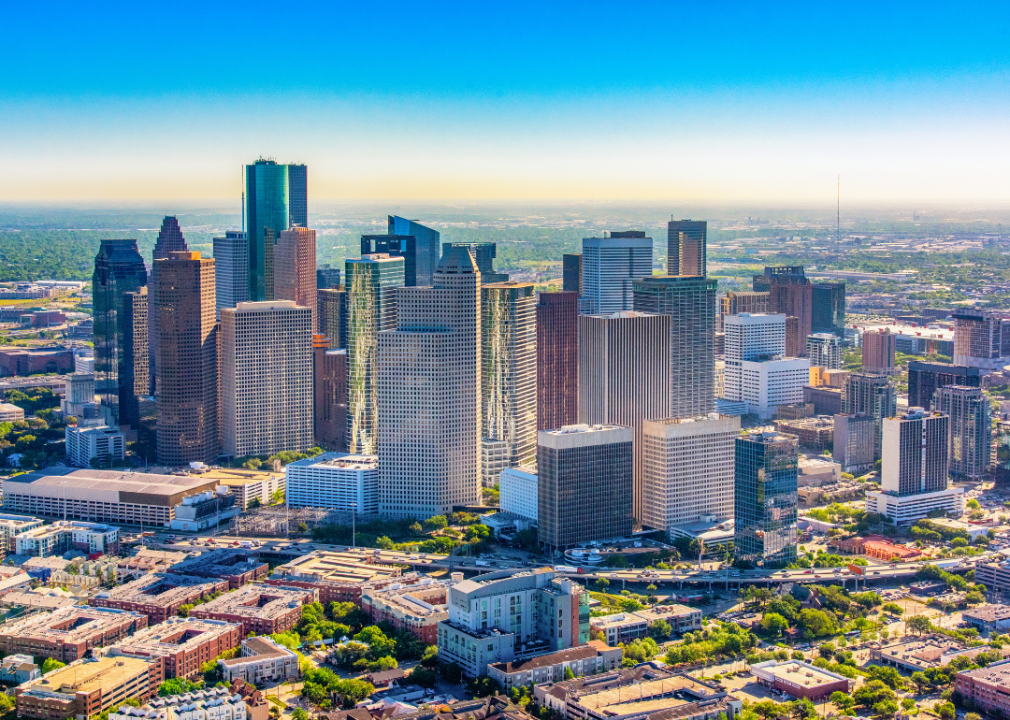
#19. Houston
– Annual inflation, H1 2023: 3.8%
— 1.1 percentage points below the national city average

Strike First // Shutterstock
#18. Los Angeles
– Annual inflation, H1 2023: 4.0%
— 0.9 percentage points below the national city average

marchello74 // Shutterstock
#17. Chicago
– Annual inflation, H1 2023: 4.1%
— 0.8 percentage points below the national city average

Pete Niesen // Shutterstock
#15. San Francisco (tie)
– Annual inflation, H1 2023: 4.4%
— 0.5 percentage points below the national city average

Thiago Leite // Shutterstock
#15. New York (tie)
– Annual inflation, H1 2023: 4.4%
— 0.5 percentage points below the national city average
Joe Hendrickson // Shutterstock
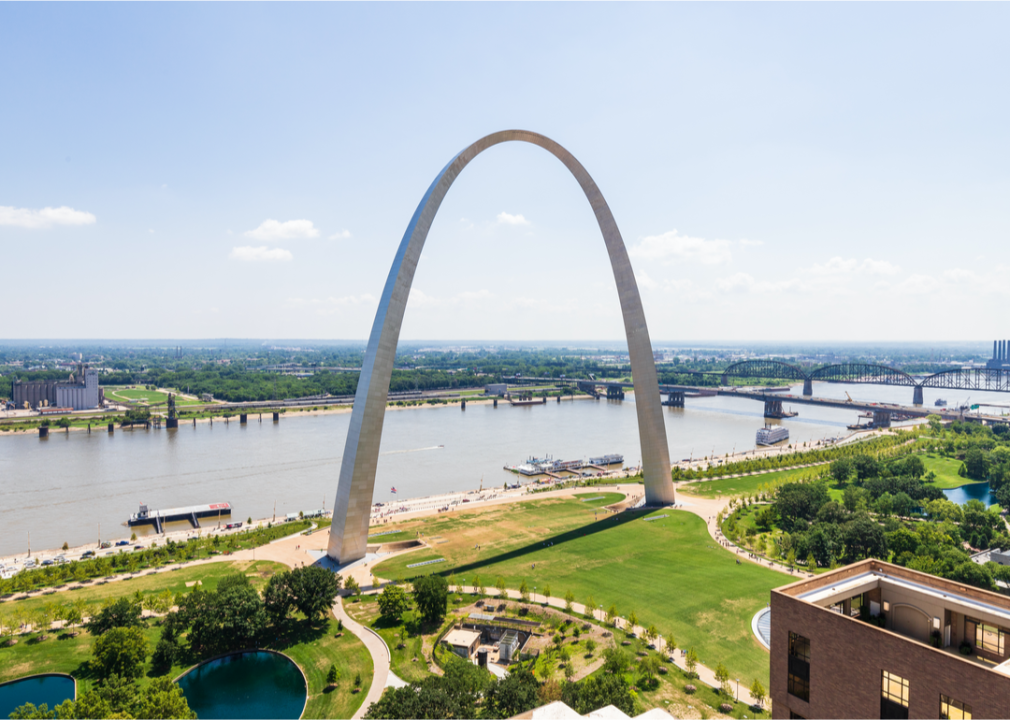
#14. St. Louis
– Annual inflation, H1 2023: 4.6%
— 0.3 percentage points below the national city average
lunamarina // Shutterstock
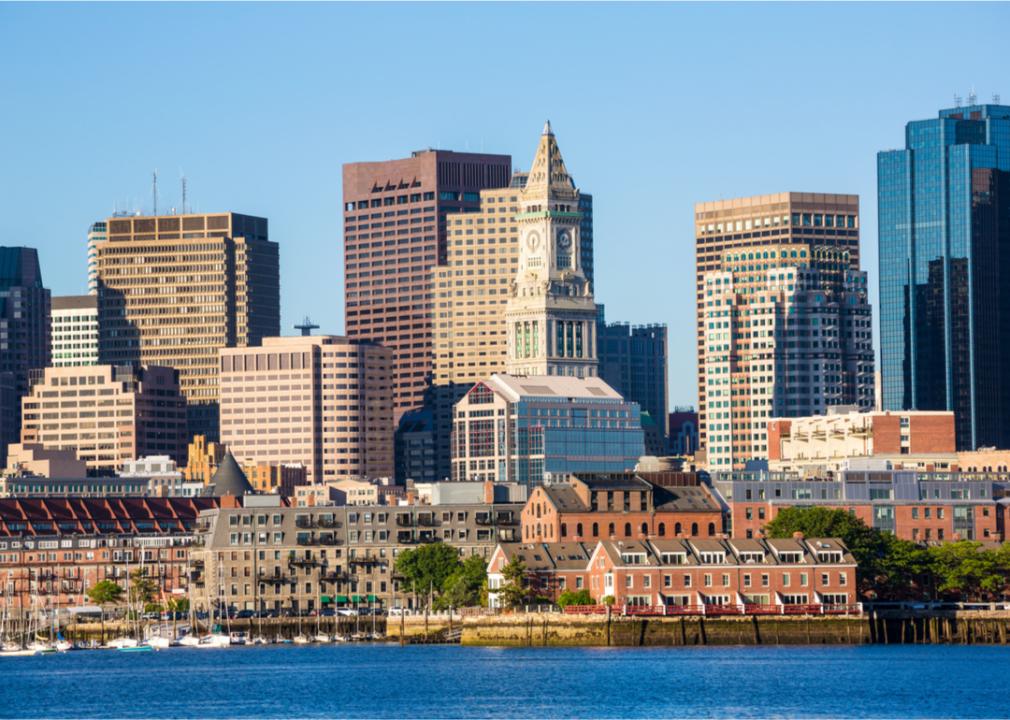
#13. Boston
– Annual inflation, H1 2023: 4.7%
— 0.2 percentage points below the national city average

Canva
#11. Riverside-San Bernardino, CA (tie)
– Annual inflation, H1 2023: 5.0%
— 0.1 percentage points above the national city average

f11photo // Shutterstock
#11. Baltimore (tie)
– Annual inflation, H1 2023: 5.0%
— 0.1 percentage points above the national city average

Andrew J Simcox // Shutterstock
#10. Philadelphia
– Annual inflation, H1 2023: 5.1%
— 0.2 percentage points above the national city average

Dancestrokes // Shutterstock
#9. San Diego
– Annual inflation, H1 2023: 5.5%
— 0.6 percentage points above the national city average

Andrew Zarivny // Shutterstock
#8. Denver
– Annual inflation, H1 2023: 5.6%
— 0.7 percentage points above the national city average

Canva
#7. Dallas
– Annual inflation, H1 2023: 5.7%
— 0.8 percentage points above the national city average

Canva
#6. Atlanta
– Annual inflation, H1 2023: 6.1%
— 1.2 percentage points above the national city average

Vladimir Mucibabic // Shutterstock
#5. Detroit
– Annual inflation, H1 2023: 6.4%
— 1.5 percentage points above the national city average
kan_khampanya // Shutterstock
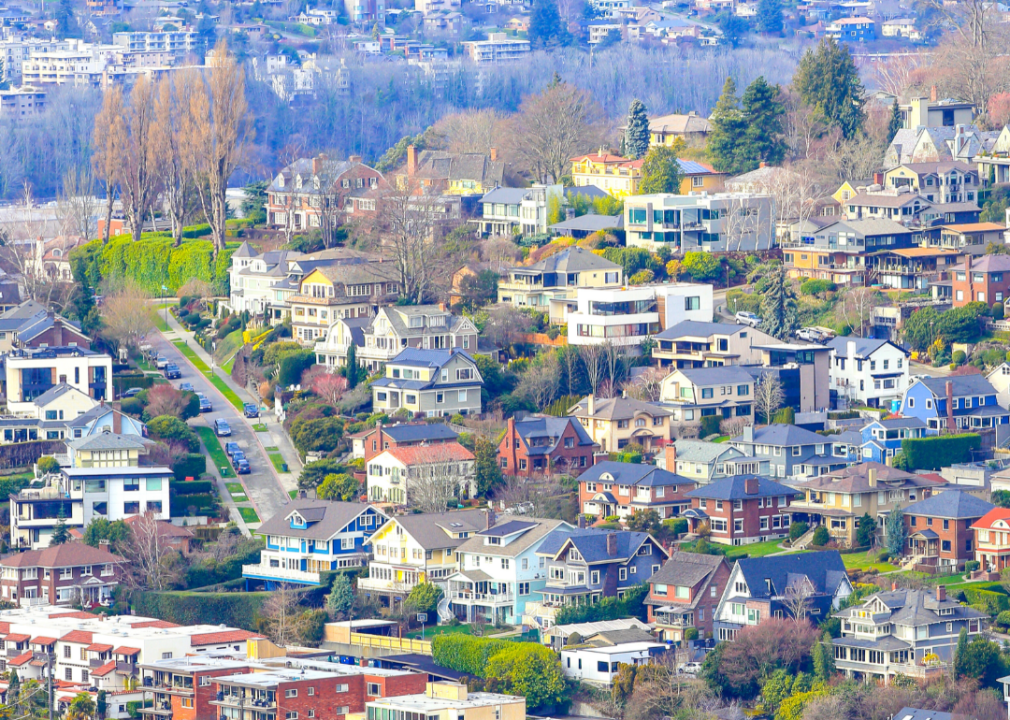
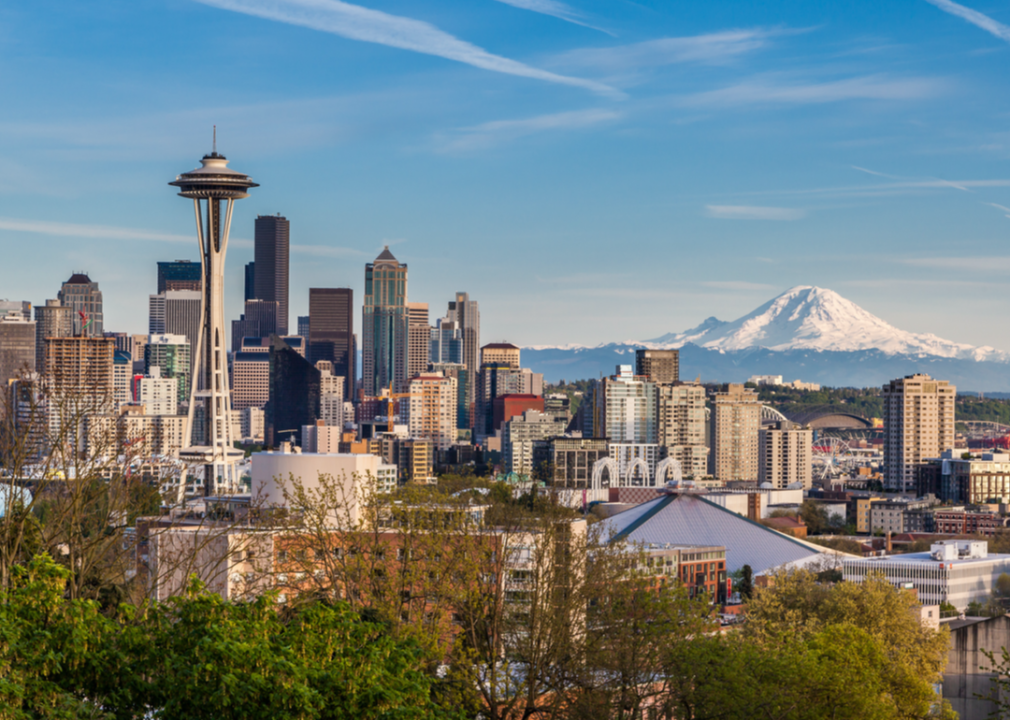
#4. Seattle
– Annual inflation, H1 2023: 6.8%
— 1.9 percentage points above the national city average

Nate Hovee // Shutterstock
#3. Phoenix
– Annual inflation, H1 2023: 7.3%
— 2.4 percentage points above the national city average
AevanStock // Shutterstock
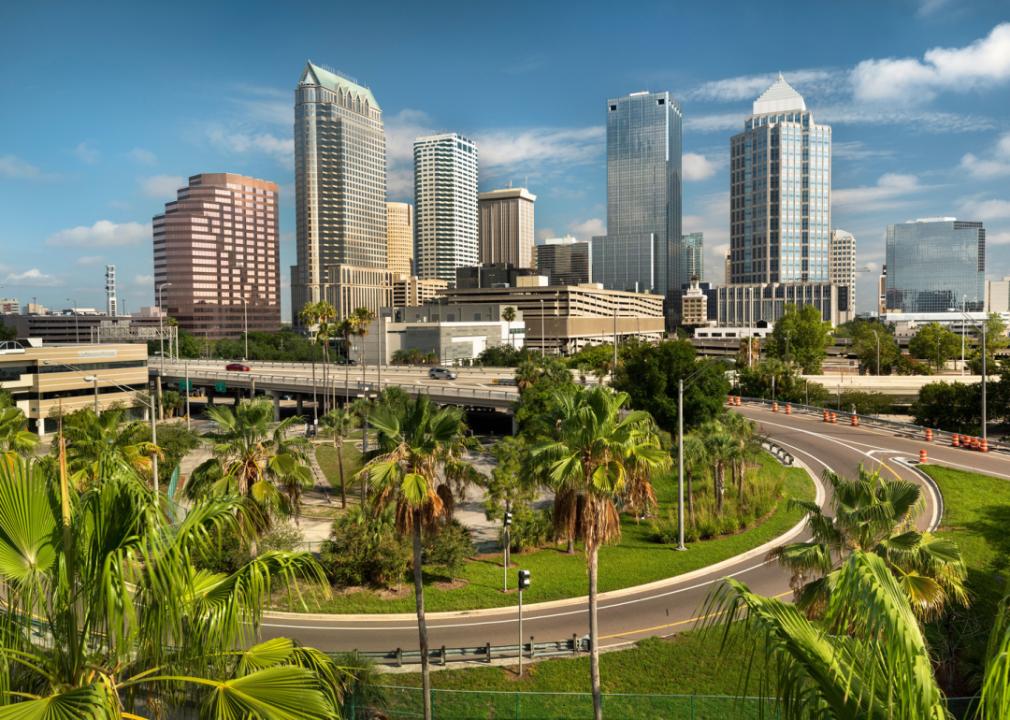
#2. Tampa, FL
– Annual inflation, H1 2023: 7.7%
— 2.8 percentage points above the national city average

Sean Pavone // Shutterstock
#1. Miami
– Annual inflation, H1 2023: 8.5%
— 3.6 percentage points above the national city average
Data reporting by Paxtyn Merten. Story editing by Jeff Inglis. Copy editing by Paris Close.
This story originally appeared on Tier One Outsourcing and was produced and
distributed in partnership with Stacker Studio.
