Where U.S. residents are experiencing the most financial instability

Carlos M. Silva // Shutterstock
Where U.S. residents are experiencing the most financial instability
Sunrise on the Bayou, New Orleans, Louisiana.
Inflation has hurt Americans financially in different ways, with the U.S. Census Bureau reporting that up to 45.8% of some households are having difficulty paying for essentials. In particular, inflation has put some Americans at higher risk for financial instability.
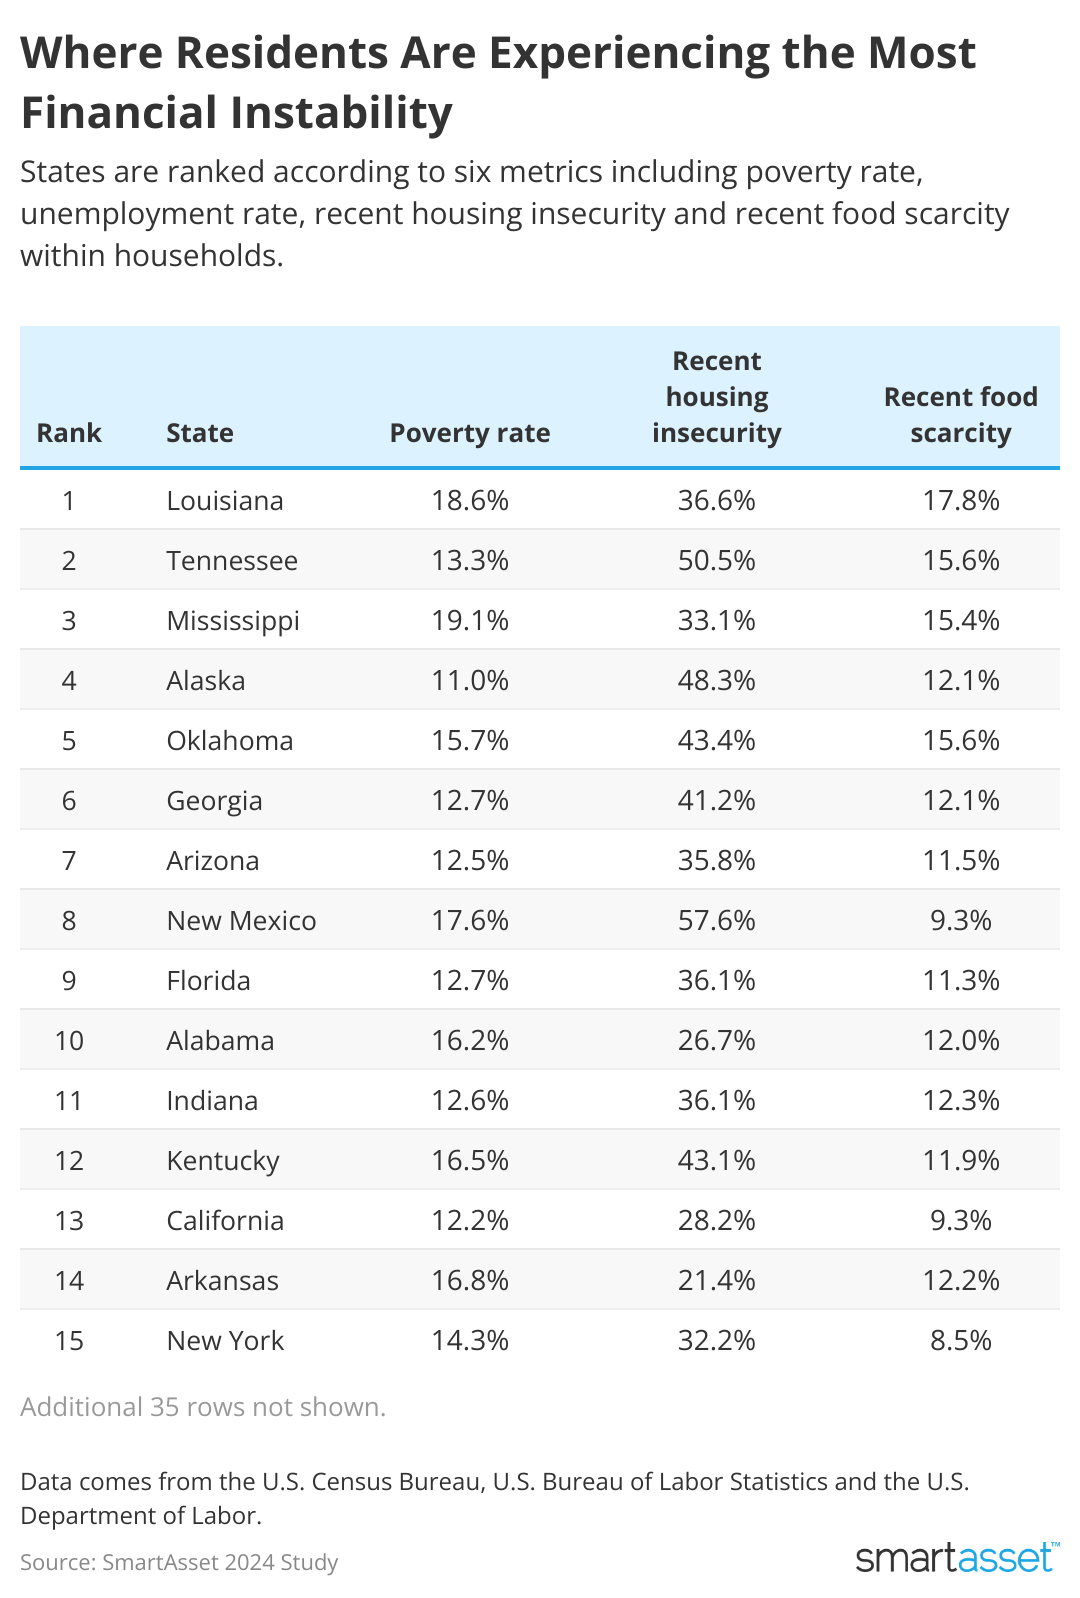
With this in mind, SmartAsset ranked U.S. states according to where residents are struggling most financially. Data measures poverty rates, food insecurity, housing insecurity and elements of unemployment and unemployment benefits.
Key findings
- Louisiana residents hurt the most financially for two consecutive years. The Bayou State residents have the most food insecurity, with 17.8% of the population not having enough food in the house to eat. At 18.6%, they also have the second-highest rate of poverty. Unemployment is also relatively high at 4.2%, and 36.6% of residents are in danger of foreclosure or being evicted.
- Tennessee ranked second for residents hurting financially. This was in large part dueto rampant housing and food insecurity, which were respectively second- and third-worst studywide at 50.5% and 17.8%.
- 19.1% of Mississippi residents are in poverty. Ranking third overall, Mississippi has the highest poverty rate nationwide. The average poverty rate across all states is 12.4%. On the other end of the spectrum, New Hampshire has the lowest poverty rate at 7.2%.
- California has the highest unemployment rate. With the rate the same as it was two years ago, 5.3% of the Golden State’s labor force is unemployed. And the rate at which unemployment benefits make up for residents’ wages is also sixth-lowest at 28.2%.
- New Mexico residents face the most food scarcity. A whopping 57.6% of New Mexicans report not having enough food to eat in the house over the past week, putting the state in eighth place overall.
![]()
SmartAsset
10 places where residents are hurting most financially
Table showing where residents are experiencing the most financial instability.
- Louisiana
- Poverty rate: 18.6%
- Unemployment rate, 2024: 4.2%
- Two-year change in unemployment: -0.1%
- Unemployment benefits replacement rate: 29.9%
- Housing insecurity: 36.6%
- Food scarcity: 17.8%
- Tennessee
- Poverty rate: 13.3%
- Unemployment rate, 2024: 3.3%
- Two-year change in unemployment: -0.1%
- Unemployment benefits replacement rate: 27.2%
- Housing insecurity: 50.5%
- Food scarcity: 15.6%
- Mississippi
- Poverty rate: 19.1%
- Unemployment rate, 2024: 3.1%
- Two-year change in unemployment: -1.4%
- Unemployment benefits replacement rate: 29.9%
- Housing insecurity: 33.1%
- Food scarcity: 15.4%
- Alaska
- Poverty rate: 11.0%
- Unemployment rate, 2024: 4.6%
- Two-year change in unemployment: -0.7%
- Unemployment benefits replacement rate: 26.7%
- Housing insecurity: 48.3%
- Food scarcity: 12.1%
- Oklahoma
- Poverty rate: 15.7%
- Unemployment rate, 2024: 3.6%
- Two-year change in unemployment: 1.0%
- Unemployment benefits replacement rate: 42.6%
- Housing insecurity: 43.4%
- Food scarcity: 15.6%
- Georgia
- Poverty rate: 12.7%
- Unemployment rate, 2024: 3.1%
- Two-year change in unemployment: -0.1%
- Unemployment benefits replacement rate: 29.0%
- Housing insecurity: 41.2%
- Food scarcity: 12.1%
- Arizona
- Poverty rate: 12.5%
- Unemployment rate, 2024: 4.1%
- Two-year change in unemployment: 0.5%
- Unemployment benefits replacement rate: 30.2%
- Housing insecurity: 35.8%
- Food scarcity: 11.5%
- New Mexico
- Poverty rate: 17.6%
- Unemployment rate, 2024: 3.9%
- Two-year change in unemployment: -1.7%
- Unemployment benefits replacement rate: 41.3%
- Housing insecurity: 57.6%
- Food scarcity: 9.3%
- Florida
- Poverty rate: 12.7%
- Unemployment rate, 2024: 3.1%
- Two-year change in unemployment: -0.2%
- Unemployment benefits replacement rate: 26.4%
- Housing insecurity: 36.1%
- Food scarcity: 11.3%
- Alabama
- Poverty rate: 16.2%
- Unemployment rate, 2024: 3.0%
- Two-year change in unemployment: 0.0%
- Unemployment benefits replacement rate: 29.8%
- Housing insecurity: 26.7%
- Food scarcity: 12.0%
10 places where residents are most financially sound
- Hawaii
- Poverty rate: 10.2%
- Unemployment rate, 2024: 3.1%
- Two-year change in unemployment: -1.1%
- Unemployment benefits replacement rate: 49.3%
- Housing insecurity: 22.3%
- Food scarcity: 5.7%
- North Dakota
- Poverty rate: 11.5%
- Unemployment rate, 2024: 2.0%
- Two-year change in unemployment: -0.9%
- Unemployment benefits replacement rate: 48.0%
- Housing insecurity: 16.7%
- Food scarcity: 7.6%
- Maine
- Poverty rate: 10.8%
- Unemployment rate, 2024: 3.4%
- Two-year change in unemployment: -0.6%
- Unemployment benefits replacement rate: 45.9%
- Housing insecurity: 17.2%
- Food scarcity: 7.6%
- Iowa
- Poverty rate: 11.0%
- Unemployment rate, 2024: 3.0%
- Two-year change in unemployment: -0.5%
- Unemployment benefits replacement rate: 45.7%
- Housing insecurity: 19.1%
- Food scarcity: 8.7%
- Vermont
- Poverty rate: 10.4%
- Unemployment rate, 2024: 2.3%
- Two-year change in unemployment: -0.6%
- Unemployment benefits replacement rate: 47.6%
- Housing insecurity: 32.4%
- Food scarcity: 8.1%
- Utah
- Poverty rate: 8.2%
- Unemployment rate, 2024: 2.8%
- Two-year change in unemployment: 0.7%
- Unemployment benefits replacement rate: 43.9%
- Housing insecurity: 14.1%
- Food scarcity: 10.9%
- Massachusetts
- Poverty rate: 10.4%
- Unemployment rate, 2024: 2.9%
- Two-year change in unemployment: -1.8%
- Unemployment benefits replacement rate: 43.3%
- Housing insecurity: 28.9%
- Food scarcity: 8.4%
- Minnesota
- Poverty rate: 9.6%
- Unemployment rate, 2024: 2.7%
- Two-year change in unemployment: 0.0%
- Unemployment benefits replacement rate: 44.5%
- Housing insecurity: 23.7%
- Food scarcity: 9.2%
- Colorado
- Poverty rate: 9.4%
- Unemployment rate, 2024: 3.5%
- Two-year change in unemployment: -0.5%
- Unemployment benefits replacement rate: 42.8%
- Housing insecurity: 21.9%
- Food scarcity: 8.4%
- Delaware
- Poverty rate: 9.4%
- Unemployment rate, 2024: 4.0%
- Two-year change in unemployment: -0.6%
- Unemployment benefits replacement rate: 42.2%
- Housing insecurity: 21.1%
- Food scarcity: 8.2%
Data and Methodology
To find the states where residents are financially hurting most, SmartAsset analyzed six metrics for U.S. states.
- Poverty rate. This is the percentage of residents living below the poverty line. Data comes from the U.S. Census Bureau’s 2022 1-year American Community Survey.
- Unemployment rate. Data is for February 2024 and comes from the Bureau of Labor Statistics’ Local Area Unemployment Statistics.
- Two-year change in unemployment rate. This is the two-year percentage point difference between the February 2024 unemployment rate and February 2022 unemployment rate. Data comes from the Bureau of Labor Statistics’ Local Area Unemployment Statistics.
- Unemployment benefit replacement rate. This is the ratio of the average unemployment benefit received to the average worker’s weekly salary. Data comes from the U.S. Department of Labor and is annual for 2023.
- Percentage of adults experiencing recent housing insecurity. This is the percentage of households not current on rent or mortgage where eviction or foreclosure in the next two months is either very likely or somewhat likely. Data comes from the Census Bureau’s Household Pulse Survey. Respondents were surveyed from March 5, 2024 through April 1, 2024.
- Percentage of adults experiencing recent food insufficiency. This is the percentage of adults in households where there was either sometimes or often not enough to eat in the last seven days. Data comes from the Census Bureau’s Household Pulse Survey. Respondents were surveyed from March 5, 2024 through April 1, 2024.
The following metrics were half-weighted: unemployment rate and two-year change in the unemployment rate.
This story was produced by SmartAsset and reviewed and distributed by Stacker Media.
