Manufacturers in these states spend the most on equipment
JEFF KOWALSKY/AFP // Getty Images
Manufacturers in these states spend the most on equipment
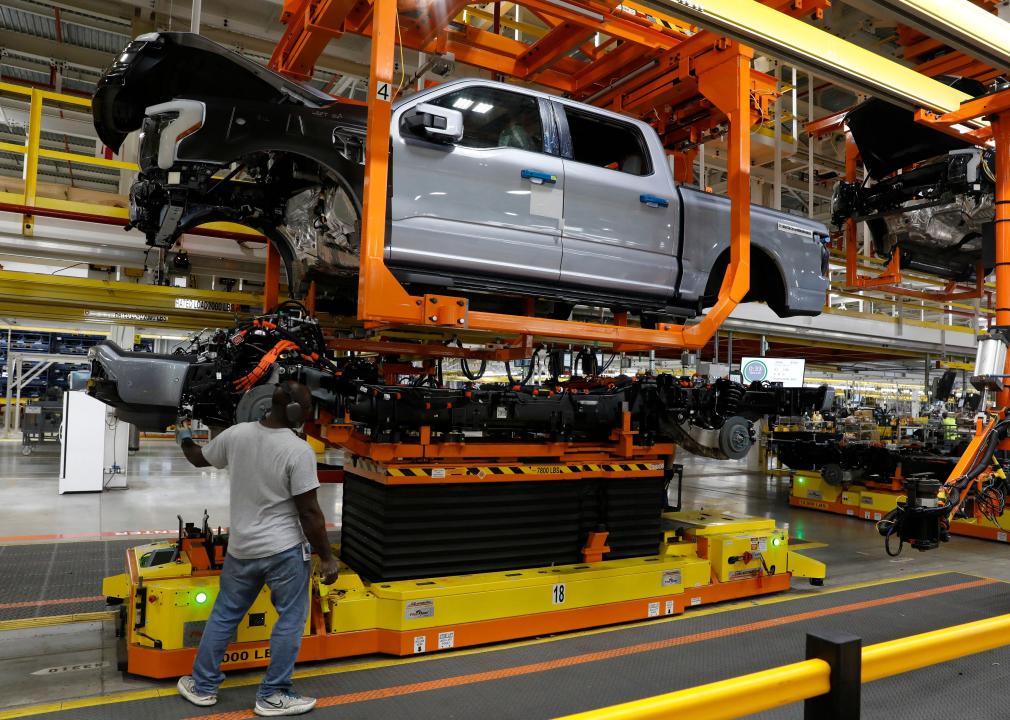
Car manufacturing plant.
Equipment enables manufacturers to create almost every modern product, from the clothes on our backs to the cars we drive.
Acquiring the latest equipment and machinery consumes more than three-quarters of American manufacturers’ annual capital budgets, Census Bureau data shows. U.S. manufacturers spent more than $135 billion on new and used equipment and machinery in 2021, according to the most recent Annual Survey of Manufactures. In all but one state, these expenses comprised more than 60% of manufacturers’ annual capital expenses.
Taking a closer look at regional trends, Machinery Partner ranked the states where manufacturing companies are spending the most on equipment, using 2021 data from the Bureau of Labor Statistics. State rankings are based on the share of manufacturers’ 2021 capital expenditures that went toward equipment and machinery, using actual expenditures as a tiebreaker. Notably, equipment is one of two major capital expenditure categories measured by the Census Bureau. The other is buildings and structures, referring to money spent to create new facilities or renovate and expand existing ones.
The scale of manufacturing within a state, as well as each locale’s most prevalent industries, can impact how much companies must spend on equipment. For instance, aerospace, food, and computer/electronics were the primary manufacturing industries across several top-ranked states in the South, West, and Midwest. Within all three of these industries, automation and artificial intelligence have advanced production in recent years—in many cases requiring equipment upgrades.
These common manufacturing segments are particularly influenced by social, regulatory, and environmental factors, which also influence their tool spending. Heightened safety concerns and evolving carbon emissions regulations call for advancements in inspection, assembly, and other elements of aerospace manufacturing. The effect of climate change on crop growth, wildlife habitats, and livestock health challenges the entire food supply chain. The shift to a hybrid-virtual world, accelerated by the COVID-19 pandemic, has put pressure on manufacturers to get breakthrough technologies into peoples’ hands swiftly and without disruptions.
Acquiring the latest tools helps manufacturers build products efficiently while meeting safety regulations. Read on to see how equipment spending in your state compares across the nation.
![]()

LBill45 // Shutterstock
#51. Wyoming
– Share of capital expenses put toward machinery: 34.7%
– Total machinery/equipment spending, 2021: $146.1 million

Sean Pavone // Shutterstock
#50. Louisiana
– Share of capital expenses put toward machinery: 61.4%
– Total machinery/equipment spending, 2021: $3.3 billion

Charles Knowles // Shutterstock
#49. Idaho
– Share of capital expenses put toward machinery: 64.6%
– Total machinery/equipment spending, 2021: $727.4 million

f11photo // Shutterstock
#48. Washington DC
– Share of capital expenses put toward machinery: 65.7%
– Total machinery/equipment spending, 2021: $2.4 million

Canva
#47. Colorado
– Share of capital expenses put toward machinery: 67.2%
– Total machinery/equipment spending, 2021: $1.0 billion

Sean Pavone // Shutterstock
#46. Connecticut
– Share of capital expenses put toward machinery: 67.8%
– Total machinery/equipment spending, 2021: $1.2 billion

Sean Pavone // Shutterstock
#45. Massachusetts
– Share of capital expenses put toward machinery: 70.3%
– Total machinery/equipment spending, 2021: $2.0 billion

Sean Pavone // Shutterstock
#44. Virginia
– Share of capital expenses put toward machinery: 71.2%
– Total machinery/equipment spending, 2021: $2.4 billion

Sean Pavone // Shutterstock
#43. Utah
– Share of capital expenses put toward machinery: 71.7%
– Total machinery/equipment spending, 2021: $1.4 billion

Wangkun Jia // Shutterstock
#42. New York
– Share of capital expenses put toward machinery: 73.7%
– Total machinery/equipment spending, 2021: $3.0 billion
Mihai_Andritoiu // Shutterstock
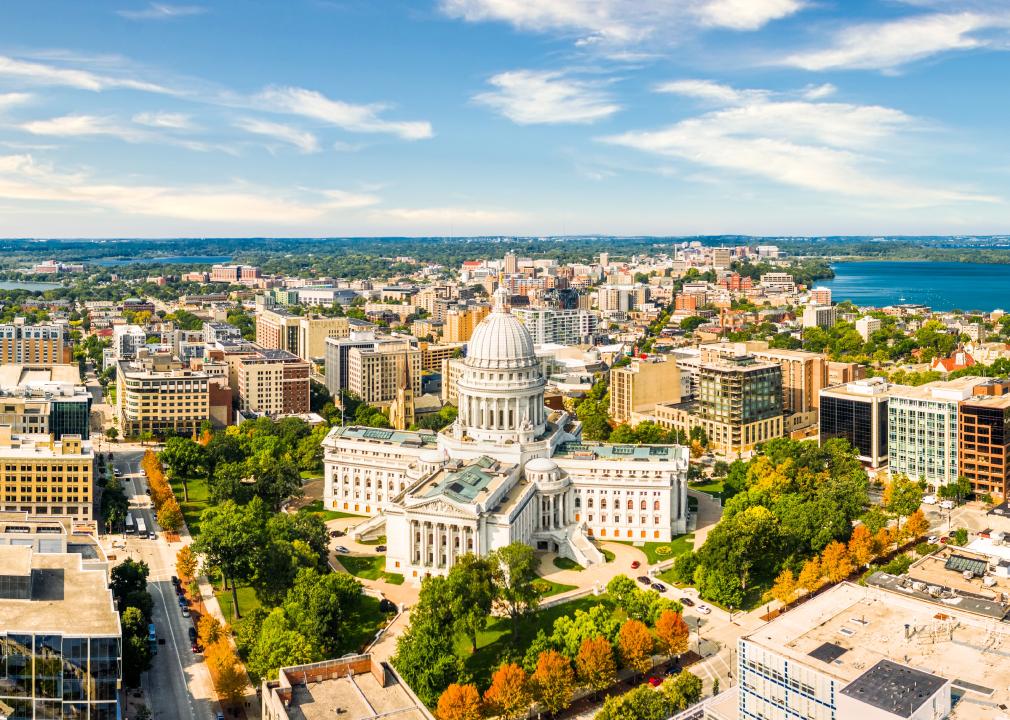
#41. Wisconsin
– Share of capital expenses put toward machinery: 74.1%
– Total machinery/equipment spending, 2021: $4.9 billion

Canva
#40. Minnesota
– Share of capital expenses put toward machinery: 74.3%
– Total machinery/equipment spending, 2021: $3.1 billion

Mihai_Andritoiu // Shutterstock
#39. New Jersey
– Share of capital expenses put toward machinery: 74.6%
– Total machinery/equipment spending, 2021: $2.2 billion

Canva
#38. Hawaii
– Share of capital expenses put toward machinery: 74.8%
– Total machinery/equipment spending, 2021: $53.4 million

Marek Masik // Shutterstock
#37. California
– Share of capital expenses put toward machinery: 75.0%
– Total machinery/equipment spending, 2021: $11.4 billion

Rotorhead 30A Productions // Shutterstock
#36. Kentucky
– Share of capital expenses put toward machinery: 75.1%
– Total machinery/equipment spending, 2021: $3.5 billion

Sean Pavone // Shutterstock
#35. New Hampshire
– Share of capital expenses put toward machinery: 76.3%
– Total machinery/equipment spending, 2021: $536.4 million
Jacob Boomsma // Shutterstock
#34. Kansas
– Share of capital expenses put toward machinery: 76.7%
– Total machinery/equipment spending, 2021: $1.8 billion

Albert Pego // Shutterstock
#33. Vermont
– Share of capital expenses put toward machinery: 76.8%
– Total machinery/equipment spending, 2021: $178.7 million

Sean Pavone // Shutterstock
#32. Indiana
– Share of capital expenses put toward machinery: 77.3%
– Total machinery/equipment spending, 2021: $5.3 billion

Kevin Ruck // Shutterstock
#31. Tennessee
– Share of capital expenses put toward machinery: 77.4%
– Total machinery/equipment spending, 2021: $4.9 billion

Mia2you // Shutterstock
#30. Florida
– Share of capital expenses put toward machinery: 77.6%
– Total machinery/equipment spending, 2021: $2.8 billion

Joseph Sohm // Shutterstock
#29. Maine
– Share of capital expenses put toward machinery: 78.0%
– Total machinery/equipment spending, 2021: $425.3 million

Sharkshock // Shutterstock
#28. North Carolina
– Share of capital expenses put toward machinery: 78.0%
– Total machinery/equipment spending, 2021: $5.2 billion

JohnDSmith // Shutterstock
#27. South Dakota
– Share of capital expenses put toward machinery: 78.7%
– Total machinery/equipment spending, 2021: $424.2 million

George Wirt // Shutterstock
#26. Rhode Island
– Share of capital expenses put toward machinery: 78.9%
– Total machinery/equipment spending, 2021: $337.6 million

Sean Pavone // Shutterstock
#25. Texas
– Share of capital expenses put toward machinery: 79.3%
– Total machinery/equipment spending, 2021: $13.7 billion

randy andy // Shutterstock
#24. Nevada
– Share of capital expenses put toward machinery: 79.9%
– Total machinery/equipment spending, 2021: $386.5 million

Real Window Creative // Shutterstock
#23. Delaware
– Share of capital expenses put toward machinery: 79.9%
– Total machinery/equipment spending, 2021: $424.2 million

Sean Pavone // Shutterstock
#22. Maryland
– Share of capital expenses put toward machinery: 79.9%
– Total machinery/equipment spending, 2021: $1.0 billion

Mihai_Andritoiu // Shutterstock
#21. Montana
– Share of capital expenses put toward machinery: 80.1%
– Total machinery/equipment spending, 2021: $314.9 million

Sean Pavone // Shutterstock
#20. West Virginia
– Share of capital expenses put toward machinery: 80.3%
– Total machinery/equipment spending, 2021: $631.7 million
Sean Pavone // Shutterstock
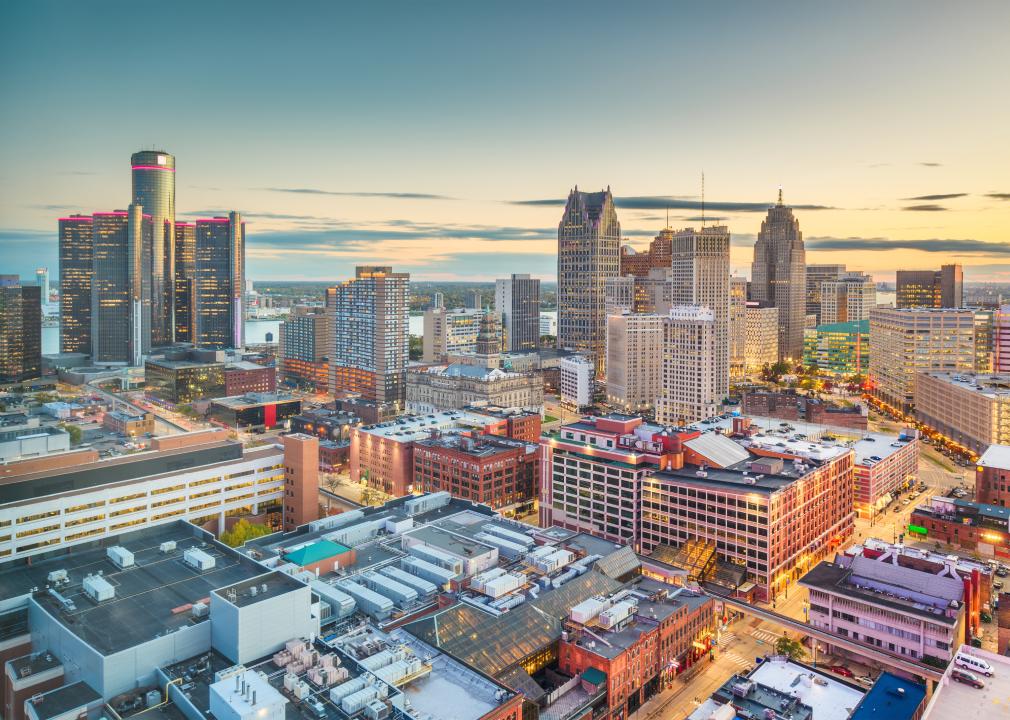
#19. Michigan
– Share of capital expenses put toward machinery: 80.6%
– Total machinery/equipment spending, 2021: $5.7 billion
Kevin Ruck // Shutterstock
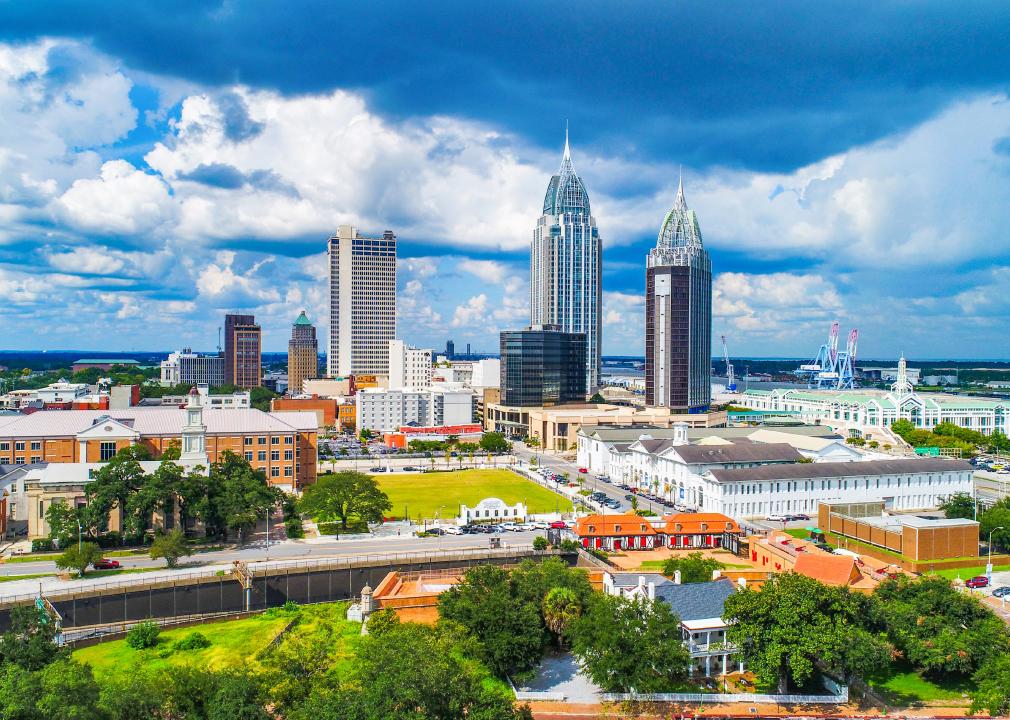
#18. Alabama
– Share of capital expenses put toward machinery: 80.8%
– Total machinery/equipment spending, 2021: $4.6 billion
Katherine Welles // Shutterstock
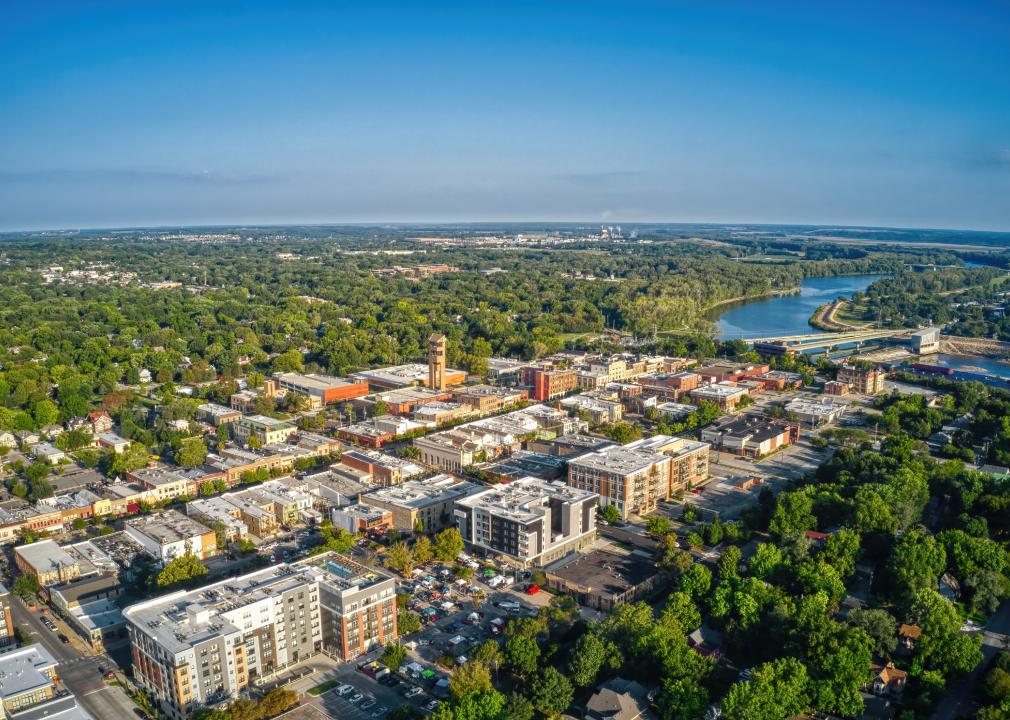
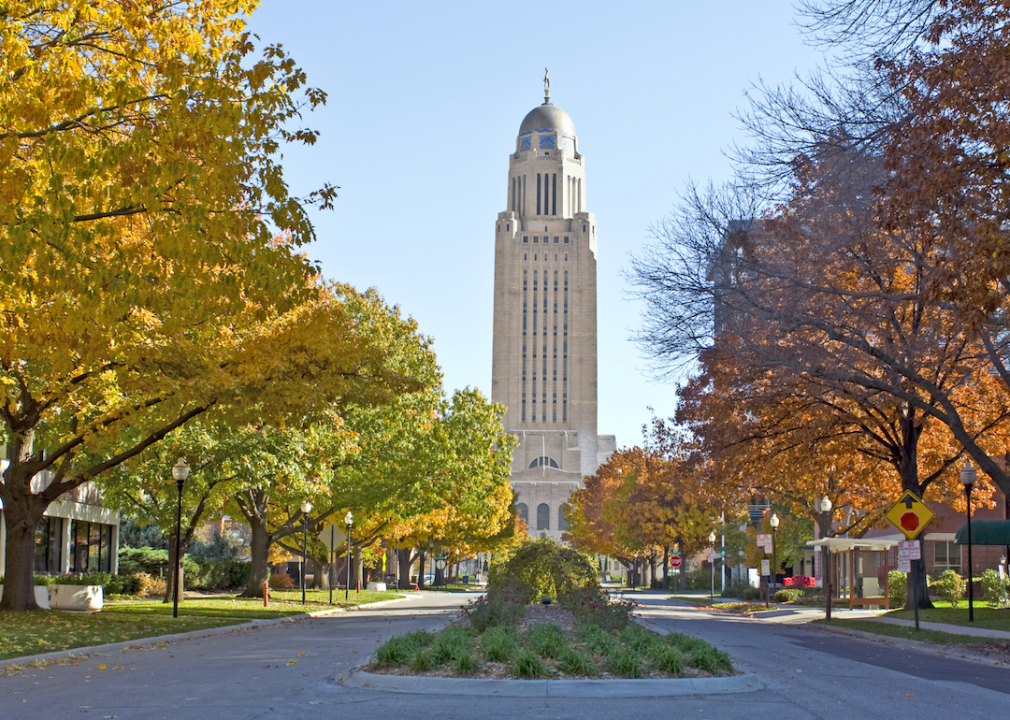
#17. Nebraska
– Share of capital expenses put toward machinery: 81.2%
– Total machinery/equipment spending, 2021: $1.1 billion

Agnieszka Gaul // Shutterstock
#16. Washington
– Share of capital expenses put toward machinery: 81.3%
– Total machinery/equipment spending, 2021: $2.2 billion
Jacob Boomsma // Shutterstock
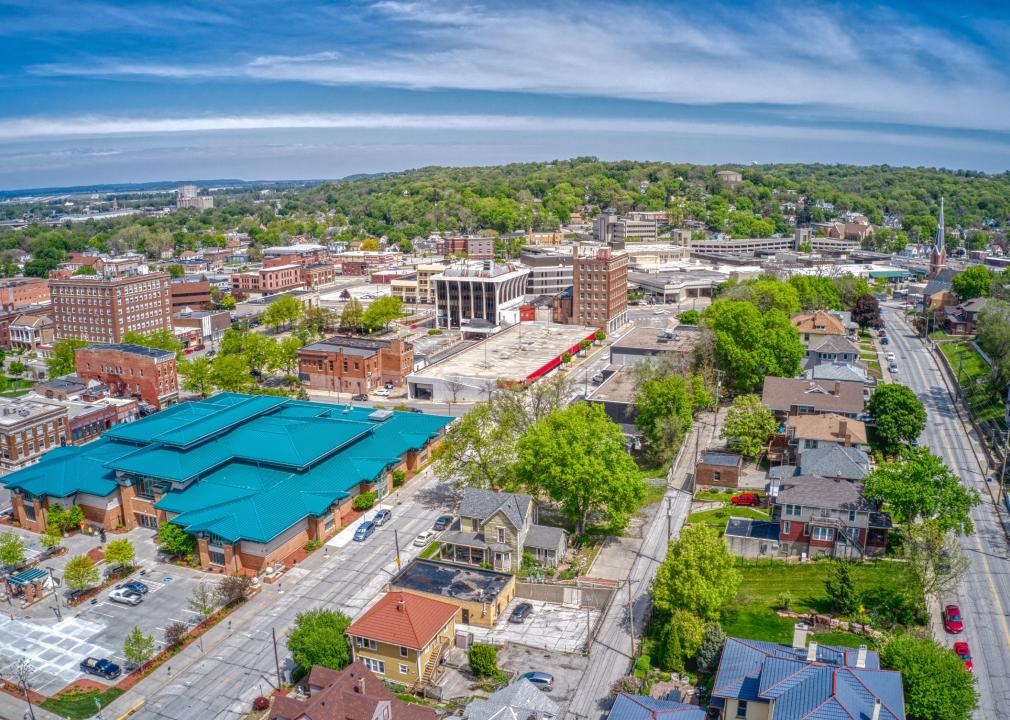
#15. Iowa
– Share of capital expenses put toward machinery: 81.3%
– Total machinery/equipment spending, 2021: $3.4 billion

Canva
#14. Georgia
– Share of capital expenses put toward machinery: 81.3%
– Total machinery/equipment spending, 2021: $4.3 billion
TommyBrison // Shutterstock
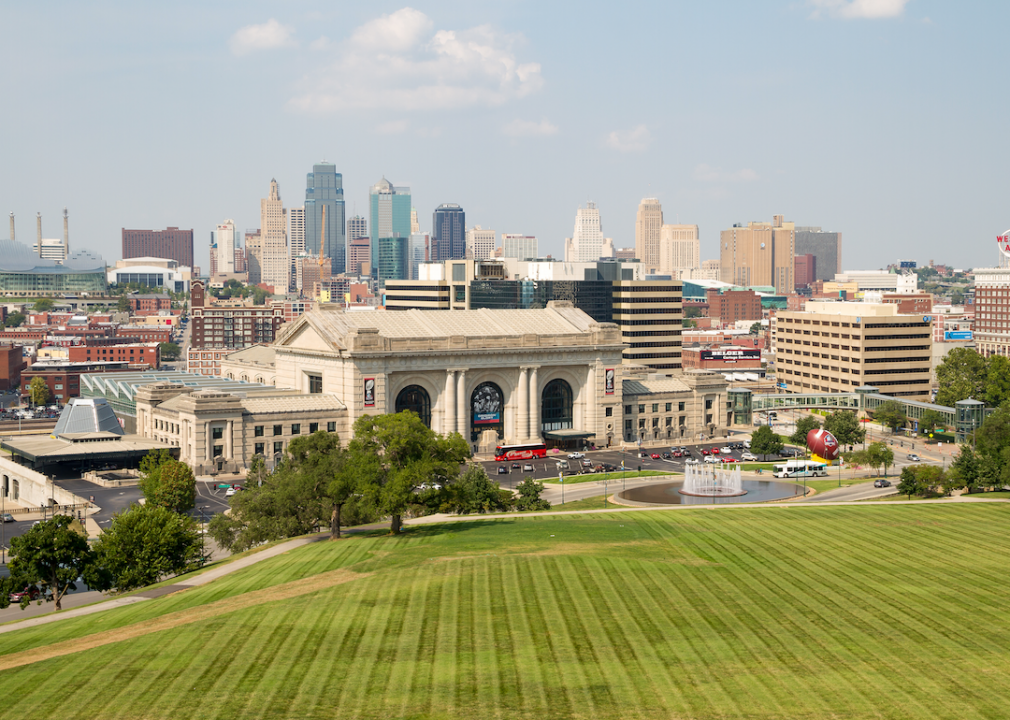
#13. Missouri
– Share of capital expenses put toward machinery: 81.5%
– Total machinery/equipment spending, 2021: $2.4 billion

Sean Pavone // Shutterstock
#12. New Mexico
– Share of capital expenses put toward machinery: 81.8%
– Total machinery/equipment spending, 2021: $488.8 million

ESB Professional // Shutterstock
#11. Pennsylvania
– Share of capital expenses put toward machinery: 81.9%
– Total machinery/equipment spending, 2021: $5.1 billion
Canva
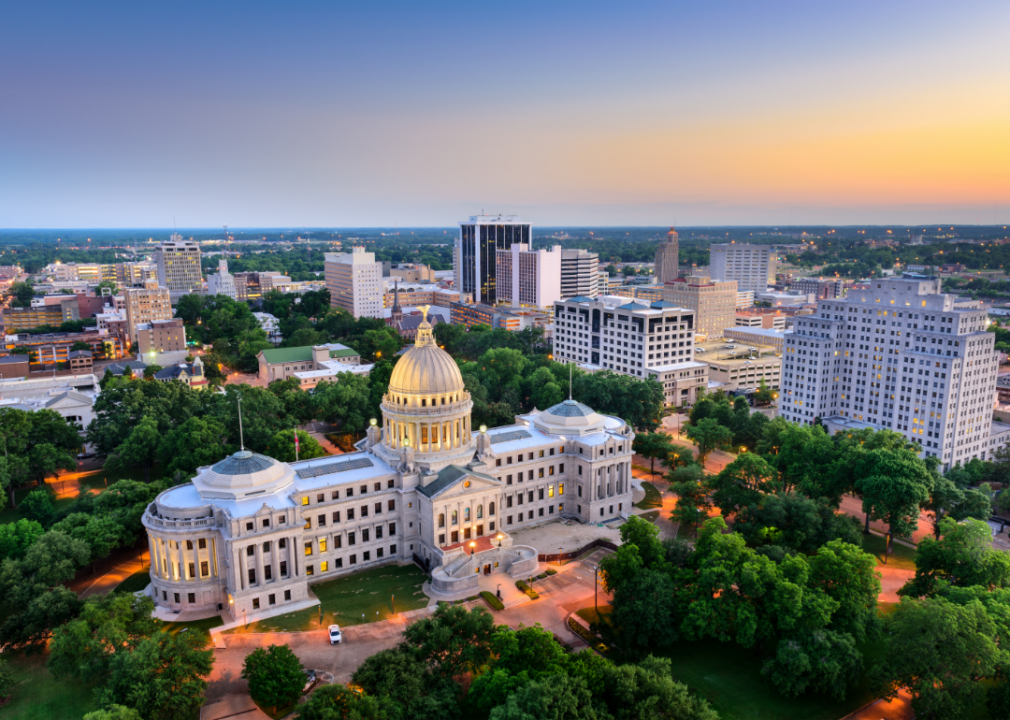
#10. Mississippi
– Share of capital expenses put toward machinery: 82.8%
– Total machinery/equipment spending, 2021: $1.6 billion

f11photo // Shutterstock
#9. South Carolina
– Share of capital expenses put toward machinery: 83.0%
– Total machinery/equipment spending, 2021: $2.8 billion

Canva
#8. Ohio
– Share of capital expenses put toward machinery: 83.0%
– Total machinery/equipment spending, 2021: $8.1 billion

Sean Pavone // Shutterstock
#7. Illinois
– Share of capital expenses put toward machinery: 83.2%
– Total machinery/equipment spending, 2021: $6.6 billion

Canva
#6. Arkansas
– Share of capital expenses put toward machinery: 83.9%
– Total machinery/equipment spending, 2021: $2.0 billion

Sean Pavone // Shutterstock
#5. Oregon
– Share of capital expenses put toward machinery: 83.9%
– Total machinery/equipment spending, 2021: $2.1 billion

Sean Pavone // Shutterstock
#4. Arizona
– Share of capital expenses put toward machinery: 84.2%
– Total machinery/equipment spending, 2021: $1.9 billion
Jacob Boomsma // Shutterstock
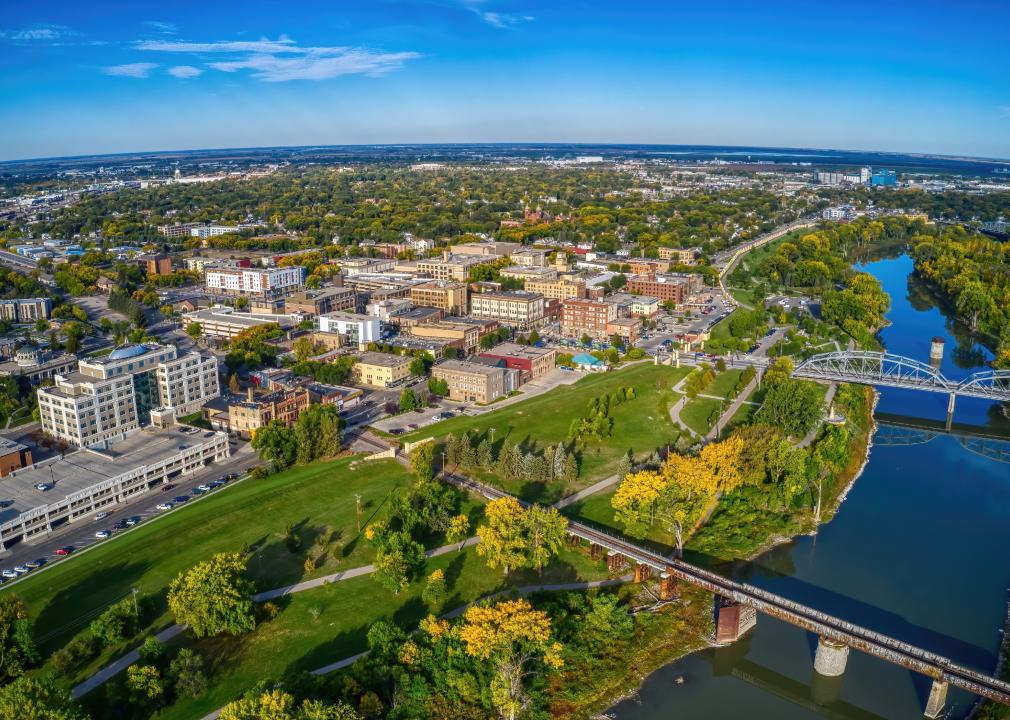
#3. North Dakota
– Share of capital expenses put toward machinery: 84.5%
– Total machinery/equipment spending, 2021: $258.0 million

Sean Pavone // Shutterstock
#2. Oklahoma
– Share of capital expenses put toward machinery: 84.8%
– Total machinery/equipment spending, 2021: $1.6 billion

Canva
#1. Alaska
– Share of capital expenses put toward machinery: 89.9%
– Total machinery/equipment spending, 2021: $415.4 million
This story originally appeared on Machinery Partner and was produced and
distributed in partnership with Stacker Studio.
