San Diego is the happiest city in America (but LA is one of the unhappiest)—see where other cities rank

vaalaa // Shutterstock
San Diego is the happiest city in America (but LA is one of the unhappiest)—see where other cities rank
Downtown street view of San Diego city, California.
Who says you can’t quantify happiness? It turns out that some cities in America are statistically happier than others, according to a 2024 study conducted by Hims.
Asked to rate their happiness on a 1 to 5 scale, San Diego residents topped Hims’ happiness index with 82% reporting a 4 (happy describes me) or a 5 (happy very much describes me), as compared to just 65.5% of the country overall. Rounding out the top three spots were New Orleans, LA (79%) and Albuquerque, NM (78%). What’s their secret to happiness?
At first glance, warm weather seems to be the common thread. However, considering the next three spots on the list go to Minneapolis, MN Omaha, NE, and Seattle, WA—cities not exactly known for their nice weather—clearly it wasn’t that simple (see the full ranking of the happiest cities in America below).
Add to that the fact that Los Angeles, CA was among the least happy cities (5th to last with 55% happy or very happy) and Tampa, FL bottomed out the list (only 50% are happy or very happy).
So what’s the secret sauce to a happy life? Hims explored factors such as household income, average age, daily commute, relationship status, and even pet ownership to see which ones, if any, correlated with happiness. Does having a dog make you happier? Statistically speaking, not really, although many pet owners may disagree.
While certainly there are many ways to be happy, here are a few areas that seem to tip the happiness scale in the positive direction.
![]()
Hims
The Secret to Happiness May Be a Three-Letter Word: Sex
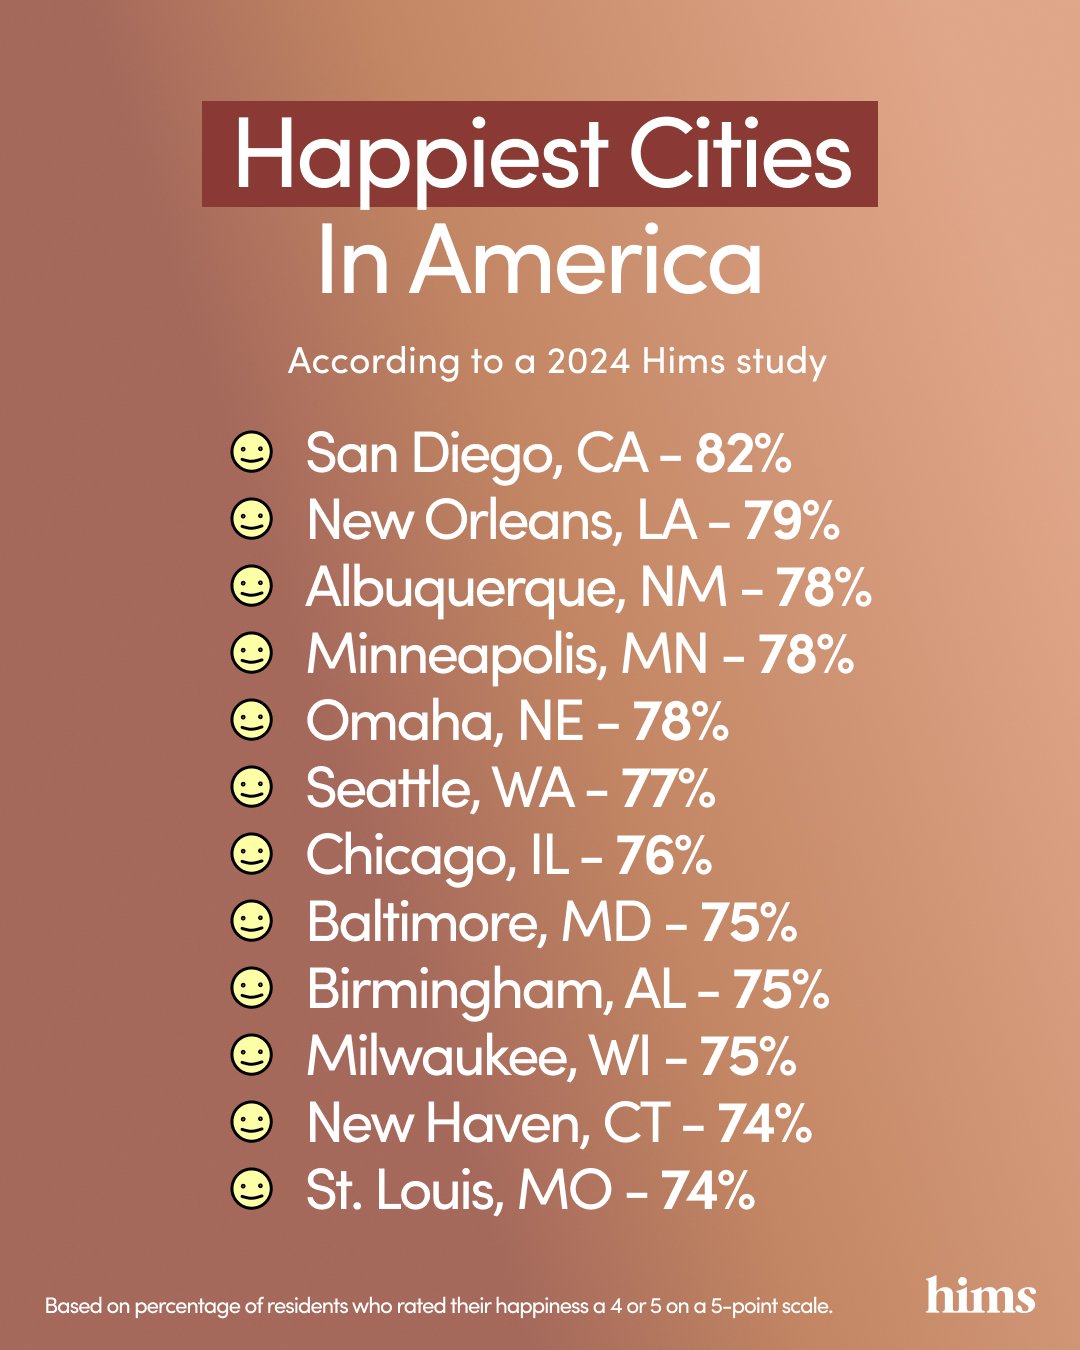
Image by Hims listing the top 10 happiest cities in America.
Just in time for Sexual Health Awareness Month, it turns out that residents’ sex lives were the clearest indicator of their happiness. More specifically, communication around sex is key. Seven out of the 10 happiest cities in the U.S. also ranked in the top 10 for sexual communication (a 4 or 5 on a 5-point scale).
A good libido also may play a role: Six out of the top 10 happiest cities gave their sexual libido top marks.
Tip: Create a sexual bucket list. Make a list of new experiences you want to try to spice up your sex life. This could include different types of intimate activities or settings. Regularly update and review the list to keep your sex life adventurous and fulfilling.
Tip: Take care of your sexual health. If conditions like erectile dysfunction or premature ejaculation are affecting your sex life, there are treatment options available to help you get back to better sex.
Job Satisfaction and Life Satisfaction
Whether you live to work or work to live, our satisfaction with what we do for work positively impacts how happy we are overall. Five out of 10 of the happiest cities also landed on the top 10 list of job satisfaction: San Diego, CA, New Orleans, LA, Albuquerque, NM, Omaha, NE, and Birmingham all made both lists with each city reporting 85% or more job satisfaction (a 4 or 5 on a 5-point scale) and 75% or more on happiness (also a 4 or 5 on a 5-point scale).
San Diego, CA, the happiest city, also tops the list of residents most satisfied with their job: 90% report high job satisfaction.
Furthermore, 10 of the bottom 15 cities for happiness were also within the bottom 15 for job satisfaction. The least happy cities overall as well as with their jobs include Portland, OR (last in job satisfaction and 4th to last in happiness), Tampa, FL (second to last in job satisfaction and last in happiness), Cleveland, OH, Washington, DC, Las Vegas, NV, Orlando, FL, Charlotte, NC, Los Angeles, CA, and Denver, CO.
Tip: Find a job you love. While living to work can cause burnout, loving where we work can have an impact on happiness. Many people spend half or more of their waking hours each day at work, so it makes sense that how happy we feel during that time will impact how happy we feel overall. Research has also found that happier employees are more productive.
Good Hair Makes For Good Moods
While having good hair may not feel as significant in shaping happiness as a great career, it turns out the simple things in life, like a good hair day, may make a difference. Baltimore, MD, San Diego, CA, Albuquerque, NM, Omaha, NE, Seattle, WA, and Birmingham, AL were the cities to say they’ve seen the most improvement in their hair over the past few years—and they’re also six of the top 10 happiest cities.
Just like job satisfaction, 10 out of 15 cities reporting they were the least happy with their hair over the past three years also reported being the least happy in general. These cities included Denver, CO (least happy with their hair and 11th least happy city overall), Indianapolis, IN (3rd least happy with their hair and 8th least happy overall), Detroit, MI, Orlando, FL, Cleveland, OH, Las Vegas, NV, Portland, OR, Tampa, FL, Los Angeles, CA, and Charlotte, NC.
Tip: Take care of your locks. Good hair care can uplift your mood—88% of Gen Z men and 84% of Millennial men reported that a good hair day improves their mood. Try a sulfate-free shampoo or a shampoo with ketoconazole and maybe consider a hair growth product if you’re experiencing hair loss. Hair care is self-care.
Happiest Cities In America
Happiest cities in America based on percentage of residents who rated their happiness a 4 or 5 on a 5-point scale
- San Diego, CA – 82%
- New Orleans, LA – 79%
- Albuquerque, NM – 78%
- Minneapolis, MN – 78%
- Omaha, NE – 78%
- Seattle, WA – 77%
- Chicago, IL – 76%
- Baltimore, MD – 75%
- Birmingham, AL – 75%
- Milwaukee, WI – 75%
- New Haven, CT – 74%
- St. Louis, MO – 74%
- Honolulu, HI – 73%
- Kansas City, KS – 70%
- Des Moines, IA – 70%
- New York, NY – 69%
- Philadelphia, PA – 69%
- Little Rock, AR – 69%
- Phoenix, AZ – 69%
- Houston, TX – 68%
- Memphis, TN – 68%
- Pittsburgh, PA – 67%
- Norfolk, VA – 67%
- Providence, RI – 66%
- Nashville, TN – 66%
- Dallas, TX – 65%
- Austin, TX – 65%
- Oklahoma City, OK – 64%
- Louisville, KY – 64%
- Sacramento, CA – 64%
- Columbus, OH – 64%
- Boston, MA – 63%
- Atlanta, GA – 63%
- Miami, FL – 63%
- Salt Lake City, UT – 63%
- Las Vegas, NV – 62%
- Detroit, MI – 62%
- Washington, DC – 61%
- San Francisco, CA – 61%
- Denver, CO – 61%
- Orlando, FL – 60%
- San Antonio, TX – 60%
- Indianapolis, IN – 59%
- Raleigh, NC – 59%
- Charlotte, NC – 57%
- Los Angeles, CA – 55%
- Portland, OR – 53%
- Greenville, SC – 52%
- Cleveland, OH – 51%
- Tampa, FL – 50%
Data & Methodology
This study is based on a 5,504-person online survey, which included 5,000 18-to-65-year-old respondents in the top 50 metropolitan areas (100 respondents per city) and a nationally representative sample of 504 18-to-65-year-old respondents to contextualize results. The study was fielded in May 2024.
Findings were analyzed by more than 100 demographic and psychographic cuts, including city, region, gender (when we refer to “women” and “men,” we include all people who self-identify as such), age, race and ethnicity, relationship status, parenting status, sexual orientation (heterosexual, bisexual, gay, lesbian, pansexual, asexual, queer, etc.), and political affiliation, among other areas of interest.
Metropolitan populations were determined by 2022 US Census data. In order to represent as many states as possible within the study, five cities that did not fall in the top 50 metropolitan locations were selected in place of cities in states already represented. Cities added to the study included New Orleans, LA (51), Providence, RI (53), Little Rock, AR (59), Honolulu, HI (68), and Omaha, NE (71). Cities replaced in the study included West Palm Beach, FL (39), Jacksonville, FL (41), Grand Rapids, MI (42), Harrisburg, PA (44), and Greensboro, NC (45).
Respondents were asked to rate their happiness on a 1 to 5 scale. To rank the happiest cities in America, Hims looked at the number of respondents who rated themselves as a 4 (happy describes me) or 5 (happy very much describes me) to create an average happiness score.
All data in this study are from this source, unless otherwise noted. Independent research firm, Culture Co-op, conducted and analyzed research and findings.
This story was produced by Hims and reviewed and distributed by Stacker Media.
