Counties where children have the best opportunity for economic mobility in Oregon

cpaulfell // Shutterstock
Counties where children have the best opportunity for economic mobility in Oregon
Americans have long understood that their birthplace can significantly affect their futures, and academics have increasingly been able to connect tangible early life factors like where they live and the friendships they’ve cultivated with potential future income.
Among the most recent studies shedding light on what’s known as economic mobility—a person’s ability to move themselves and their families up the socioeconomic ladder over their lifetime—are a series of papers authored by Harvard University researchers leveraging vast troves of social networking data.
As part of a national analysis, Wealth Enhancement Group used data from Harvard University‘s Social Capital Atlas project to identify where in Oregon children have the best (and worst) chances at upward economic mobility.
The research draws on a privacy-protected dataset representing 21 billion friendships from Facebook made public through its parent company Meta’s Data for Good project. It also uses anonymous tax records, according to the authors. The scholars assigned a score to locales according to how economically connected low- and high-income people living in the area have historically been over at least a decade, per that data. The dataset does not include scores for about 180 of the 3,000 or so counties in the U.S.
The research attempts to fill in the gaps of previous efforts to study American economic mobility that did not consider a person’s vast social networks nor their importance in creating better lives for themselves and their children.
It turns out the ability to cultivate friendships linking people of different socioeconomic backgrounds with one another is the strongest factor in determining whether a child can surpass the earning potential of their parents, Harvard researchers found. They call this economic connectedness.
Read on to find out where economic connectedness is strongest in your state.
![]()

Hugh K Telleria // Shutterstock
#35. Malheur County
– Economic connectedness: 0.59
– Median Income: $47,906
– Population: 31,313
— 79.7% white
— 1% Black
— 2.1% American Indian and Alaska Native
— 1.1% Asian

Canva
#34. Jefferson County
– Economic connectedness: 0.61
– Median Income: $59,748
– Population: 24,232
— 67.3% white
— 0.7% Black
— 14.5% American Indian and Alaska Native
— 0.4% Asian
Bob Pool // Shutterstock
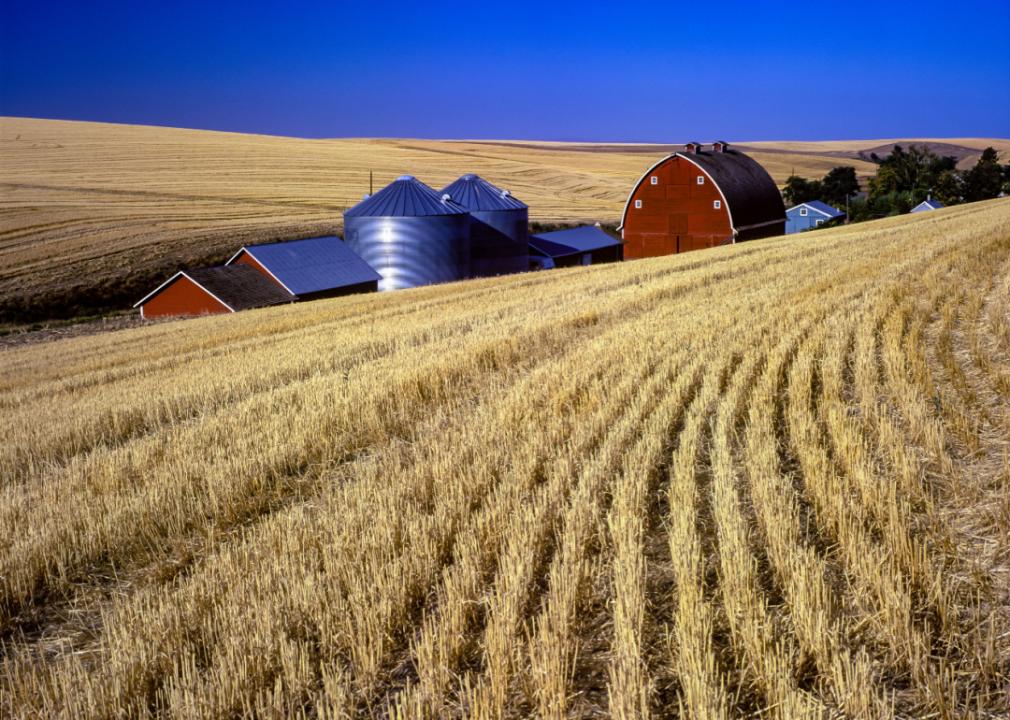
#33. Morrow County
– Economic connectedness: 0.61
– Median Income: $61,659
– Population: 11,964
— 75.6% white
— 0.6% Black
— 1.1% American Indian and Alaska Native
— 0.6% Asian
Bob Pool // Shutterstock
#32. Umatilla County
– Economic connectedness: 0.67
– Median Income: $63,123
– Population: 79,509
— 79.5% white
— 1% Black
— 3.3% American Indian and Alaska Native
— 0.9% Asian
Canva
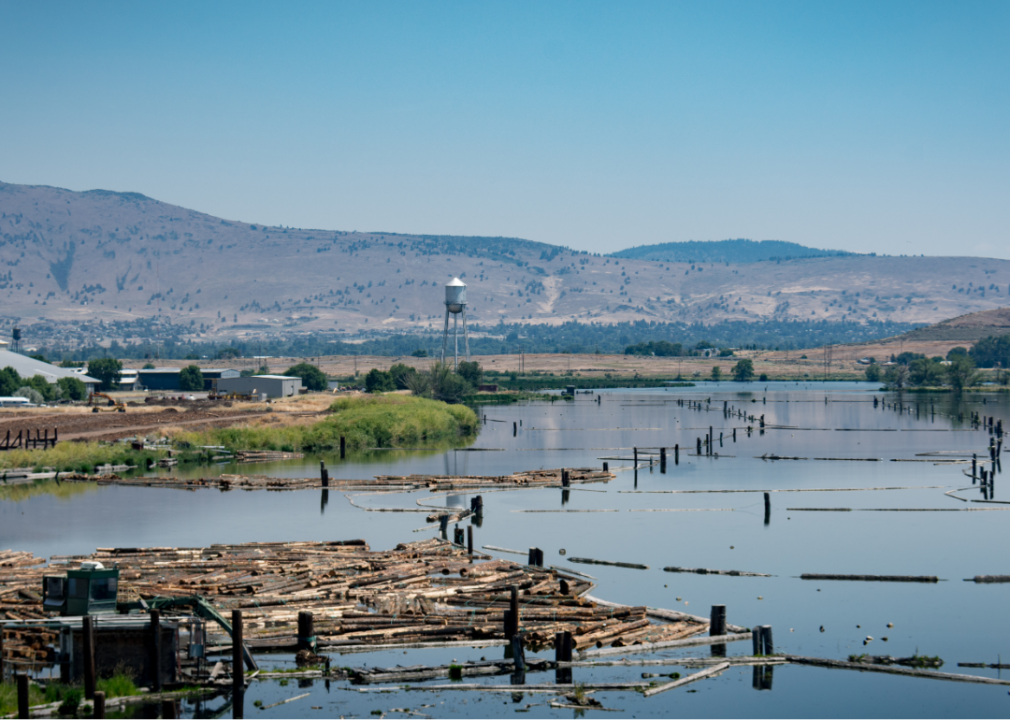
#31. Klamath County
– Economic connectedness: 0.68
– Median Income: $50,790
– Population: 68,899
— 83.4% white
— 0.7% Black
— 3.7% American Indian and Alaska Native
— 1.1% Asian

Canva
#30. Douglas County
– Economic connectedness: 0.68
– Median Income: $52,479
– Population: 110,680
— 90.2% white
— 0.3% Black
— 1% American Indian and Alaska Native
— 0.9% Asian
Canva
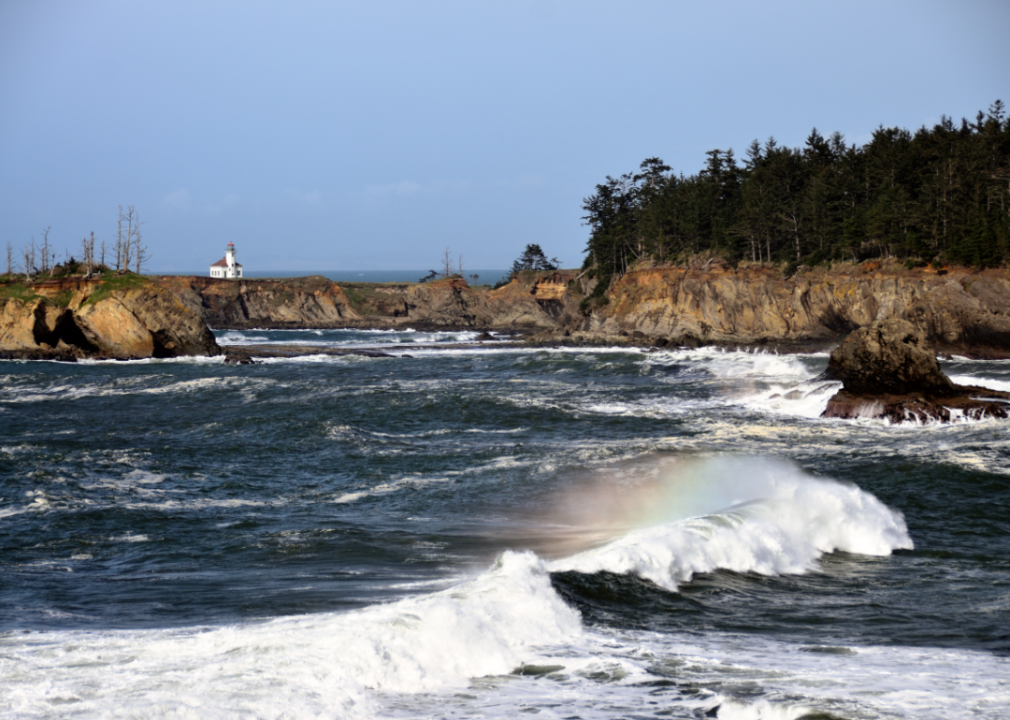
#29. Coos County
– Economic connectedness: 0.71
– Median Income: $52,548
– Population: 64,619
— 87.7% white
— 0.6% Black
— 2% American Indian and Alaska Native
— 1.1% Asian

Dominic Gentilcore PhD // Shutterstock
#28. Lake County
– Economic connectedness: 0.72
– Median Income: $50,685
– Population: 8,119
— 88.2% white
— 0.2% Black
— 2.2% American Indian and Alaska Native
— 0.9% Asian
Canva
#27. Marion County
– Economic connectedness: 0.72
– Median Income: $64,880
– Population: 344,037
— 75.1% white
— 1.1% Black
— 1% American Indian and Alaska Native
— 2.2% Asian

Bob Pool // Shutterstock
#26. Josephine County
– Economic connectedness: 0.72
– Median Income: $51,733
– Population: 87,686
— 89.7% white
— 0.6% Black
— 0.7% American Indian and Alaska Native
— 0.9% Asian

Canva
#25. Lincoln County
– Economic connectedness: 0.73
– Median Income: $54,961
– Population: 49,866
— 85.9% white
— 0.4% Black
— 2.4% American Indian and Alaska Native
— 1.3% Asian

Canva
#24. Baker County
– Economic connectedness: 0.75
– Median Income: $46,922
– Population: 16,539
— 91.4% white
— 1.1% Black
— 1.4% American Indian and Alaska Native
— 0.4% Asian
Canva
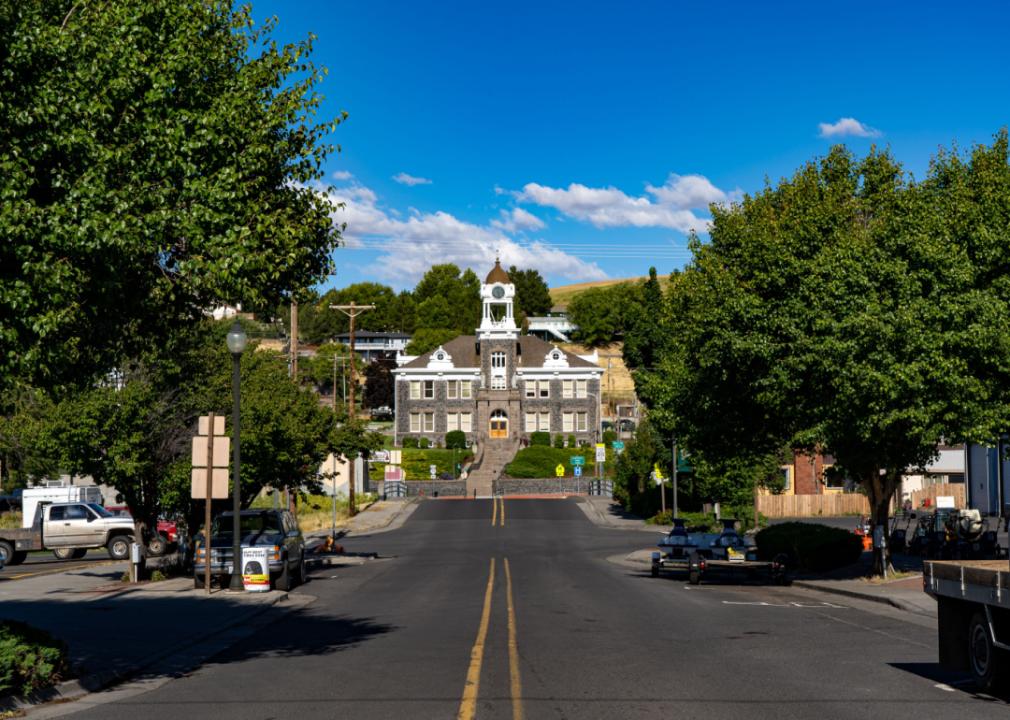
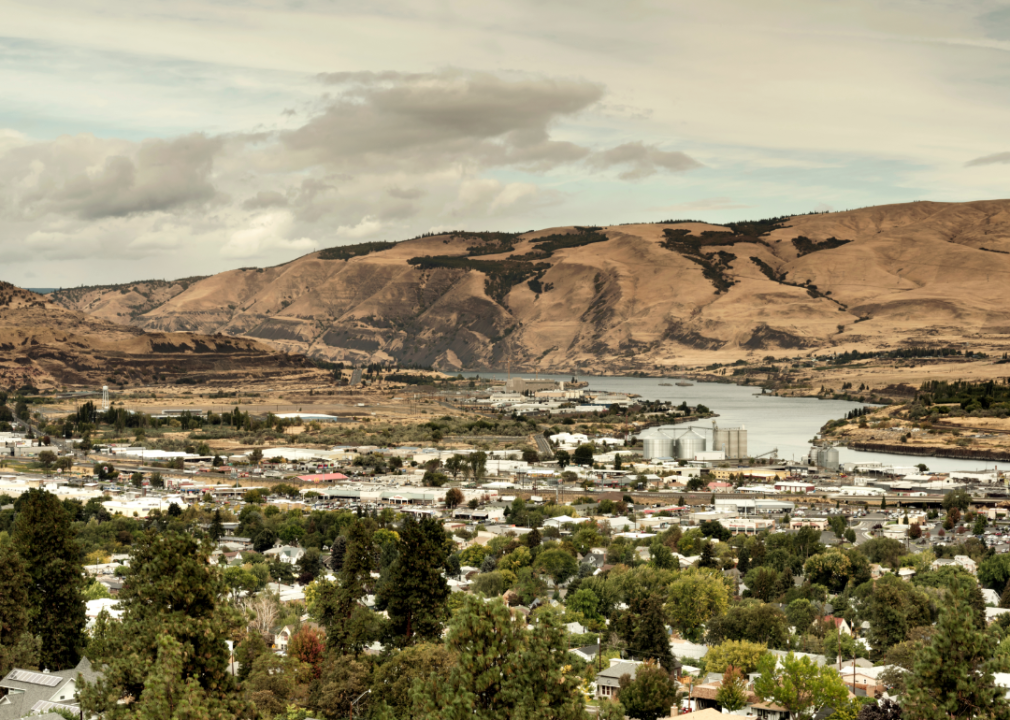
#23. Wasco County
– Economic connectedness: 0.75
– Median Income: $57,853
– Population: 26,603
— 83.4% white
— 0.3% Black
— 2.7% American Indian and Alaska Native
— 0.9% Asian

Canva
#22. Jackson County
– Economic connectedness: 0.75
– Median Income: $61,020
– Population: 221,662
— 87.8% white
— 0.6% Black
— 0.9% American Indian and Alaska Native
— 1.2% Asian
Canva
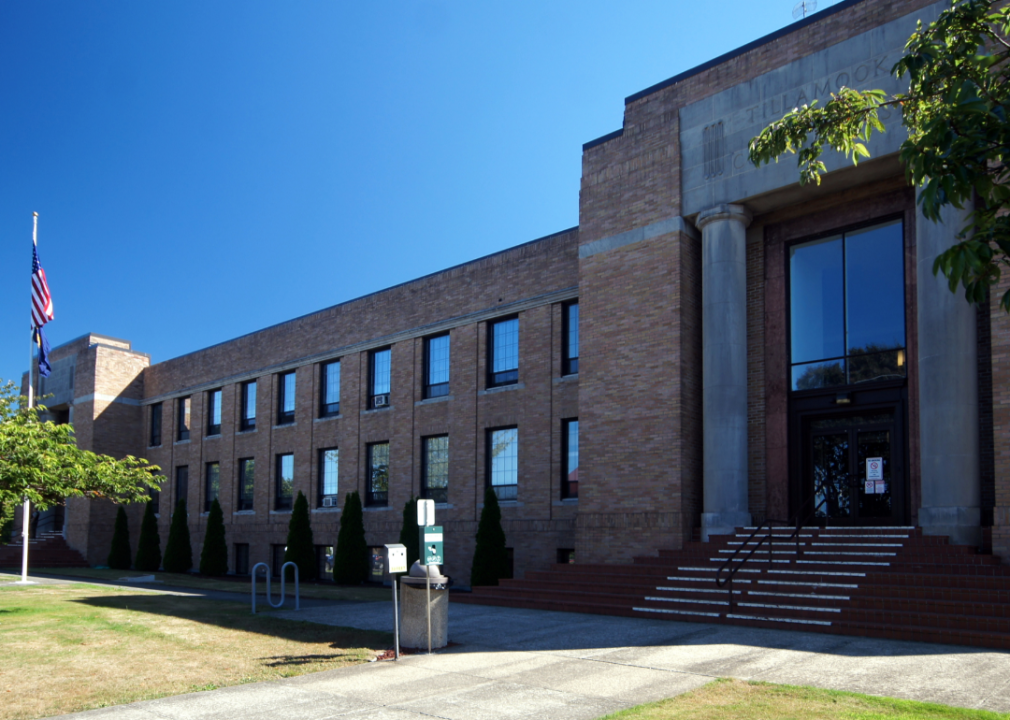
#21. Tillamook County
– Economic connectedness: 0.76
– Median Income: $55,730
– Population: 27,129
— 90% white
— 0.4% Black
— 0.9% American Indian and Alaska Native
— 0.6% Asian

Manuela Durson // Shutterstock
#20. Curry County
– Economic connectedness: 0.77
– Median Income: $57,553
– Population: 23,234
— 89.5% white
— 0.1% Black
— 1.3% American Indian and Alaska Native
— 0.9% Asian
Canva
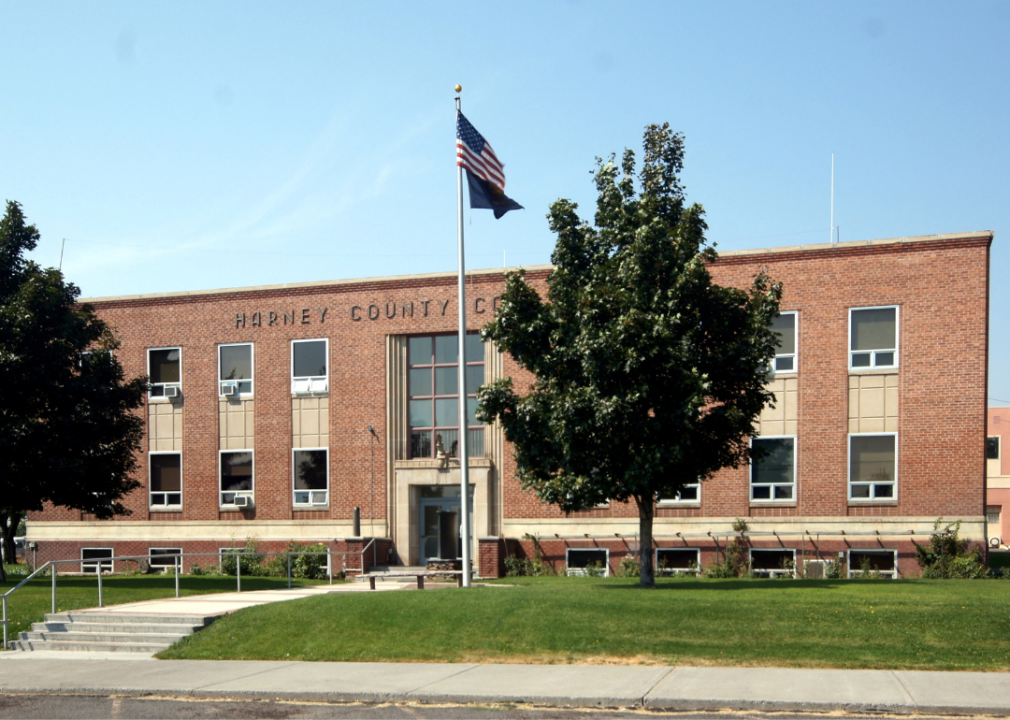
#19. Harney County
– Economic connectedness: 0.78
– Median Income: $42,095
– Population: 7,454
— 89.9% white
— 0.8% Black
— 1.1% American Indian and Alaska Native
— 0% Asian
Canva
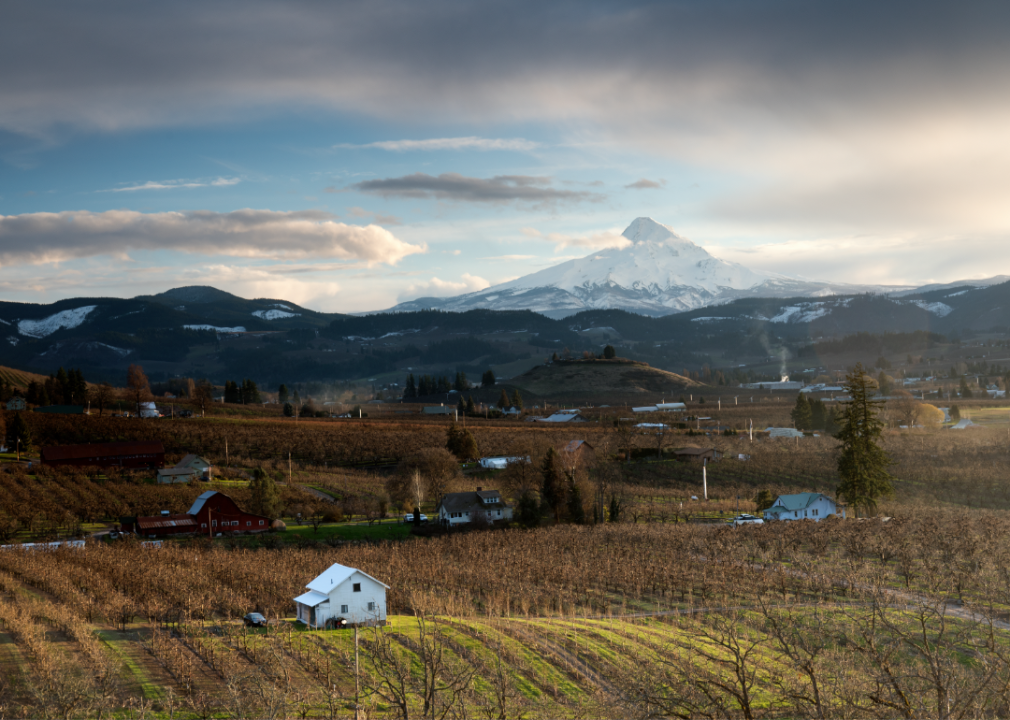
#18. Hood River County
– Economic connectedness: 0.79
– Median Income: $77,815
– Population: 23,915
— 81.6% white
— 0.7% Black
— 0.4% American Indian and Alaska Native
— 1% Asian
Canva
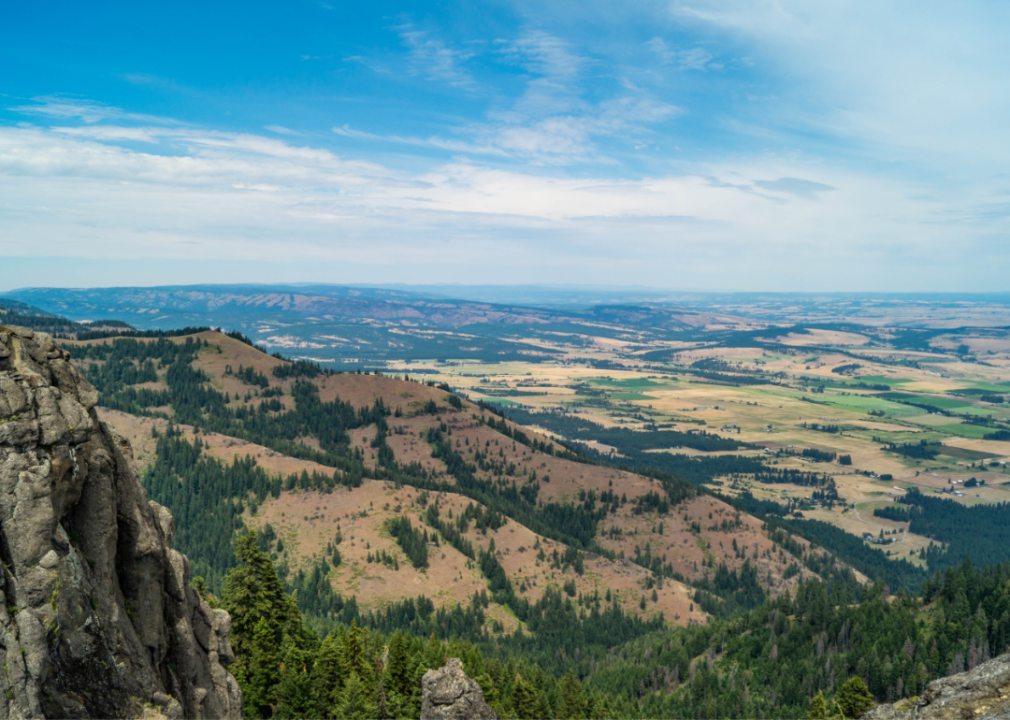
#17. Union County
– Economic connectedness: 0.79
– Median Income: $55,227
– Population: 26,255
— 91% white
— 0.8% Black
— 1.1% American Indian and Alaska Native
— 1.1% Asian

Canva
#16. Crook County
– Economic connectedness: 0.79
– Median Income: $64,820
– Population: 24,300
— 91.9% white
— 0.2% Black
— 1.5% American Indian and Alaska Native
— 0.3% Asian
![]()
Canva
#15. Linn County
– Economic connectedness: 0.81
– Median Income: $63,313
– Population: 127,200
— 87.8% white
— 0.4% Black
— 0.9% American Indian and Alaska Native
— 1% Asian

Dee Browning // Shutterstock
#14. Grant County
– Economic connectedness: 0.82
– Median Income: $51,100
– Population: 7,225
— 92.8% white
— 0.1% Black
— 1% American Indian and Alaska Native
— 0.6% Asian

Canva
#13. Lane County
– Economic connectedness: 0.83
– Median Income: $59,016
– Population: 380,532
— 84.5% white
— 1% Black
— 0.8% American Indian and Alaska Native
— 2.7% Asian
Cynthia Liang // Shutterstock
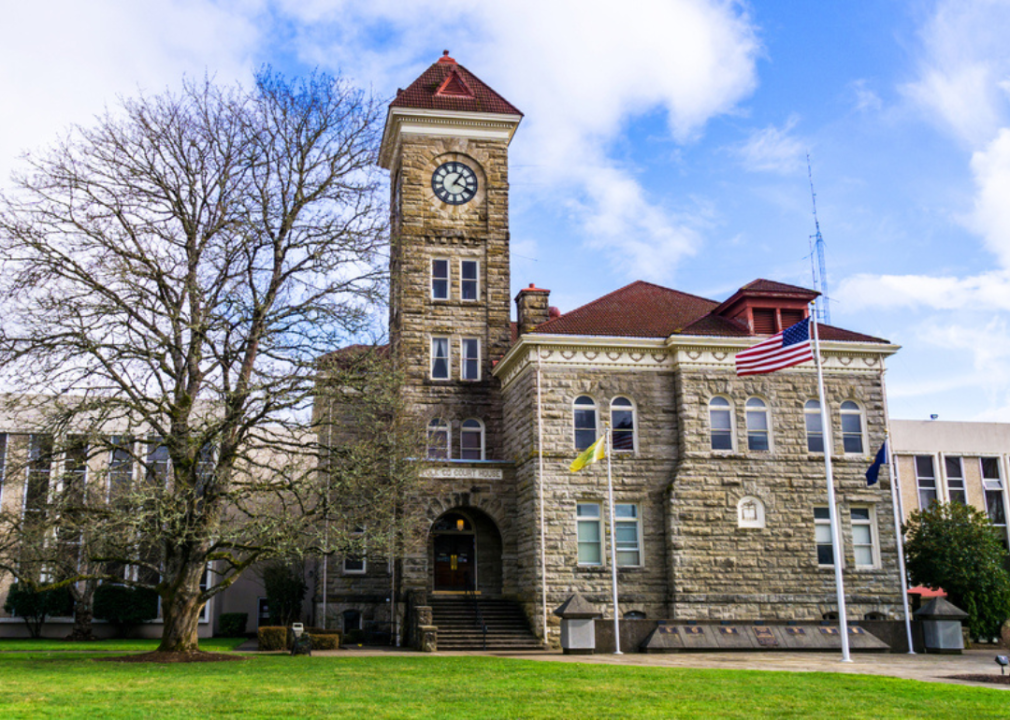
#12. Polk County
– Economic connectedness: 0.84
– Median Income: $70,238
– Population: 86,347
— 84.1% white
— 0.7% Black
— 2.2% American Indian and Alaska Native
— 1.8% Asian

Canva
#11. Yamhill County
– Economic connectedness: 0.85
– Median Income: $73,409
– Population: 107,024
— 83.2% white
— 0.7% Black
— 0.9% American Indian and Alaska Native
— 1.5% Asian
Canva
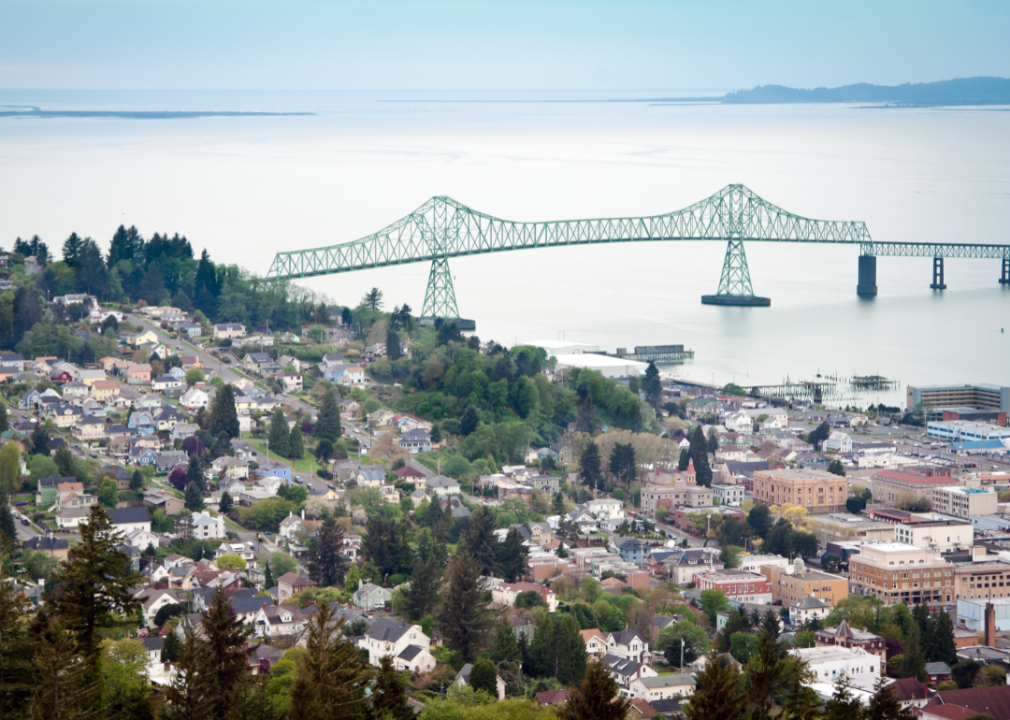
#10. Clatsop County
– Economic connectedness: 0.85
– Median Income: $61,846
– Population: 40,720
— 88.3% white
— 0.9% Black
— 0.7% American Indian and Alaska Native
— 1.1% Asian

Arpad Jasko // Shutterstock
#9. Gilliam County
– Economic connectedness: 0.87
– Median Income: $51,705
– Population: 1,954
— 89.3% white
— 0% Black
— 2.1% American Indian and Alaska Native
— 0.6% Asian
Canva
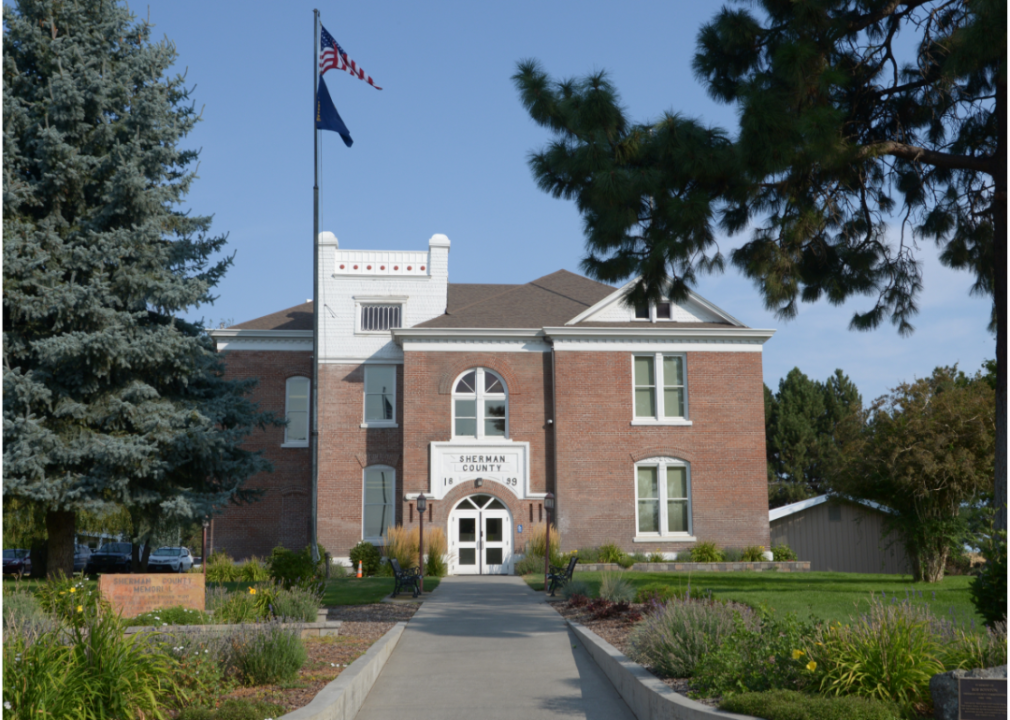
#8. Sherman County
– Economic connectedness: 0.89
– Median Income: $53,606
– Population: 1,784
— 88% white
— 0.2% Black
— 0.5% American Indian and Alaska Native
— 0.2% Asian
kenneth korb // Shutterstock

#7. Columbia County
– Economic connectedness: 0.9
– Median Income: $73,909
– Population: 52,381
— 89.6% white
— 0.5% Black
— 0.8% American Indian and Alaska Native
— 0.8% Asian

Canva
#6. Wallowa County
– Economic connectedness: 0.91
– Median Income: $57,891
– Population: 7,330
— 92.5% white
— 0.9% Black
— 0.7% American Indian and Alaska Native
— 0.2% Asian

Josemaria Toscano // Shutterstock
#5. Multnomah County
– Economic connectedness: 0.92
– Median Income: $76,290
– Population: 810,011
— 74.3% white
— 5.3% Black
— 0.9% American Indian and Alaska Native
— 7.7% Asian
Canva
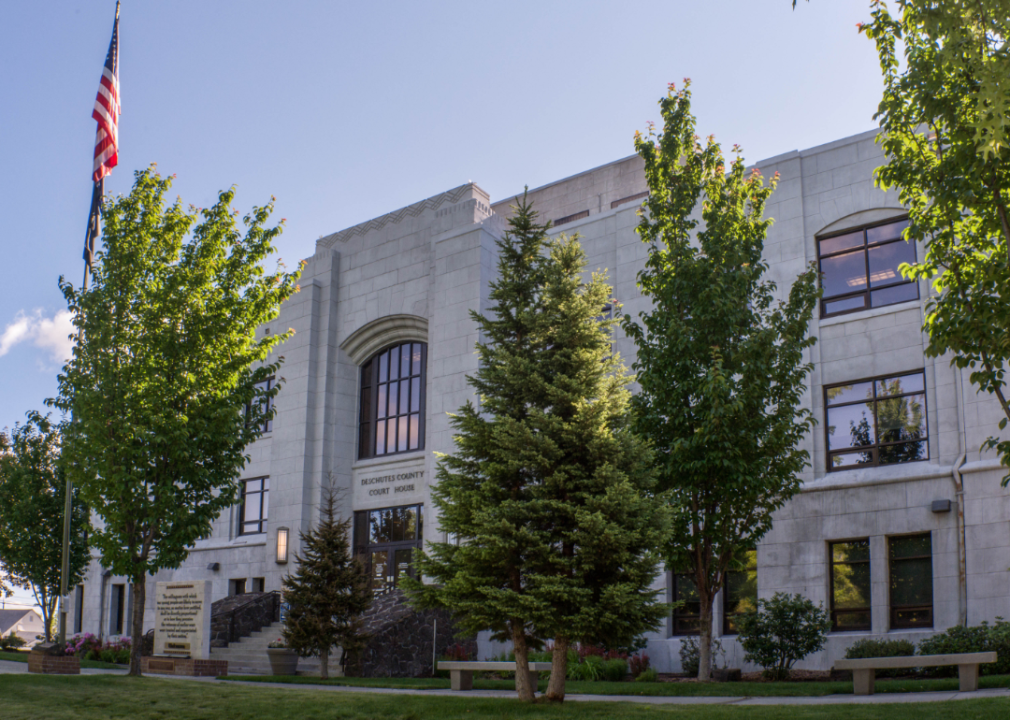
#4. Deschutes County
– Economic connectedness: 0.97
– Median Income: $74,082
– Population: 194,964
— 91% white
— 0.5% Black
— 0.7% American Indian and Alaska Native
— 1.1% Asian

Yanqiang Dai // Shutterstock
#3. Washington County
– Economic connectedness: 0.97
– Median Income: $92,025
– Population: 596,969
— 71.5% white
— 2.3% Black
— 0.8% American Indian and Alaska Native
— 10.8% Asian

Canva
#2. Clackamas County
– Economic connectedness: 0.97
– Median Income: $88,517
– Population: 418,577
— 83.9% white
— 0.8% Black
— 0.5% American Indian and Alaska Native
— 4.5% Asian
cpaulfell // Shutterstock
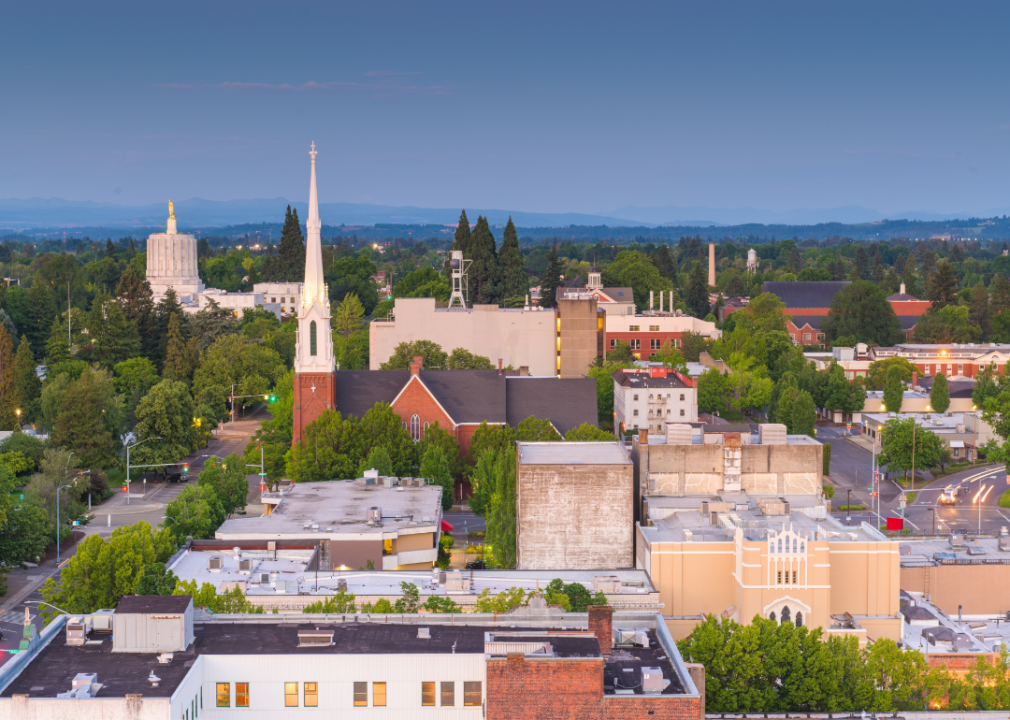
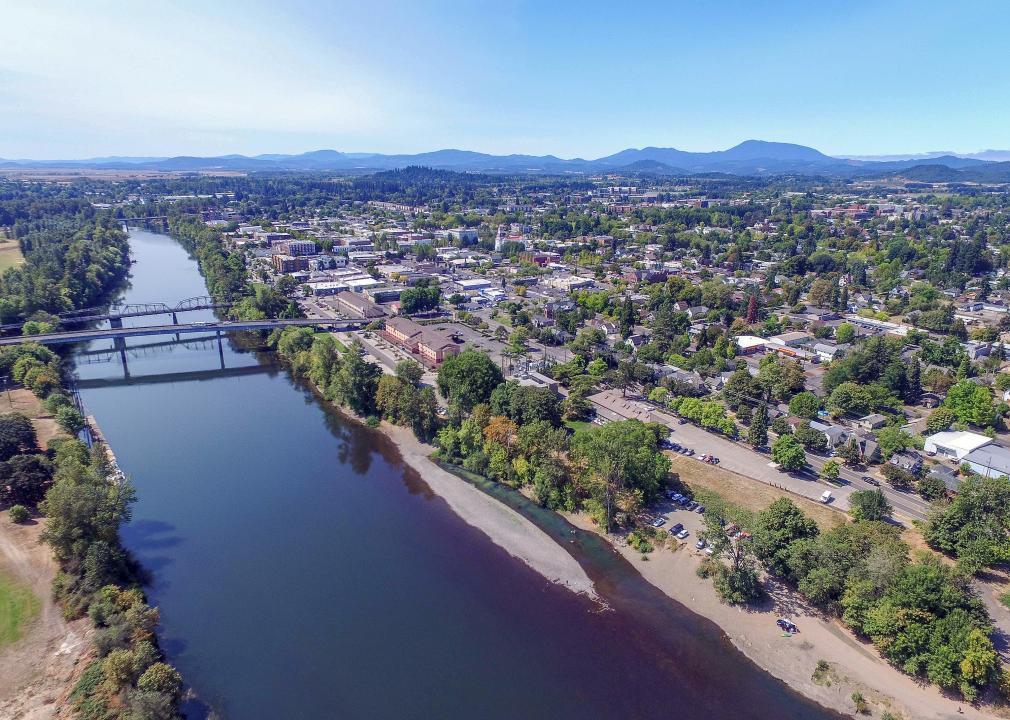
#1. Benton County
– Economic connectedness: 1.03
– Median Income: $68,732
– Population: 94,667
— 82.4% white
— 1.1% Black
— 0.7% American Indian and Alaska Native
— 7.3% Asian
This story features data reporting and writing by Dom DiFurio and is part of a series utilizing data automation across 50 states.
This story originally appeared on Wealth Enhancement Group and was produced and
distributed in partnership with Stacker Studio.
