Explore the last 50 years of Summer Olympics medal designs
THOMAS SAMSON/AFP via Getty Images
Explore the last 50 years of Summer Olympics medal designs
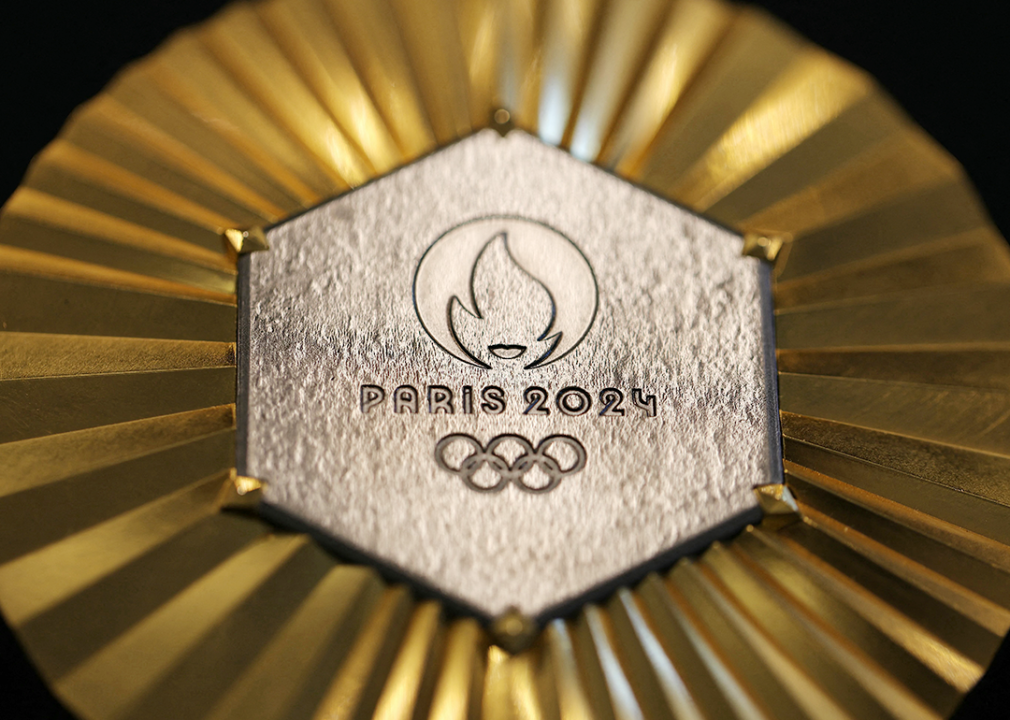
Detail of Paris 2024 Olympics gold medal.
Outside the thrill of competition, the best and most emotional moments of the Olympics are the medal ceremonies, where champions and their supporters revel in their victories and take home a reminder of their monumental achievements. Paris is no exception.
Designed by luxury jeweler Chaumet and made by France’s official mint, Monnaie de Paris, each of the winners’ medals is infused with 18 grams of iron directly from the Eiffel Tower—a reward for athletic achievement and a memorable token of Parisian iconography.
The City of Light isn’t the only Olympic host to make its subtle mark on the Olympics. The tradition of awarding three distinct medals started 120 years ago at the 1904 St. Louis Olympic Games. Contrary to their appearance, gold medals are mostly silver (and only contain about 6 grams of real gold), while a bronze medal is roughly 95% copper. The host city’s organizing committee designs the medals, mostly featuring the Olympic rings and Nike, the Greek goddess of victory. Historically, the United States and Russia have earned most of these medals—but in each of the last six Summer Olympics, the People’s Republic of China has finished as a top-three medal finisher.
What will the results be this year? That’s up for debate. But one thing is certain: The International Olympic Committee will distribute 5,084 medals for the Olympics and Paralympics. The awarding ceremony presents them in front of festive crowds, representative flags, a three-tiered podium, and a concluding national anthem—pomp and circumstance that most athletes only dream about experiencing. Whether athletes earn gold, silver, or bronze souvenirs, they know they will forever be hailed as Olympic champions.
To celebrate the upcoming Games, SD Bullion used Olympedia data to look at medal designs for the Summer Olympics since 1976 and which countries won the most each year. Countries are sorted by total medal points.
![]()
AGB Photo Library/Universal Images Group via Getty Images
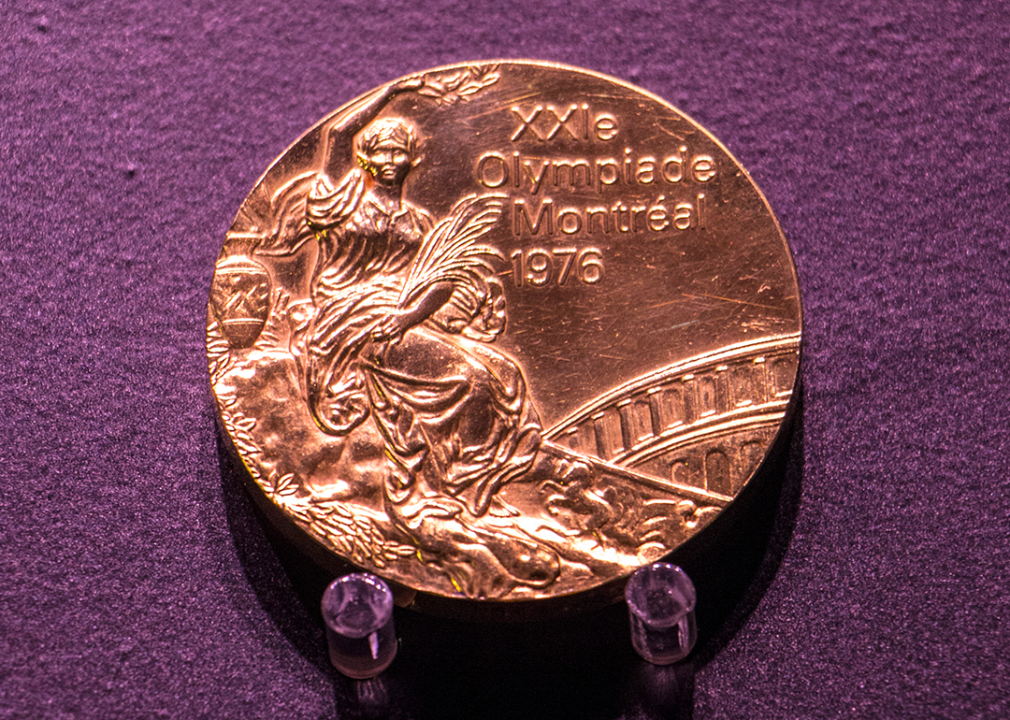
Montreal 1976
Montreal Olympic medal detail.
Leading countries:
– Soviet Union: 49 gold, 41 silver, 35 bronze
– United States: 34 gold, 35 silver, 25 bronze
– East Germany: 40 gold, 25 silver, 25 bronze
On its obverse side (aka the head-facing side of a coin), Montréal’s medal contains the goddess of victory holding a crown and a winner’s palm, a featured design ever since Florentine artist Giuseppe Cassioli created it for the 1928 Olympics in Amsterdam. Made by the Royal Canadian Mint, the reverse side showcases a plain laurel crown and the rings, an intentionally bare design but all the better for its simplicity.
AGB Photo Library/Universal Images Group via Getty Images
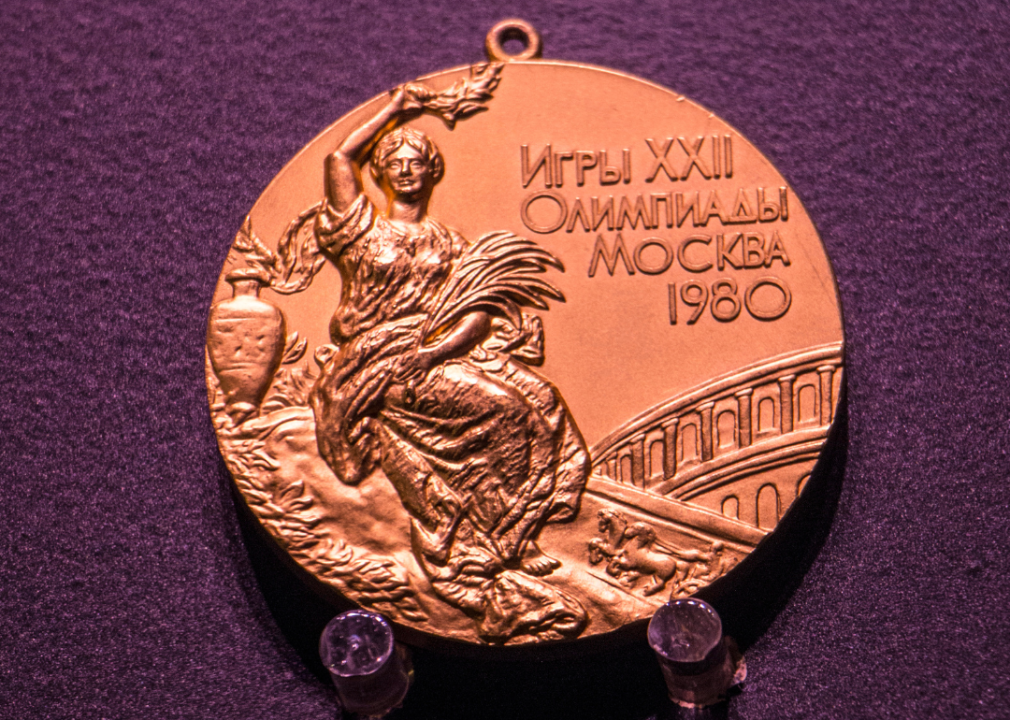
Moscow 1980
Close-up view of Moscow Olympic medal.
Leading countries:
– Soviet Union: 80 gold, 69 silver, 46 bronze
– East Germany: 47 gold, 37 silver, 42 bronze
– Bulgaria: 8 gold, 16 silver, 17 bronze
Only 80 nations competed in the Moscow Olympic Games (the result of boycotts), leading to some distorted medal numbers. Similar to Montréal, the Soviet capital kept the same Nike design on one side but also added some more simplistic symbols and signifiers on the reverse: an Olympic bowl, an eternal flame, and the Games emblem in the upper right-hand corner.
David Madison // Getty Images
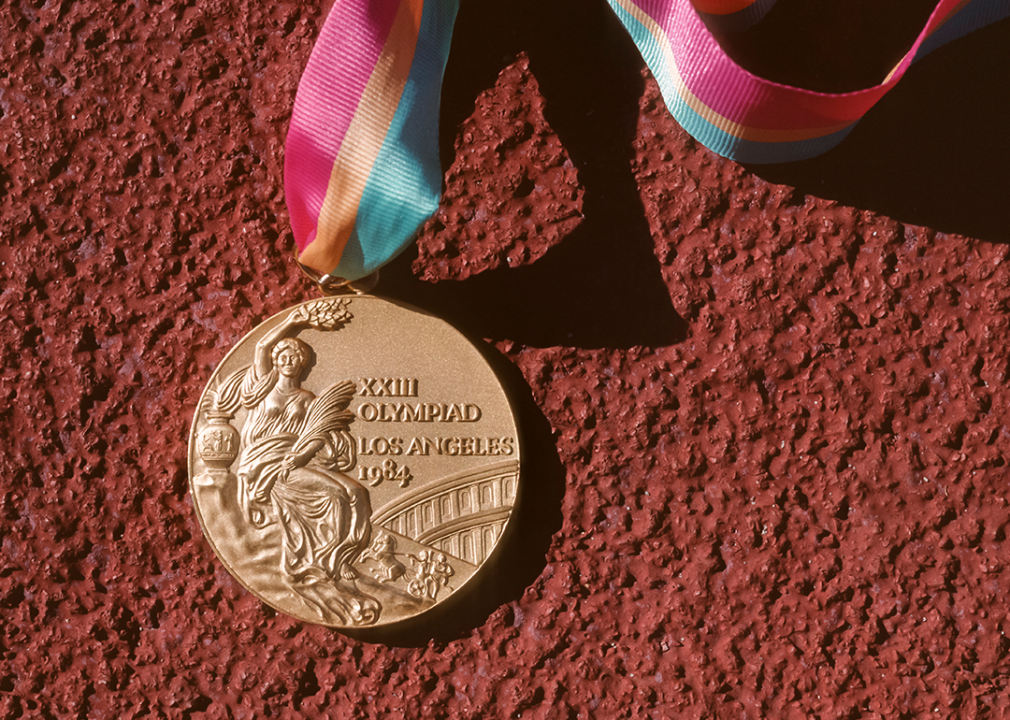
Los Angeles 1984
Close-up view of Los Angeles gold medal on paved surface.
Leading countries:
– United States: 83 gold, 61 silver, 30 bronze
– West Germany: 17 gold, 19 silver, 23 bronze
– Romania: 20 gold, 16 silver, 17 bronze
Like the previous two Summer Games, Los Angeles maintained the same medal composition (gilt silver, silver, and bronze) for first, second, and third place, respectively, along with the same Nike pose on its obverse side. But the reverse is an intricately crafted depiction of a celebratory crowd carrying an Olympic champion, whose right arm is raised in celebration with the Olympic stadium as a backdrop.
David Madison // Getty Images
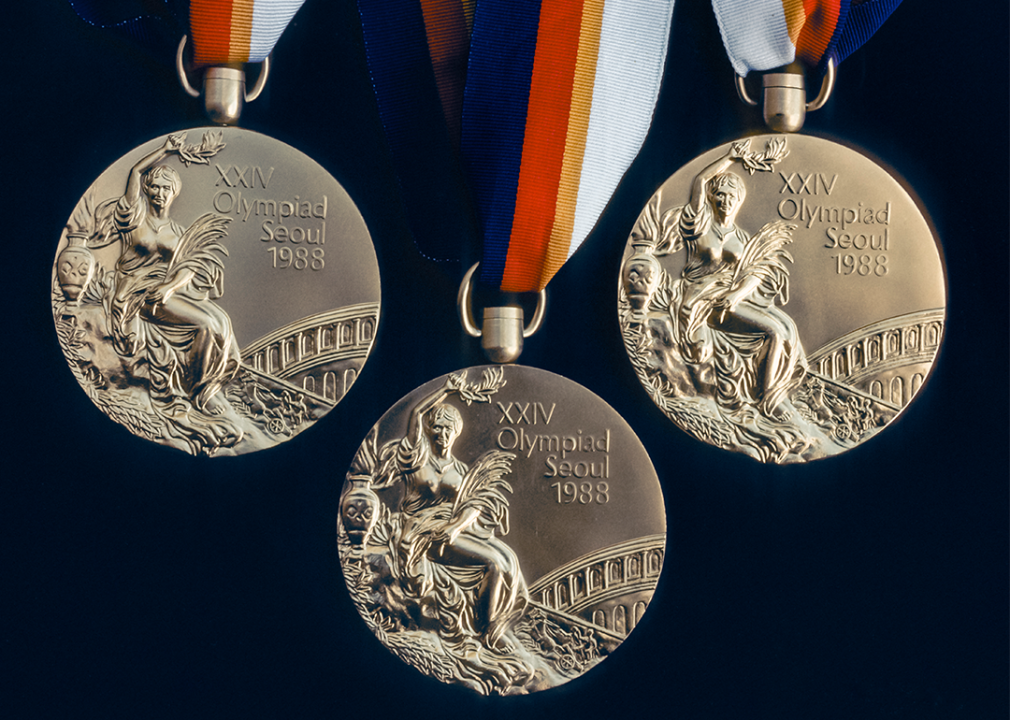
Seoul 1988
A close-up view of an Olympic gold medal awarded during the 1988 Olympic Games.
Leading countries:
– Soviet Union: 55 gold, 31 silver, 46 bronze
– East Germany: 37 gold, 35 silver, 30 bronze
– United States: 36 gold, 31 silver, 27 bronze
Seoul mixed up the medal composition in 1988, inserting its first-place medal with 92.5% gold gilt and more than 5 grams of real gold. The second-place medal was made of silver and bronze, while the third-place medal contained bronze, zinc, and copper. The outline of a dove, the symbol of peace, with a branch in its mouth adorns the reverse side, as do three Taegeuk patterns from the Korean flag.
AGB Photo Library/Universal Images Group via Getty Images
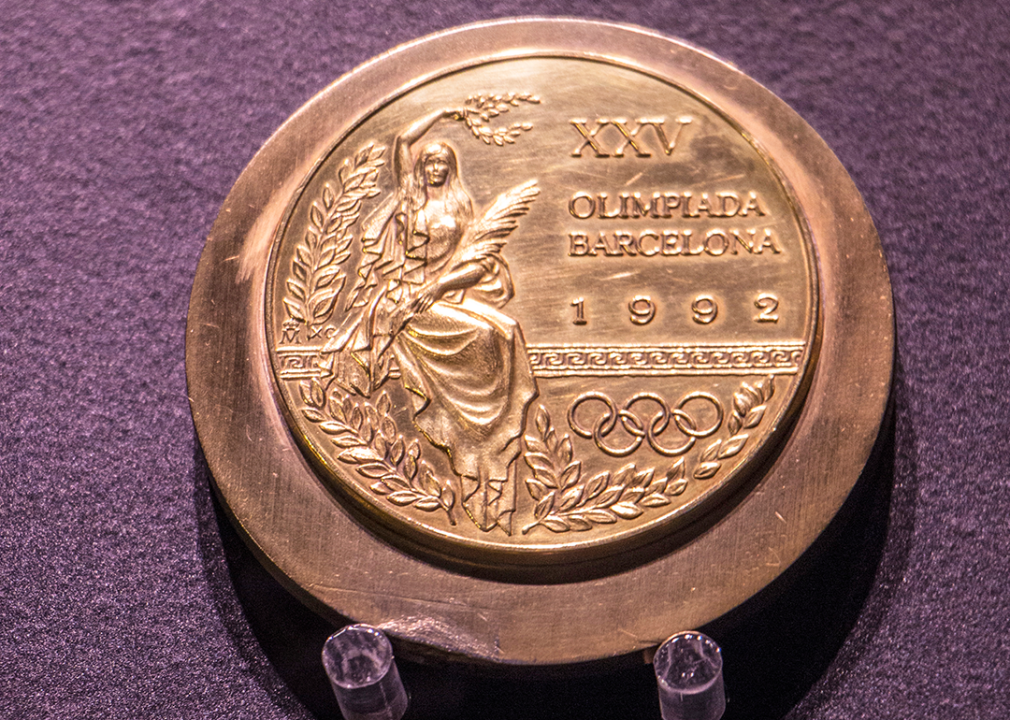
Barcelona 1992
Close-up view of Barcelona Olympic Games medal.
Leading countries:
– Unified Team: 45 gold, 38 silver, 29 bronze
– United States: 37 gold, 34 silver, 37 bronze
– Germany: 33 gold, 21 silver, 28 bronze
At 70 millimeters in diameter, Barcelona’s medal is about 10 millimeters larger than its predecessors. The obverse side contains a more modern depiction of Nike along with the inscription “XXV OLIMPÍADA BARCELONA 1992.” On the reverse, it centers Barcelona’s official emblem (a vague athlete), designed by sculptor Xavier Corberó.
Allsport // Getty Images
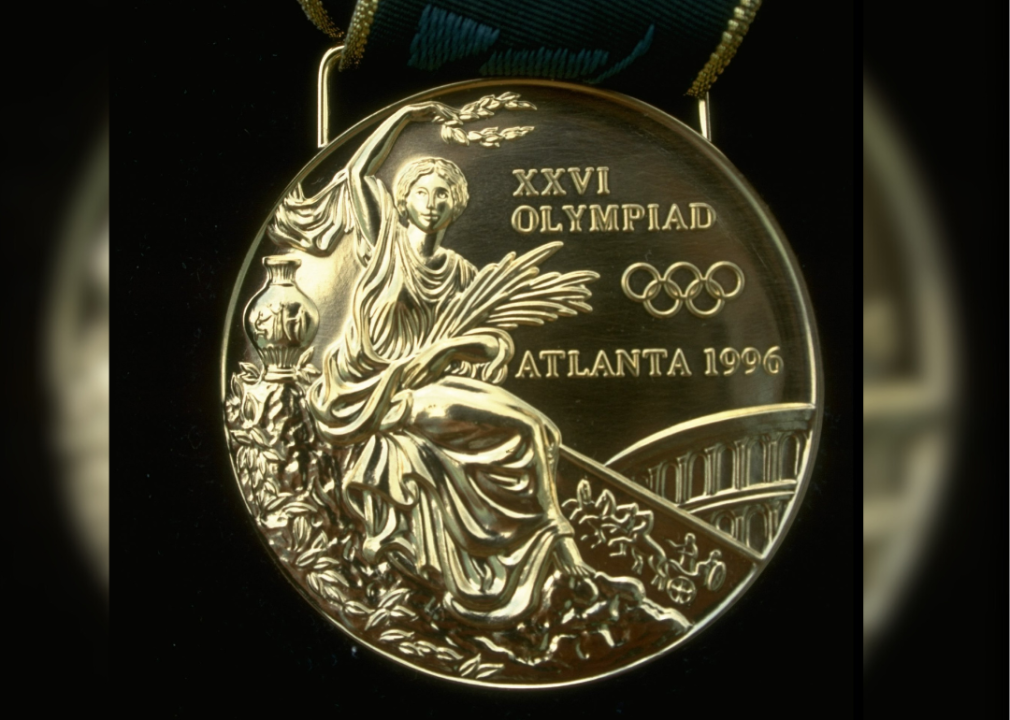
Atlanta 1996
Portrait of the gold medal for the 1996 Olympic Games.
Leading countries:
– United States: 44 gold, 32 silver, 25 bronze
– Russian Federation: 26 gold, 21 silver, 16 bronze
– Germany: 20 gold, 18 silver, 27 bronze
To celebrate the 100th anniversary of the Olympic Games’ renewal, Atlanta’s medals—made by Reed and Barton—all contain “Centennial Olympic Games” around the outer edge of the reverse side. Within it lies a “Quilt of Leaves” olive branch pattern with Atlanta’s Olympic emblem (stars shaped like an eternal flame) crafted by Malcolm Grear Designers.
Alexander Hassenstein/Bongarts // Getty Images
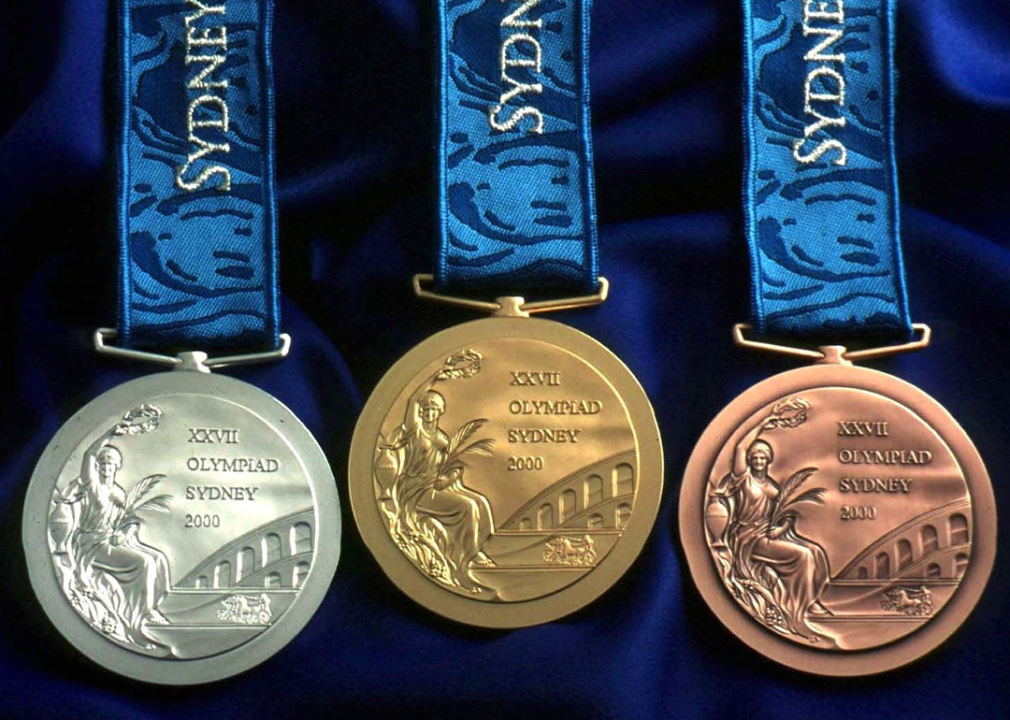
Sydney 2000
Set of Olympic Games Sydney 2000 medals on blue background.
Leading countries:
– United States: 37 gold, 24 silver, 32 bronze
– Russian Federation: 32 gold, 28 silver, 29 bronze
– People’s Republic of China: 28 gold, 16 silver, 14 bronze
Though the obverse still carries the traditional Nike design, designer Wojciech Pietranik blended the city’s signature opera house exterior and eternal flame with smoothed-out edges for the reverse. The undefined lines help accentuate the darker-edged, five-ring logo, making its 68-millimeter diameter really pop.
Milos Bicanski // Getty images
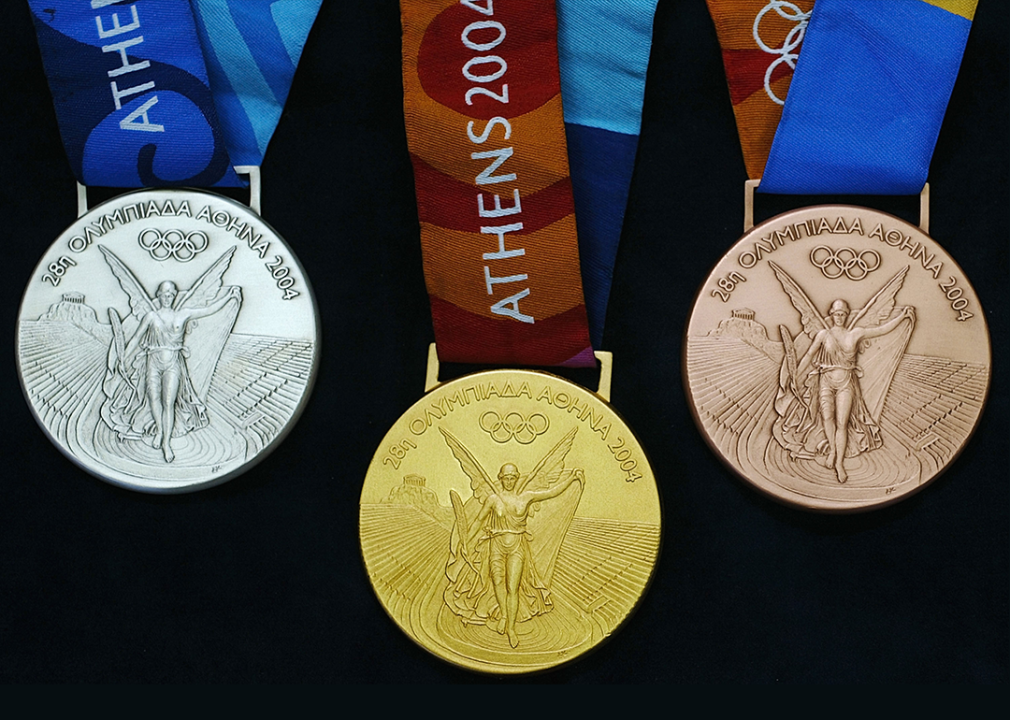
Athens 2004
Set of medals for the Athens Olympics.
Leading countries:
– United States: 36 gold, 39 silver, 26 bronze
– Russian Federation: 28 gold, 26 silver, 36 bronze
– People’s Republic of China: 32 gold, 17 silver, 14 bronze
In a refreshing change from tradition, the obverse displays Nike flying into the stadium (as opposed to sitting), the first big design alteration since the Amsterdam Olympic Games in 1928. The reverse side contains three primary elements: the eternal flame, the opening words of Pindar’s Eighth Olympic Ode, and the Athens Olympic emblem. The flying Nike would become the standard obverse design for future Olympic medals.
BOCOG // Getty Images
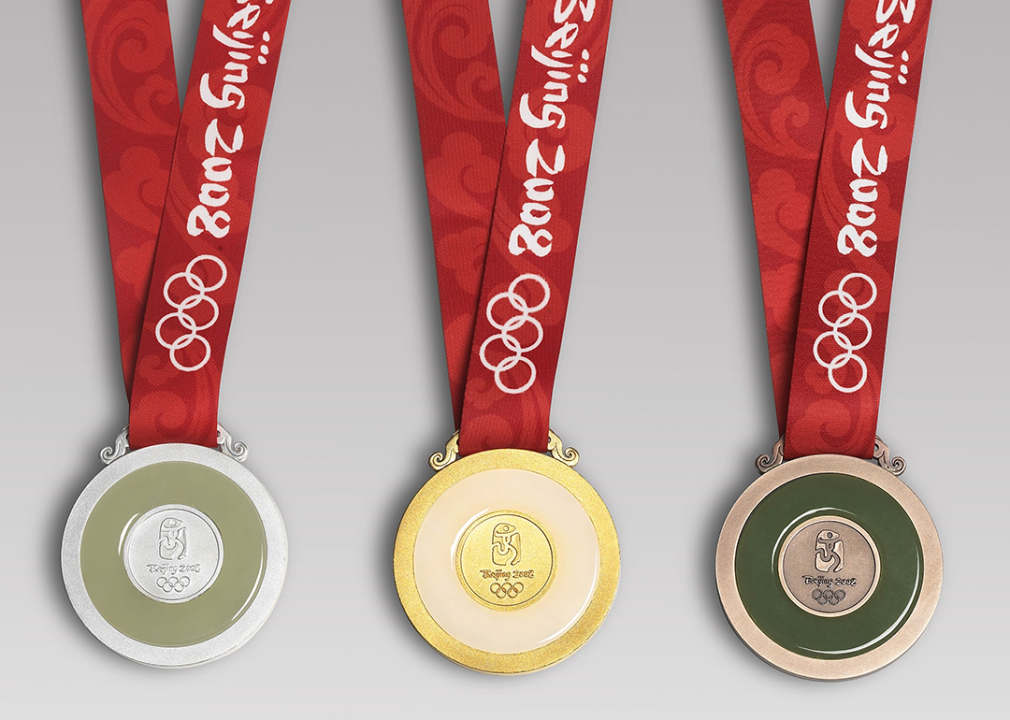
Beijing 2008
Beijing 2008 Olympic Game medals.
Leading countries:
– United States: 36 gold, 39 silver, 37 bronze
– People’s Republic of China: 48 gold, 22 silver, 30 bronze
– Russian Federation: 24 gold, 13 silver, 23 bronze
For the first time in Olympic history, the Beijing Games incorporated jade into its medals. The stone’s inclusion was inspired by “bi,” carved jade discs with a center hole that have been used as artistic objects in China for thousands of years. The medals reflect the Chinese virtues of ethics and honor. The jade is on the reverse side, with a small circular centerpiece where the Beijing Olympic emblem lies.
LOCOG via Getty Images
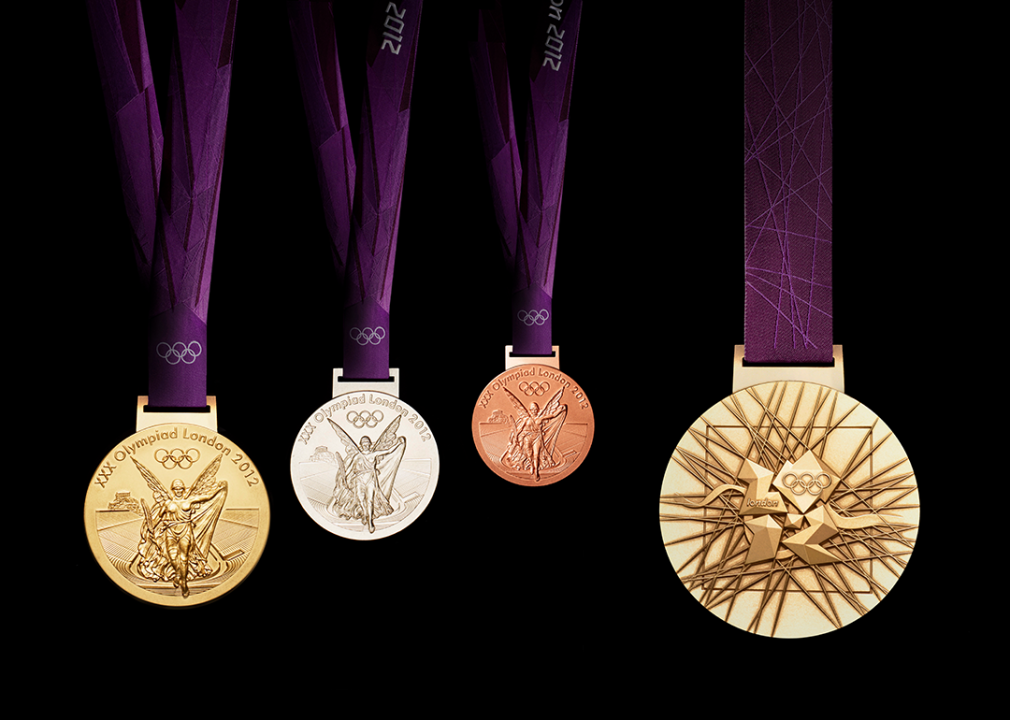
London 2012
Set of 2012 London Olympic medals.
Leading countries:
– United States: 48 gold, 26 silver, 30 bronze
– People’s Republic of China: 39 gold, 31 silver, 22 bronze
– Great Britain: 29 gold, 18 silver, 18 bronze
Thanks to London’s 85-millimeter medal diameter, medal designers David Watkins and Elena Votsi had a bigger canvas to work with. They used it to create something more abstract on the reverse side, with an interlocking grid pattern and a ribbon representing the Thames tying the design together. A square helps balance the medal’s circular shape, drawing the eye toward the London Olympic emblem in the center.
Alex Ferro/Jogos Rio 2016 via Getty Images
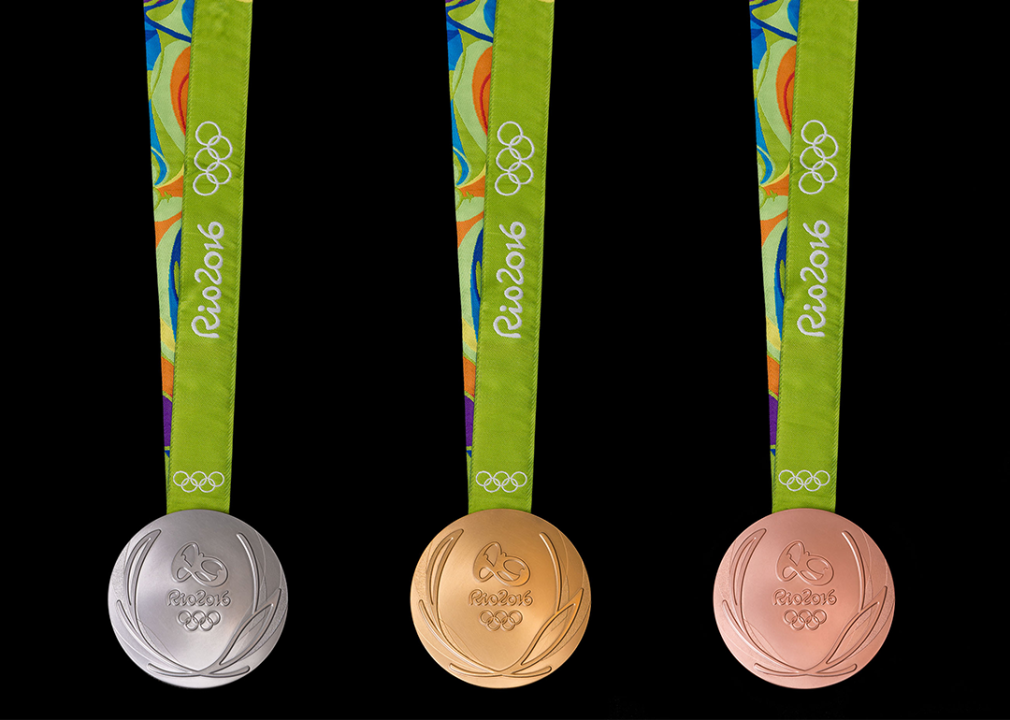
Rio de Janeiro 2016
Set of medals from the Rio Olympic Games 2016.
Leading countries:
– United States: 46 gold, 37 silver, 38 bronze
– Great Britain: 27 gold, 23 silver, 17 bronze
– People’s Republic of China: 26 gold, 18 silver, 26 bronze
One of the more simplistic designs of the century, Rio’s medal boasts two wreaths of laurel leaves, meant to signify victory. But the medal’s composition is more interesting. With the idea of sustainability front and center, Brazilian designers used 30% recyclable material for the silver and bronze medals. Meanwhile, the gold medals met strict environmental laws, using recycled silver from leftover mirrors, waste solders, and X-ray plates.
Jamie Squire // Getty Images
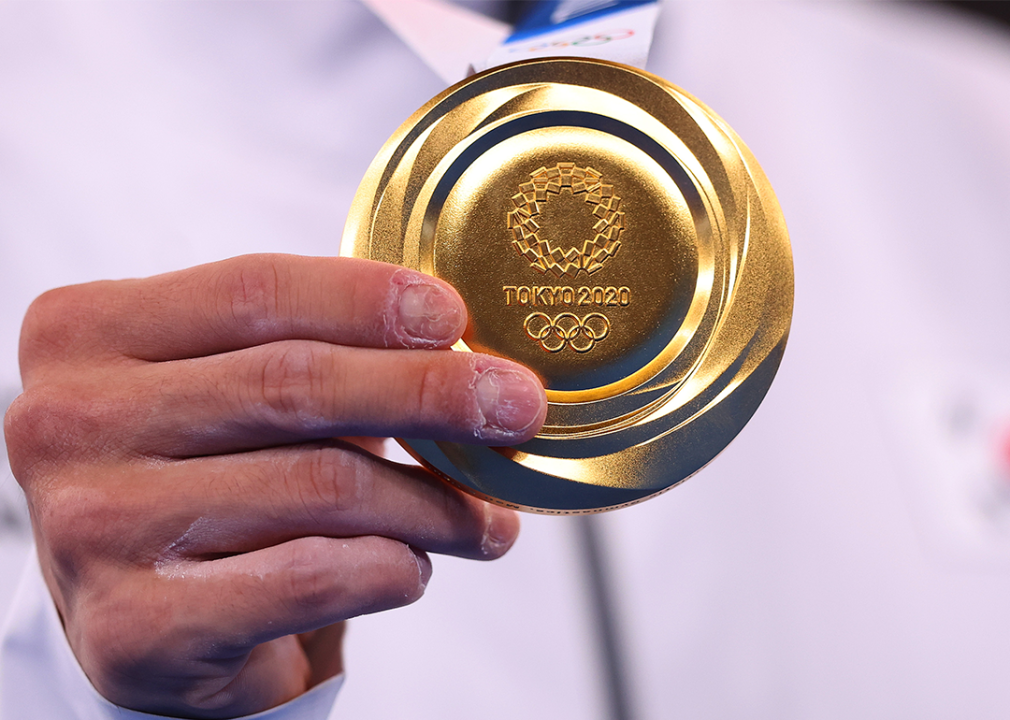
Tokyo 2020
Close-up view of the gold medal awarded to Jeahwan Shin of Team South Korea.
Leading countries:
– United States: 39 gold, 41 silver, 33 bronze
– People’s Republic of China: 38 gold, 32 silver, 19 bronze
– Russia Olympic Committee: 20 gold, 28 silver, 23 bronze
Junichi Kawanishi won a nationwide competition, which included other professional and student designers, to create the look of Tokyo’s medals. The reverse side features the city’s Olympic emblem surrounded by layers of elevated rings that reflect patterns of light meant to represent the energy of Olympic athletes and fans. Like Rio’s sustainable practices, Tokyo ensured its medals used metal extracted from recycled consumer electronics over the previous two years.
Story editing by Carren Jao. Copy editing by Robert Wickwire.
This story originally appeared on SD Bullion and was produced and
distributed in partnership with Stacker Studio.
