Counties with the highest rate of food insecure children in Oregon

Finetooth // Wikimedia Commons
Food insecurity is a widespread problem in the United States, with people experiencing food insecurity in every single county in the nation. The nonprofit Feeding America describes food insecurity as “a lack of consistent access to enough food for every person in a household to live an active, healthy life.”
Food insecurity hits children particularly hard. The USDA estimates that more than 5.3 million children lived in food-insecure households in 2019. The COVID-19 pandemic put further strain on households already experiencing food hardship, with Feeding America estimating that 13 million children may experience food insecurity in 2021—that’s one in six children. Not having consistent access to enough food can affect cognitive abilities, overall health, moods, and attention spans—not to mention the psychological effects of living with scarcity.
Stacker compiled a list of counties in Oregon with the highest rate of food insecure children using data from Feeding America. Counties are ranked by highest percent of children with food insecurity as of 2019.
You may also like: Best counties to retire to in Oregon

Sam Beebe // Wikimedia Commons
– Child food insecurity rate: 7.7%
— Number of food insecure children: 430
– Percentage of children in households with income below 185% FPL: 100.0%
– Percentage of children in households with income above 185% FPL: 0.0%
– Overall food insecurity rate: 6.6%

M.O. Stevens // Wikimedia Commons
– Child food insecurity rate: 10.0%
— Number of food insecure children: 13,740
– Percentage of children in households with income below 185% FPL: 65.0%
– Percentage of children in households with income above 185% FPL: 35.0%
– Overall food insecurity rate: 8.4%

Mrgadget51 // Wikimedia Commons
– Child food insecurity rate: 10.4%
— Number of food insecure children: 9,300
– Percentage of children in households with income below 185% FPL: 52.0%
– Percentage of children in households with income above 185% FPL: 48.0%
– Overall food insecurity rate: 8.4%

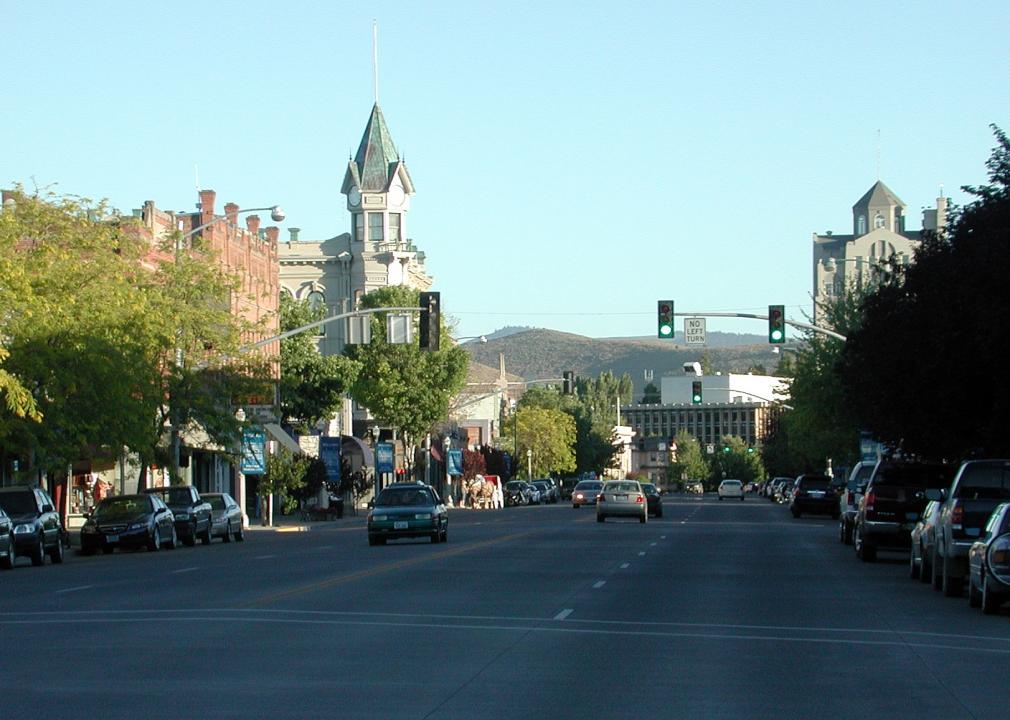
cpaulfell // Shutterstock
– Child food insecurity rate: 12.1%
— Number of food insecure children: 1,810
– Percentage of children in households with income below 185% FPL: 60.0%
– Percentage of children in households with income above 185% FPL: 40.0%
– Overall food insecurity rate: 10.8%

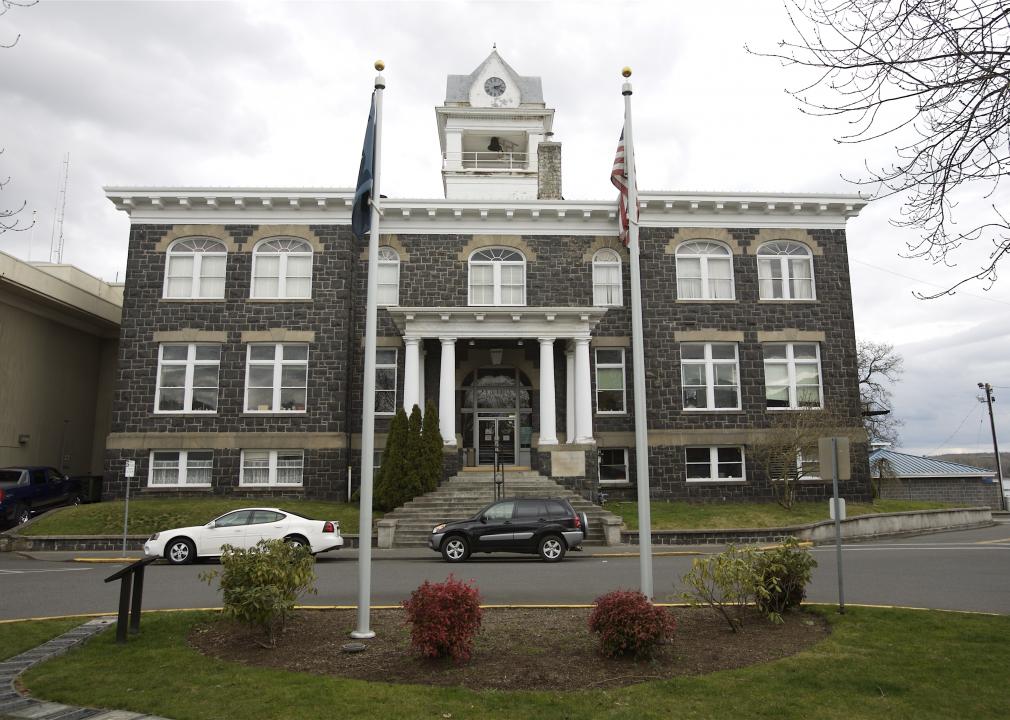
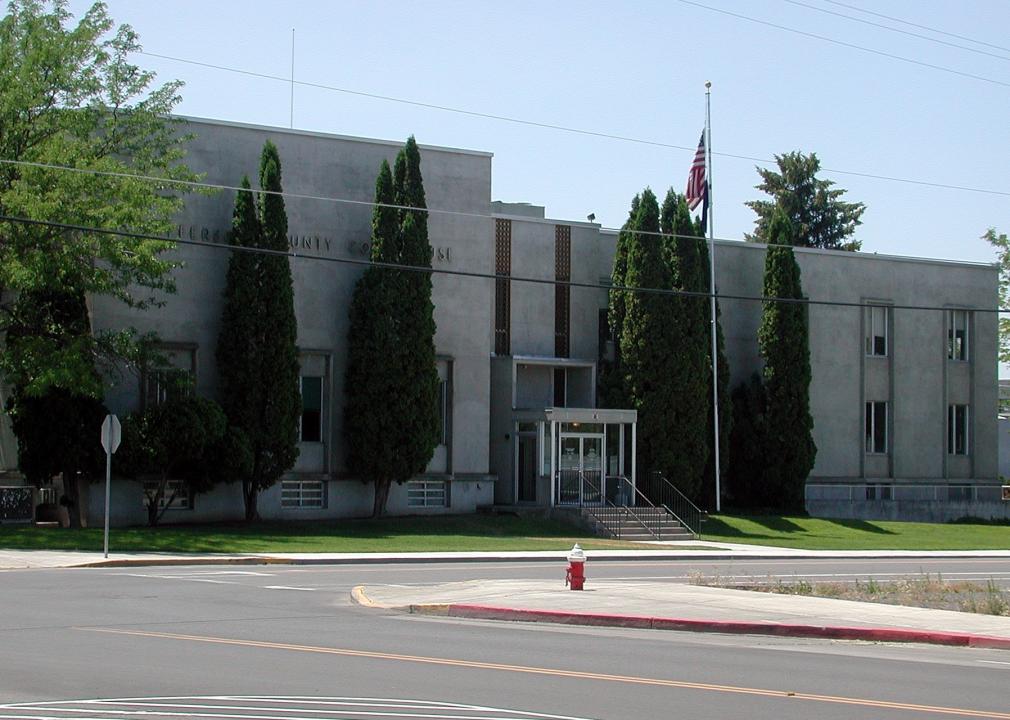
English: Gary Halvorson, Oregon State Archives // Wikimedia Commons
– Child food insecurity rate: 13.6%
— Number of food insecure children: 1,010
– Percentage of children in households with income below 185% FPL: 88.0%
– Percentage of children in households with income above 185% FPL: 12.0%
– Overall food insecurity rate: 11.8%
You may also like: Highest-earning counties in Oregon

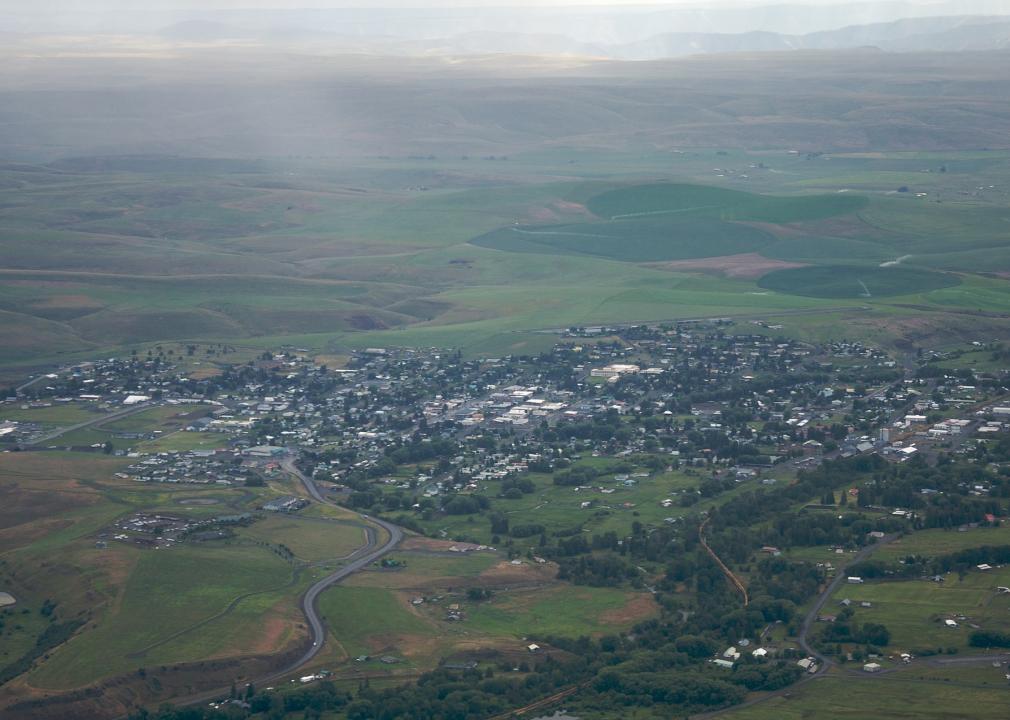
Stuart Seeger // Wikicommons
– Child food insecurity rate: 13.6%
— Number of food insecure children: 20,830
– Percentage of children in households with income below 185% FPL: 66.0%
– Percentage of children in households with income above 185% FPL: 34.0%
– Overall food insecurity rate: 11.2%

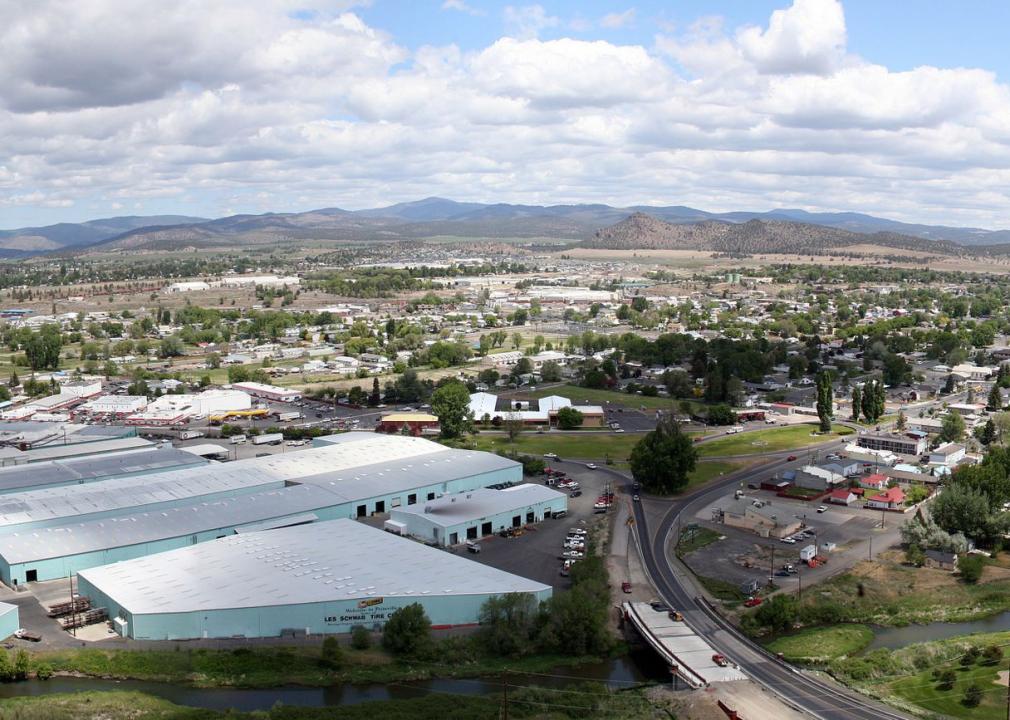
Ian Poellet // Wikimedia Commons
– Child food insecurity rate: 13.8%
— Number of food insecure children: 5,240
– Percentage of children in households with income below 185% FPL: 64.0%
– Percentage of children in households with income above 185% FPL: 36.0%
– Overall food insecurity rate: 10.2%

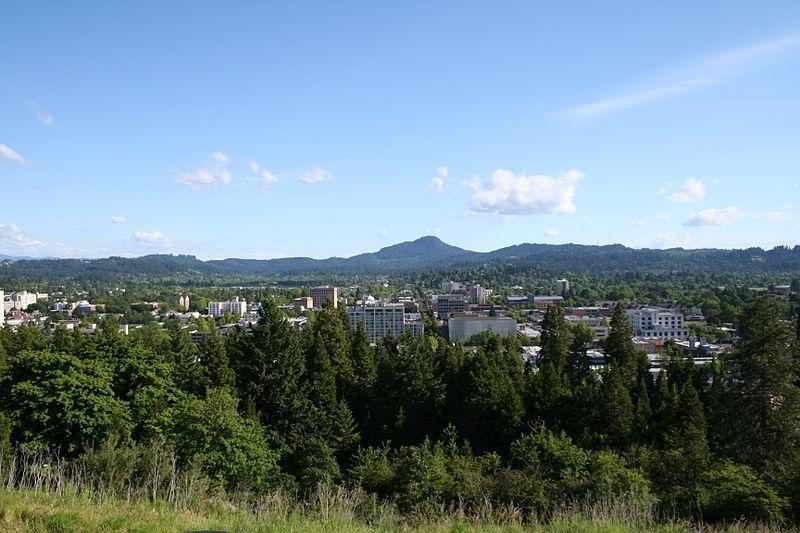
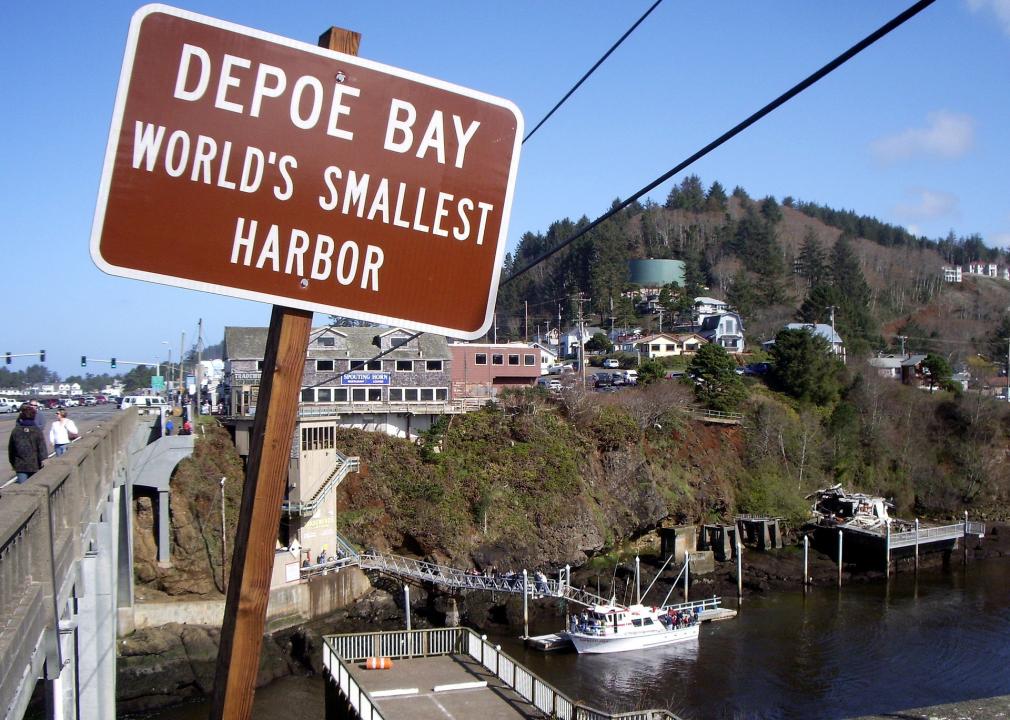
Bruce Fingerhood from Springfield, Oregon, US // Wikimedia Commons
– Child food insecurity rate: 13.9%
— Number of food insecure children: 2,630
– Percentage of children in households with income below 185% FPL: 73.0%
– Percentage of children in households with income above 185% FPL: 27.0%
– Overall food insecurity rate: 10.5%
Tedder // Wikimedia Commons
– Child food insecurity rate: 14.0%
— Number of food insecure children: 50
– Percentage of children in households with income below 185% FPL: 81.0%
– Percentage of children in households with income above 185% FPL: 19.0%
– Overall food insecurity rate: 12.1%

M.O. Stevens // Wikimedia Commons
– Child food insecurity rate: 14.3%
— Number of food insecure children: 3,360
– Percentage of children in households with income below 185% FPL: 77.0%
– Percentage of children in households with income above 185% FPL: 23.0%
– Overall food insecurity rate: 10.2%
You may also like: Highest-rated Class of 2021 football recruits from Oregon

Edmund Garman // Flickr
– Child food insecurity rate: 15.0%
— Number of food insecure children: 12,640
– Percentage of children in households with income below 185% FPL: 84.0%
– Percentage of children in households with income above 185% FPL: 16.0%
– Overall food insecurity rate: 11.2%
Cacophony // Wikimedia Commons
– Child food insecurity rate: 15.7%
— Number of food insecure children: 1,720
– Percentage of children in households with income below 185% FPL: 67.0%
– Percentage of children in households with income above 185% FPL: 33.0%
– Overall food insecurity rate: 11.4%

Cacophony // Wikimedia Commons
– Child food insecurity rate: 15.9%
— Number of food insecure children: 930
– Percentage of children in households with income below 185% FPL: 83.0%
– Percentage of children in households with income above 185% FPL: 17.0%
– Overall food insecurity rate: 11.8%

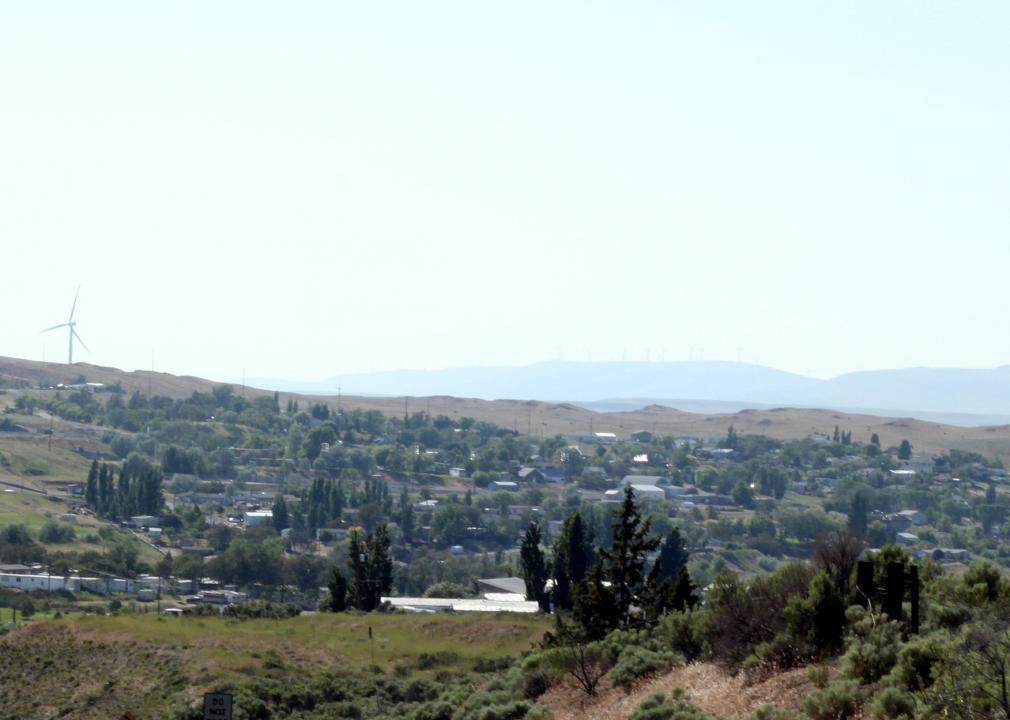
Finetooth // Wikimedia Commons
– Child food insecurity rate: 16.0%
— Number of food insecure children: 500
– Percentage of children in households with income below 185% FPL: 89.0%
– Percentage of children in households with income above 185% FPL: 11.0%
– Overall food insecurity rate: 10.2%

Jmabel // Wikimedia Commons
– Child food insecurity rate: 16.9%
— Number of food insecure children: 4,790
– Percentage of children in households with income below 185% FPL: 79.0%
– Percentage of children in households with income above 185% FPL: 21.0%
– Overall food insecurity rate: 12.7%
You may also like: Biggest sources of immigrants to Oregon

Ken Lund // Wikimedia Commons
– Child food insecurity rate: 17.4%
— Number of food insecure children: 260
– Percentage of children in households with income below 185% FPL: 68.0%
– Percentage of children in households with income above 185% FPL: 32.0%
– Overall food insecurity rate: 12.8%
Lauram12345 // Wikicommons
– Child food insecurity rate: 17.4%
— Number of food insecure children: 12,090
– Percentage of children in households with income below 185% FPL: 73.0%
– Percentage of children in households with income above 185% FPL: 27.0%
– Overall food insecurity rate: 13.6%

Williamborg // Wikimedia Commons
– Child food insecurity rate: 17.5%
— Number of food insecure children: 1,010
– Percentage of children in households with income below 185% FPL: 83.0%
– Percentage of children in households with income above 185% FPL: 18.0%
– Overall food insecurity rate: 12.5%

Little Mountain 5 // Wikicommons
– Child food insecurity rate: 17.5%
— Number of food insecure children: 7,830
– Percentage of children in households with income below 185% FPL: 78.0%
– Percentage of children in households with income above 185% FPL: 22.0%
– Overall food insecurity rate: 12.7%

Manuela Durson // Shutterstock
– Child food insecurity rate: 17.9%
— Number of food insecure children: 590
– Percentage of children in households with income below 185% FPL: 60.0%
– Percentage of children in households with income above 185% FPL: 40.0%
– Overall food insecurity rate: 13.8%
You may also like: Fastest-growing counties in Oregon

Gancayco // Wikimedia Commons
– Child food insecurity rate: 18.4%
— Number of food insecure children: 3,620
– Percentage of children in households with income below 185% FPL: 85.0%
– Percentage of children in households with income above 185% FPL: 15.0%
– Overall food insecurity rate: 12.8%

USFWS Headquarters’ photostream // Wikimedia Commons
– Child food insecurity rate: 18.5%
— Number of food insecure children: 930
– Percentage of children in households with income below 185% FPL: 92.0%
– Percentage of children in households with income above 185% FPL: 8.0%
– Overall food insecurity rate: 12.7%

Finetooth // Wikimedia Commons
– Child food insecurity rate: 18.8%
— Number of food insecure children: 50
– Percentage of children in households with income below 185% FPL: 78.0%
– Percentage of children in households with income above 185% FPL: 22.0%
– Overall food insecurity rate: 13.4%
Finetooth // Wikimedia Commons
– Child food insecurity rate: 19.1%
— Number of food insecure children: 600
– Percentage of children in households with income below 185% FPL: 76.0%
– Percentage of children in households with income above 185% FPL: 24.0%
– Overall food insecurity rate: 13.1%

Ken Lund from Reno, Nevada, USA // Wikimedia Commons
– Child food insecurity rate: 19.1%
— Number of food insecure children: 1,480
– Percentage of children in households with income below 185% FPL: 92.0%
– Percentage of children in households with income above 185% FPL: 8.0%
– Overall food insecurity rate: 13.9%
You may also like: Counties with the oldest homes in Oregon
Finetooth // Wikimedia Commons
– Child food insecurity rate: 19.2%
— Number of food insecure children: 1,070
– Percentage of children in households with income below 185% FPL: 80.0%
– Percentage of children in households with income above 185% FPL: 20.0%
– Overall food insecurity rate: 13.8%
Sam Beebe // Wikimedia Commons
– Child food insecurity rate: 20.1%
— Number of food insecure children: 260
– Percentage of children in households with income below 185% FPL: 69.0%
– Percentage of children in households with income above 185% FPL: 31.0%
– Overall food insecurity rate: 13.7%

Tomas Nevesely // Shutterstock
– Child food insecurity rate: 20.3%
— Number of food insecure children: 50
– Percentage of children in households with income below 185% FPL: 98.0%
– Percentage of children in households with income above 185% FPL: 2.0%
– Overall food insecurity rate: 13.6%

English: Gary Halvorson, Oregon State Archives // Wikimedia Commons
– Child food insecurity rate: 20.8%
— Number of food insecure children: 4,410
– Percentage of children in households with income below 185% FPL: 81.0%
– Percentage of children in households with income above 185% FPL: 20.0%
– Overall food insecurity rate: 14.0%
Cacophony // Wikimedia Commons
– Child food insecurity rate: 20.9%
— Number of food insecure children: 950
– Percentage of children in households with income below 185% FPL: 80.0%
– Percentage of children in households with income above 185% FPL: 20.0%
– Overall food insecurity rate: 13.1%
You may also like: Highest-rated things to do in Oregon, according to Tripadvisor
EncMstr // Wikimedia Commons
– Child food insecurity rate: 21.1%
— Number of food insecure children: 1,730
– Percentage of children in households with income below 185% FPL: 89.0%
– Percentage of children in households with income above 185% FPL: 11.0%
– Overall food insecurity rate: 14.4%
Ken Lund // Wikimedia Commons
– Child food insecurity rate: 21.5%
— Number of food insecure children: 320
– Percentage of children in households with income below 185% FPL: 83.0%
– Percentage of children in households with income above 185% FPL: 17.0%
– Overall food insecurity rate: 15.7%

Joseph Novak // Wikicommons
– Child food insecurity rate: 21.5%
— Number of food insecure children: 3,640
– Percentage of children in households with income below 185% FPL: 83.0%
– Percentage of children in households with income above 185% FPL: 17.0%
– Overall food insecurity rate: 15.0%

Debbie Tegtmeier // Wikimedia Commons
– Child food insecurity rate: 21.9%
— Number of food insecure children: 2,580
– Percentage of children in households with income below 185% FPL: 77.0%
– Percentage of children in households with income above 185% FPL: 23.0%
– Overall food insecurity rate: 15.2%

Bobjgalindo // Wikimedia Commons
– Child food insecurity rate: 22.1%
— Number of food insecure children: 3,210
– Percentage of children in households with income below 185% FPL: 87.0%
– Percentage of children in households with income above 185% FPL: 13.0%
– Overall food insecurity rate: 15.4%
You may also like: States sending the most people to Oregon

Finetooth // Wikimedia Commons
– Child food insecurity rate: 23.8%
— Number of food insecure children: 310
– Percentage of children in households with income below 185% FPL: 83.0%
– Percentage of children in households with income above 185% FPL: 17.0%
– Overall food insecurity rate: 16.6%
