AAA: Oregon gas prices stay ‘calm,’ though Bend’s edged upward last week
PORTLAND, Ore., (KTVZ) -– It's been another calm week for gas prices across the country, with 45 states seeing pump prices change by a nickel or less, AAA Oregon/Idaho reported Tuesday.
Higher crude oil prices have kept the national average for regular gas from falling, while prices in Oregon and other West Coast states continue to inch down. The national and Oregon averages remain at their lowest prices in nearly five years.
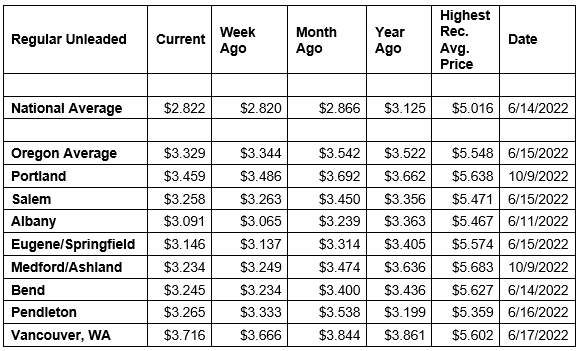
The national average is at its cheapest price since March 2021 and the Oregon average is at its lowest price since May 2021. For the week, the national average for regular gas remains at $2.82 a gallon. The Oregon average slips two cents to $3.33 a gallon, while Bend's edged upward about a penny, to $3.24 a gallon. Some spots in the Willamette Valley also saw gas prices rise a small amount.
"We’re seeing small increases in a number of markets this week, but not enough to send the Oregon average higher, at least not yet," Marie Dodds, public affairs director for AAA Oregon/Idaho, told KTVZ News.
Here's the breakdown and the rest of AAA's news release:
“Crude oil prices are around $60 per barrel after spending several weeks in the mid-$50s and that’s putting upward pressure on gas prices ahead of the usual seasonal increases. For now, gas prices in Oregon and most other West Coast states continue to tick lower. However, we only have a few weeks before California begins the process to switch to summer-blend fuel, which kicks off the seasonal increases in pump prices,” says Dodds.
The Oregon average for regular gas began 2026 at $3.42 a gallon, which is the highest price of the year so far. The lowest price of the year so far is today’s price of $3.33.
The national average began 2026 at $2.83 a gallon, which is the highest price of the year so far. The lowest price of the year so far is $2.795 on January 11.
The average price for the national average for regular gas in 2025 was $3.11 per gallon. The average price of the Oregon average for the year was $3.87.
Demand for gasoline in the U.S. gasoline increased from 8.17 million b/d to 8.30 million b/d for the week ending January 9. This compares to 8.33 million b/d a year ago. Total domestic supply of gasoline increased from 242 million barrels to 251 million. Gasoline production increased last week, averaging 9.03 million barrels per day compared to 9.0 million barrels the previous week.
Gas prices typically rise starting in mid-to-late winter and early spring as refineries undergo maintenance ahead of the switch to summer-blend fuel, which is more expensive to produce and less likely to evaporate in warmer temperatures. The switch occurs first in California, which is why pump prices on the West Coast often rise before other parts of the country. The East Coast is the last major market to switch to summer-blend fuel. Most areas have a May 1 compliance date for refiners and terminals, while most gas stations have a June 1 deadline to switch to selling summer-blend. Switch-over dates are earlier in California with some areas in the state requiring summer-blend fuel by April 1. Some refineries will begin maintenance and the switchover in February.
Gas prices usually drop in the fall, due to the switch from summer-blend to winter-blend fuel, which costs less to produce. The switch starts in September. Many areas, including Oregon, can sell winter-blend fuel starting September 15. However, Northern and Southern California require summer-blend fuel through October 31. Prices usually decline to their lowest levels of the year in late fall and early winter before increasing again in the late winter and early spring.
The U.S. price of crude oil (West Texas Intermediate) has mostly been in the upper $50s to mid-$70s since September 2024.
WTI is trading at $60 today, compared to $61 a week ago and $76 a year ago. In 2025, West Texas Intermediate ranged between $80.04 (January 15) and $57.46 (October 16) per barrel. In 2024, WTI ranged between $66 and $87 per barrel. In 2023, WTI ranged between $63 and $95 per barrel. WTI reached recent highs of $123.70 on March 8, 2022, shortly after the Russian invasion of Ukraine, and $122.11 per barrel on June 8, 2022. The all-time high for WTI crude oil is $147.27 in July 2008.
Crude prices are impacted by economic news as well as geopolitical events around the world including the current economic uncertainty, the current situation in Venezuela, tensions over Greenland, protests in Iran, unrest in the Middle East, the conflict between Israel and Hamas, and the war between Russia and Ukraine. Russia is a top global oil producer, behind the U.S. and Saudi Arabia. Crude prices were volatile after the attack on Israel by Hamas in October 2023. While Israel and the Palestinian territory are not oil producers, there were concerns that the conflict could spread in the Middle East, which could potentially impact crude production in other oil-producing nations in the region. Crude oil prices declined after October’s fragile peace agreement between Israel and Hamas. In addition, production cuts by OPEC+ in previous years tightened global crude oil supplies, which continued to impact prices. But in 2025, the cartel boosted production which put downward pressure on crude oil prices. For 2026, OPEC+ says it’s not planning any production hikes in the first quarter of the year due to lower demand.
Crude oil is the main ingredient in gasoline and diesel, so pump prices are impacted by crude prices on the global markets. On average, about 47% of what we pay for in a gallon of gasoline is for the price of crude oil, 16% is refining, 20% distribution and marketing, and 17% are taxes, according to the U.S. Energy Information Administration.
Meanwhile, crude oil production in the U.S. remains at or near record highs. The U.S. Energy Information Administration (EIA) reports that crude production in his country is at 13.76 million barrels per day for the week ending January 9. Production has been at 13.5 million barrels per day many times since October 2024. The U.S. has been the top producer of crude oil in the world since 2018 and has been increasing its oil production since about 2009.
Quick stats
Oregon is one of 27 states and the District of Columbia with lower prices now than a week ago. Ohio (-8 cents) has the largest week-over-week decrease in the nation. Colorado (+10 cents) has the biggest week-over-week increase in the country.
Hawaii ($4.41) has the most expensive gas in the nation for the sixth week in a row. California ($4.20) is second. These are the only states with averages at or above $4 a gallon. This week five states and the District of Columbia have averages in the $3-range. There are 43 states with an average in the $2 range this week.
The cheapest gas in the nation is in Oklahoma ($2.31) and Arkansas ($2.43) and. No state has had an average below $2 a gallon since January 7, 2021, when Mississippi and Texas were below that threshold. At the time, the COVID-19 pandemic drove significant declines in crude oil and gasoline demand in the U.S. and around the world.
The difference between the most expensive and least expensive states is $2.10 this week, compared to $2.19 a week ago.
Oregon is one of 40 states and the District of Columbia with lower prices now than a month ago. The national average is four cents less and the Oregon average is 21 cents less than a month ago. Oregon has the largest month-over-month decline in the nation. Michigan (+19 cents) has the largest month-over-month increase.
Oregon is one of 49 states and the District of Columbia with lower prices now than a year ago. The national average is 30 cents less, while the Oregon average is 19 cents less. Wisconsin (-46 cents) has the largest year-over-year drop in the nation. Alaska (+15 cents) is the only state with a year-over-year increase.
West Coast
The West Coast region continues to have the most expensive pump prices in the nation with six of the seven states in the top 10. It’s typical for the West Coast to have six or seven states in the top 10 as this region tends to consistently have fairly tight supplies, consuming about as much gasoline as is produced. In addition, this region is located relatively far from parts of the country where oil drilling, production and refining occurs, so transportation costs are higher. And environmental programs in this region add to the cost of production, storage and distribution.
| Rank | Region | Price on 1/20/2026 |
| 1 | Hawaii | $4.41 |
| 2 | California | $4.20 |
| 3 | Washington | $3.81 |
| 4 | Alaska | $3.45 |
| 5 | Nevada | $3.36 |
| 6 | Oregon | $3.33 |
| 7 | District of Columbia | $3.10 |
| 8 | Pennsylvania | $3.03 |
| 9 | Vermont | $2.99 |
| 10 | New York | $2.98 |
As mentioned above, Hawaii has the most expensive gas in the country for the sixth consecutive week. California, Washington, Alaska, Nevada, and Oregon round out the top six. Arizona is 11th. Oregon is sixth for the second week in a row.
Five of the seven states in the West Coast region have week-over-week decreases: Alaska (-4 cents), Oregon (-2 cents), Hawaii (-1 cent), California (-1 cent), and Arizona (-1 cent). Washington (+2 cents) and Nevada (+1 cent) have small week-over-week increases.
The refinery utilization rate on the West Coast climbed from 80.0% to 84.4% for the week ending January 9. This rate has ranged between about 70% to 93% in the last year. The latest national refinery utilization rate rose from 94.7% to 95.3%.
The refinery utilization rate measures how much crude oil refineries are processing as a percentage of their maximum capacity. A low or declining rate can put upward pressure on pump prices, while a high or rising rate can put downward pressure on pump prices.
According to EIA’s latest weekly report, total gas stocks in the region increased from 31.35 million bbl. to 31.60 million bbl. for the week ending January 9. An increase in gasoline stocks can put downward pressure on pump prices, while a decrease in gasoline stocks can put upward pressure on pump prices.
Oil market dynamics
Crude oil prices are again above $60 this week as investors weigh the Greenland situation and President Trump’s threats of tariffs on European nations, unrest in Iran, he impacts from the U.S. action in Venezuela and how it might impact that country’s large oil reserves, and the ongoing war between Russia and Ukraine.
Meanwhile, the EIA reports that crude oil inventories decreased by 3.8 million barrels from the previous week. At 419.1 million barrels, U.S. crude oil inventories are about 3% below the five-year average for this time of year.
At the close of Friday’s formal trading session, WTI gained 25 cents to close at $59.44. U.S. markets were closed Monday in observance of Martin Luther King, Jr. Day. Today crude is trading around $60, compared to $61 a week ago. Crude prices are about $16 less than a year ago. ($75.89 on January 21, 2025)
Drivers can find current gas prices along their route with the free AAA Mobile app for iPhone, iPad and Android. The app can also be used to map a route, find discounts, book a hotel and access AAA roadside assistance. Learn more at AAA.com/mobile.
