Counties with the worst commutes in Oregon
Cacophony // Wikimedia Commons
Counties with the worst commutes in Oregon
Commuting easily ranks as one of the least enjoyable parts of a person’s day. Commuters encounter more physical health problems, and low-income commuters are less likely to gain financial stability—among a host of other negative impacts. And yet, America’s commutes keep getting longer as people move farther away from the office, according to census data.
Stacker compiled a list of counties with the worst commutes in Oregon using data from the U.S. Census Bureau. Counties are ranked by longest average commute time in 2019. Think you have a long trip to work? Read on to compare it against the worst commutes statewide.
You may also like: Highest-rated Class of 2021 football recruits from Oregon
![]()
Bobjgalindo // Wikimedia Commons
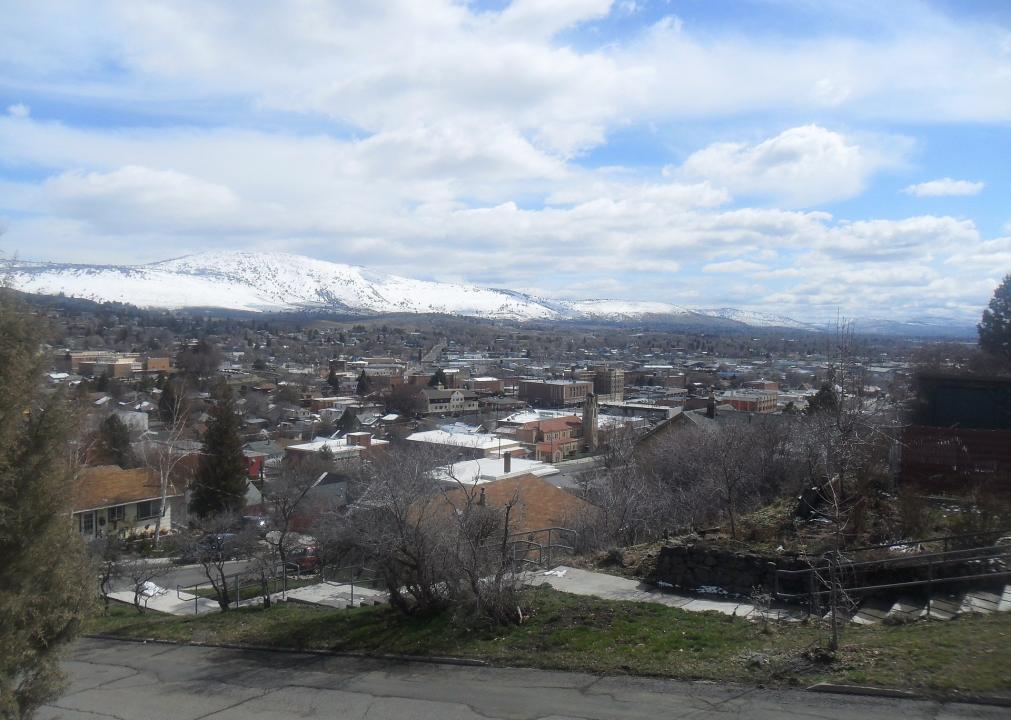
#30. Klamath County
– Average commute time: 16 minutes
— #2,889 longest among all counties nationwide
— 33.1% shorter than state average
— 42.0% shorter than national average
– Workers with 90+ minute commute: 0.7%
– Left for work from 12 a.m. to 6 a.m.: 16.7%
– Worked outside county of residence: 3.1%
– Means of transportation: drove alone (81.8%), carpooled (8.7%), walked (2.1%), public transportation (0.6%), worked from home (5.5%)
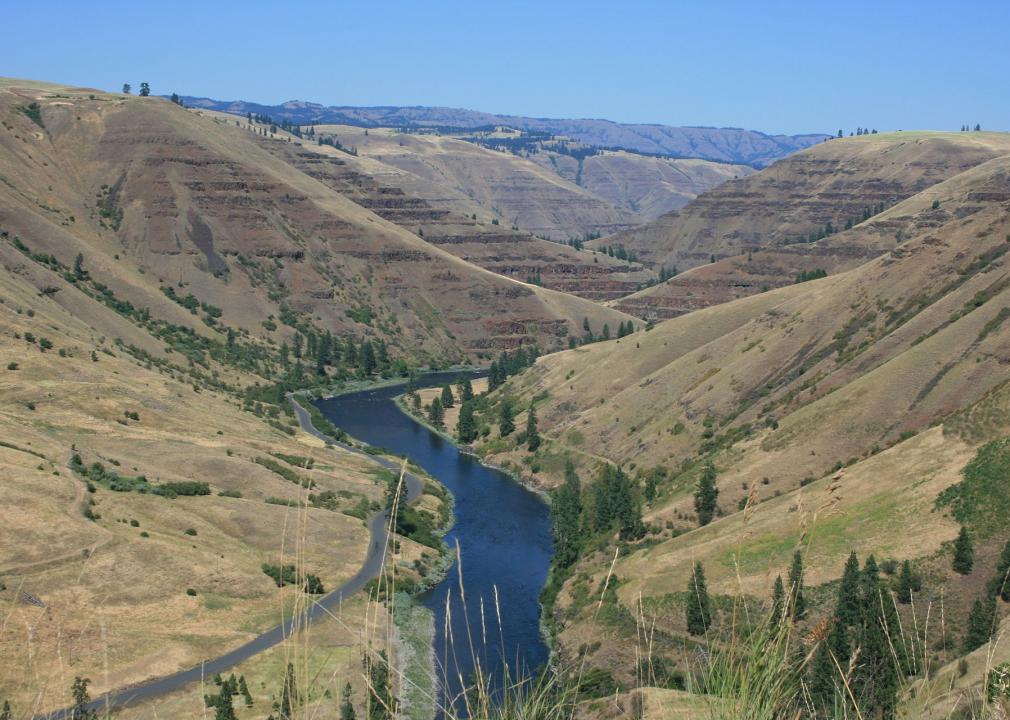
Sam Beebe // Wikimedia Commons
#29. Wallowa County
– Average commute time: 16.3 minutes
— #2,860 longest among all counties nationwide
— 31.8% shorter than state average
— 40.9% shorter than national average
– Workers with 90+ minute commute: 2.9%
– Left for work from 12 a.m. to 6 a.m.: 12.1%
– Worked outside county of residence: 3.7%
– Means of transportation: drove alone (71.3%), carpooled (8%), walked (9.1%), public transportation (0%), worked from home (10.6%)
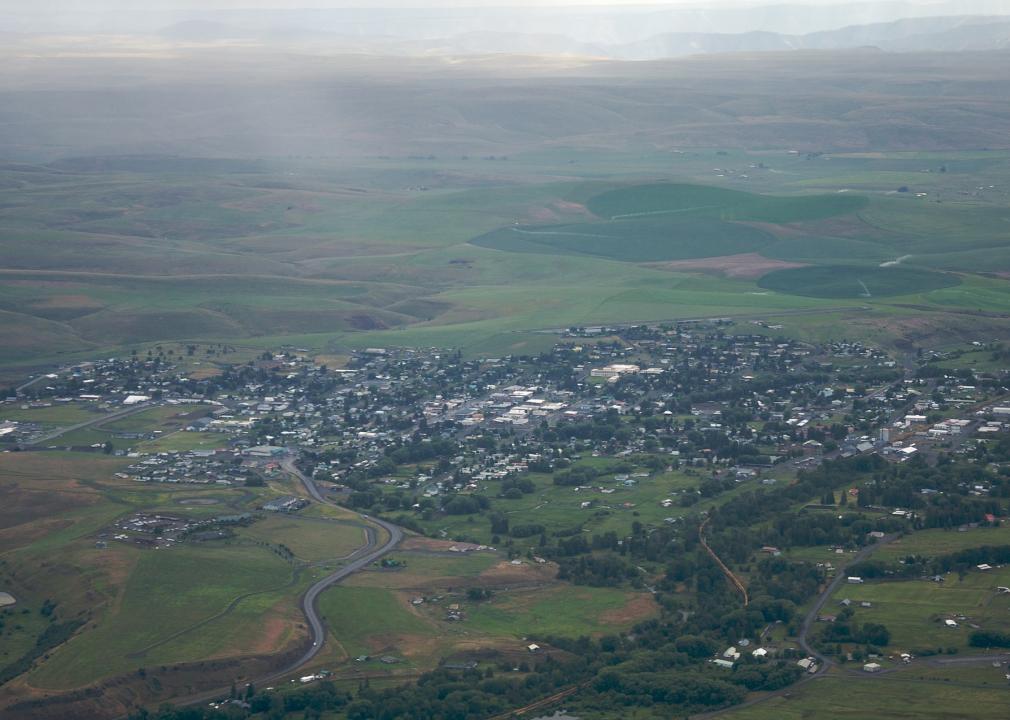
Williamborg // Wikimedia Commons
#28. Union County
– Average commute time: 17.1 minutes
— #2,766 longest among all counties nationwide
— 28.5% shorter than state average
— 38.0% shorter than national average
– Workers with 90+ minute commute: 2.1%
– Left for work from 12 a.m. to 6 a.m.: 21.3%
– Worked outside county of residence: 4.6%
– Means of transportation: drove alone (75.9%), carpooled (9.8%), walked (6.4%), public transportation (0.3%), worked from home (6.1%)
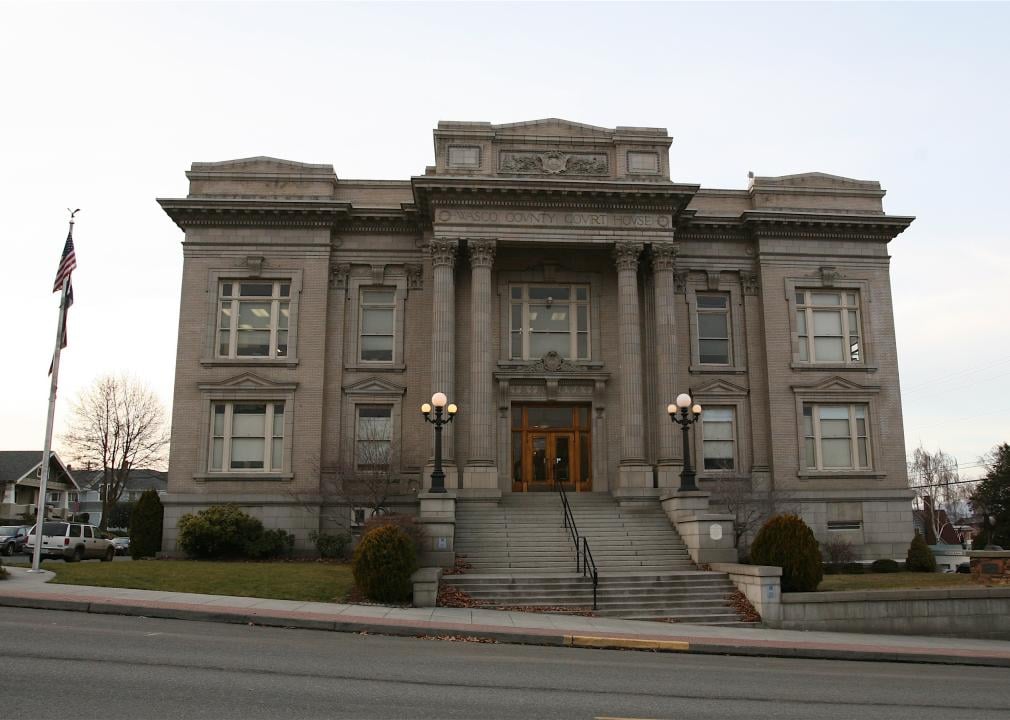
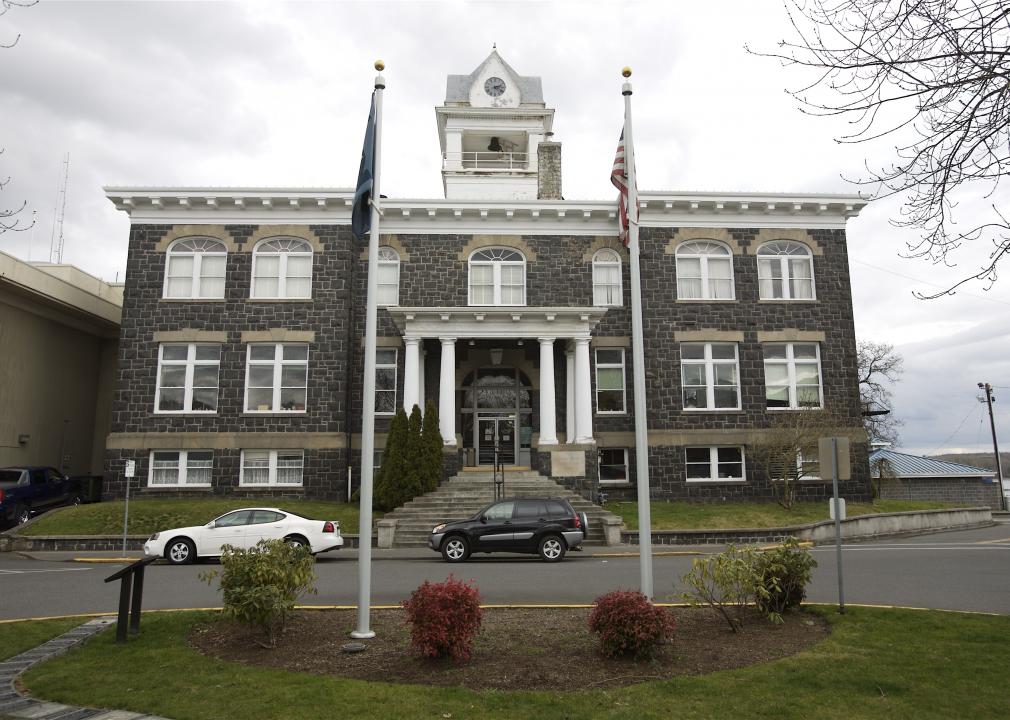
Cacophony // Wikimedia Commons
#27. Wasco County
– Average commute time: 18.2 minutes
— #2,626 longest among all counties nationwide
— 23.8% shorter than state average
— 34.1% shorter than national average
– Workers with 90+ minute commute: 1.5%
– Left for work from 12 a.m. to 6 a.m.: 17.8%
– Worked outside county of residence: 17.9%
– Means of transportation: drove alone (76.3%), carpooled (10%), walked (4.5%), public transportation (0.3%), worked from home (7.5%)
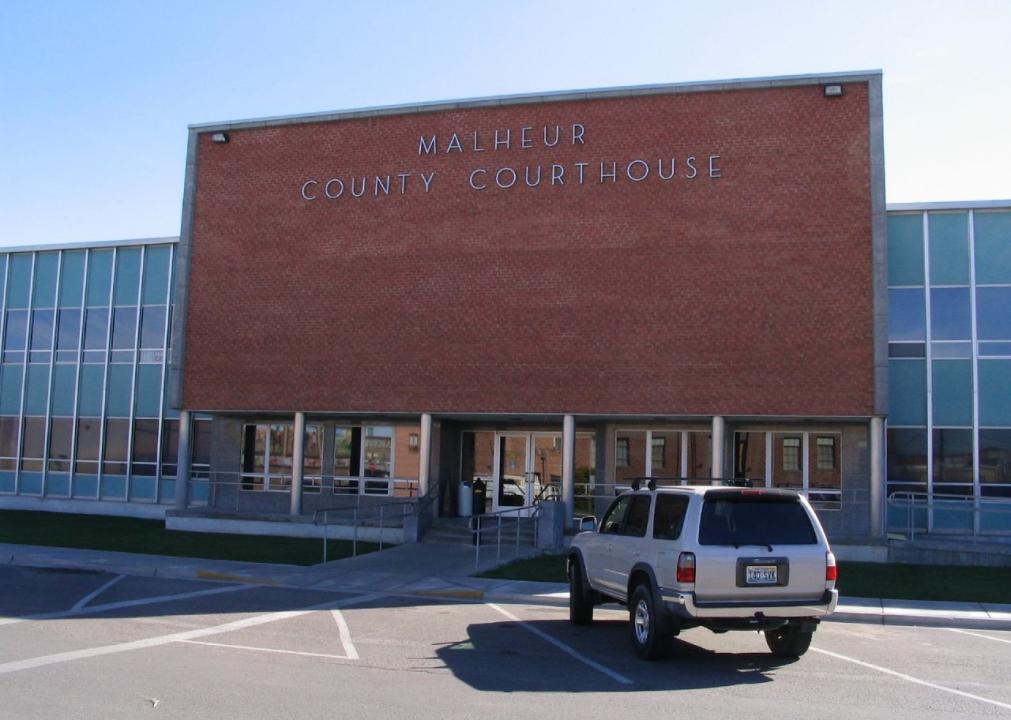
Ken L. from Reno, Nevada, USA // Wikimedia Commons
#26. Malheur County
– Average commute time: 18.5 minutes
— #2,574 longest among all counties nationwide
— 22.6% shorter than state average
— 33.0% shorter than national average
– Workers with 90+ minute commute: 2.4%
– Left for work from 12 a.m. to 6 a.m.: 10.9%
– Worked outside county of residence: 0.9%
– Means of transportation: drove alone (78.2%), carpooled (8.7%), walked (5.7%), public transportation (0.2%), worked from home (5.8%)
You may also like: Counties with the most college graduates in Oregon

Gancayco // Wikimedia Commons
#25. Umatilla County
– Average commute time: 18.7 minutes
— #2,548 longest among all counties nationwide
— 21.8% shorter than state average
— 32.2% shorter than national average
– Workers with 90+ minute commute: 1.2%
– Left for work from 12 a.m. to 6 a.m.: 20.7%
– Worked outside county of residence: 8.6%
– Means of transportation: drove alone (82.3%), carpooled (11%), walked (2.2%), public transportation (0.5%), worked from home (2.9%)

EncMstr // Wikimedia Commons
#24. Lincoln County
– Average commute time: 18.8 minutes
— #2,532 longest among all counties nationwide
— 21.3% shorter than state average
— 31.9% shorter than national average
– Workers with 90+ minute commute: 1.8%
– Left for work from 12 a.m. to 6 a.m.: 11.6%
– Worked outside county of residence: 4.1%
– Means of transportation: drove alone (72.6%), carpooled (13.3%), walked (4.3%), public transportation (1.1%), worked from home (6.7%)
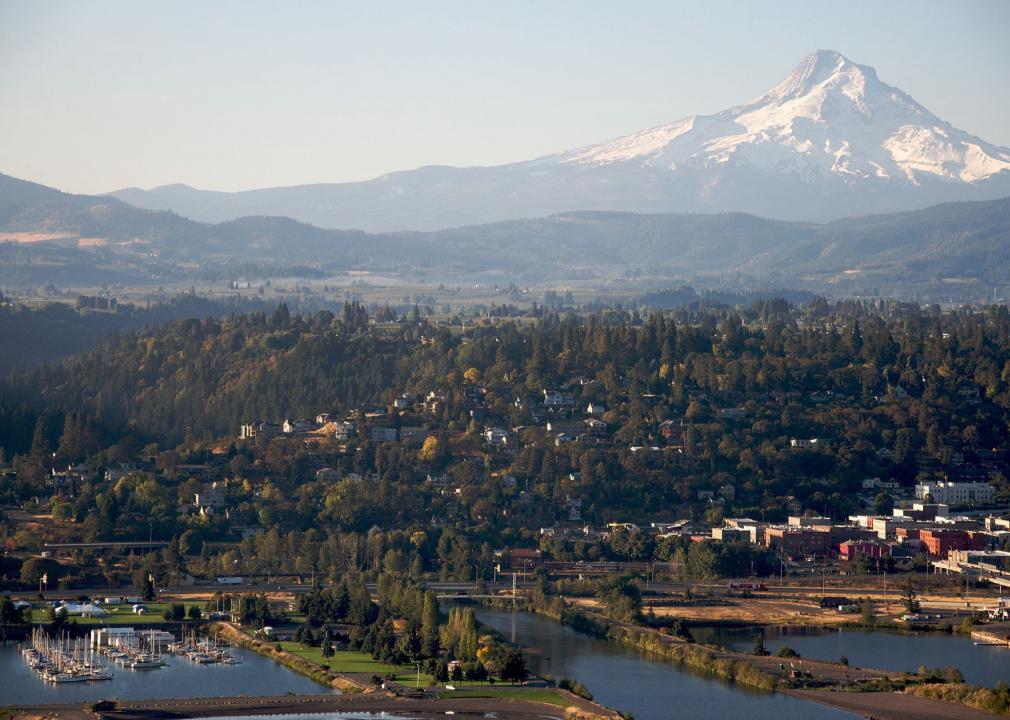
Sam Beebe // Wikimedia Commons
#23. Hood River County
– Average commute time: 18.8 minutes
— #2,532 longest among all counties nationwide
— 21.3% shorter than state average
— 31.9% shorter than national average
– Workers with 90+ minute commute: 2.1%
– Left for work from 12 a.m. to 6 a.m.: 16.2%
– Worked outside county of residence: 9.7%
– Means of transportation: drove alone (68.1%), carpooled (12.2%), walked (7.8%), public transportation (0.3%), worked from home (9.4%)
Little Mountain 5 // Wikicommons
#22. Jackson County
– Average commute time: 18.9 minutes
— #2,515 longest among all counties nationwide
— 20.9% shorter than state average
— 31.5% shorter than national average
– Workers with 90+ minute commute: 1.2%
– Left for work from 12 a.m. to 6 a.m.: 13.0%
– Worked outside county of residence: 4.1%
– Means of transportation: drove alone (76.4%), carpooled (9.7%), walked (2.8%), public transportation (1%), worked from home (8%)

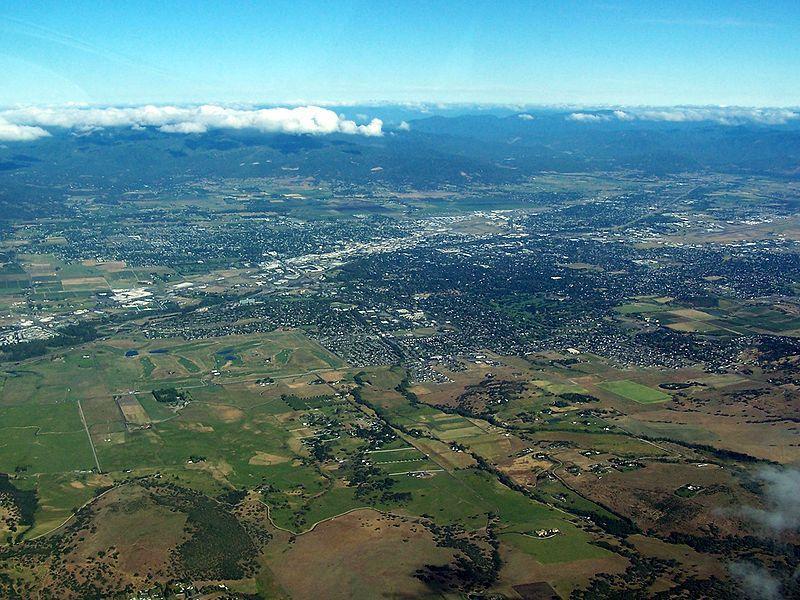
Joseph Novak // Wikicommons
#21. Josephine County
– Average commute time: 19 minutes
— #2,492 longest among all counties nationwide
— 20.5% shorter than state average
— 31.2% shorter than national average
– Workers with 90+ minute commute: 1.5%
– Left for work from 12 a.m. to 6 a.m.: 15.3%
– Worked outside county of residence: 12.6%
– Means of transportation: drove alone (78.8%), carpooled (8.9%), walked (3.5%), public transportation (0.3%), worked from home (5.8%)
You may also like: Most popular girl names in the 60s in Oregon
Debbie Tegtmeier // Wikimedia Commons
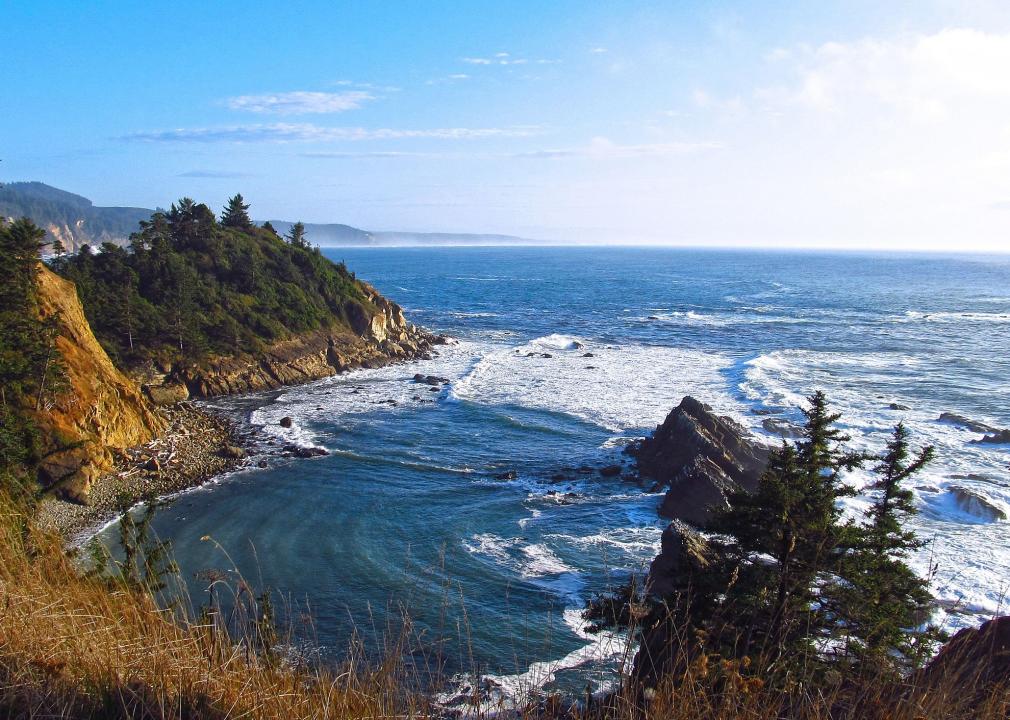
#20. Coos County
– Average commute time: 19.1 minutes
— #2,479 longest among all counties nationwide
— 20.1% shorter than state average
— 30.8% shorter than national average
– Workers with 90+ minute commute: 2.6%
– Left for work from 12 a.m. to 6 a.m.: 17.4%
– Worked outside county of residence: 3.6%
– Means of transportation: drove alone (77.4%), carpooled (9.8%), walked (3.5%), public transportation (0.5%), worked from home (6.5%)

English: Gary Halvorson, Oregon State Archives // Wikimedia Commons
#19. Douglas County
– Average commute time: 19.2 minutes
— #2,458 longest among all counties nationwide
— 19.7% shorter than state average
— 30.4% shorter than national average
– Workers with 90+ minute commute: 2.0%
– Left for work from 12 a.m. to 6 a.m.: 18.3%
– Worked outside county of residence: 6.2%
– Means of transportation: drove alone (79.1%), carpooled (11.3%), walked (2.6%), public transportation (0.3%), worked from home (5.6%)
Ian Poellet // Wikimedia Commons
#18. Deschutes County
– Average commute time: 19.5 minutes
— #2,405 longest among all counties nationwide
— 18.4% shorter than state average
— 29.3% shorter than national average
– Workers with 90+ minute commute: 1.6%
– Left for work from 12 a.m. to 6 a.m.: 11.2%
– Worked outside county of residence: 4.1%
– Means of transportation: drove alone (74.4%), carpooled (9.3%), walked (2.1%), public transportation (0.3%), worked from home (11.2%)
cpaulfell // Shutterstock
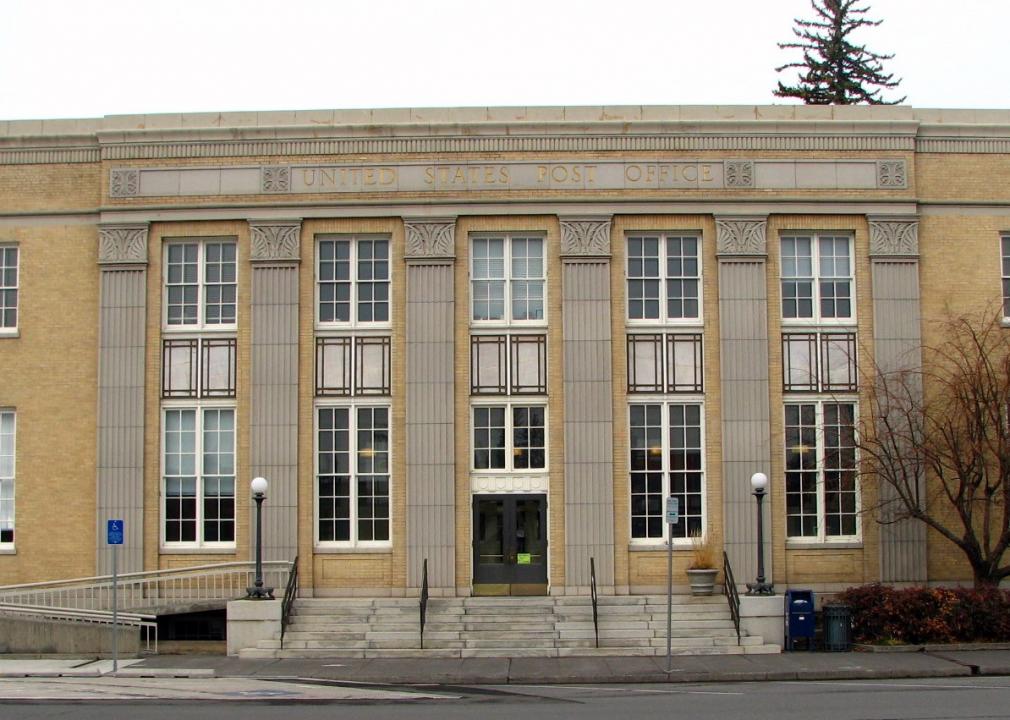
#17. Benton County
– Average commute time: 19.6 minutes
— #2,383 longest among all counties nationwide
— 18.0% shorter than state average
— 29.0% shorter than national average
– Workers with 90+ minute commute: 1.7%
– Left for work from 12 a.m. to 6 a.m.: 7.8%
– Worked outside county of residence: 21.1%
– Means of transportation: drove alone (66.5%), carpooled (7.8%), walked (7.9%), public transportation (2.5%), worked from home (6.3%)

USFWS Headquarters’ photostream // Wikimedia Commons
#16. Tillamook County
– Average commute time: 19.9 minutes
— #2,331 longest among all counties nationwide
— 16.7% shorter than state average
— 27.9% shorter than national average
– Workers with 90+ minute commute: 2.7%
– Left for work from 12 a.m. to 6 a.m.: 20.2%
– Worked outside county of residence: 10%
– Means of transportation: drove alone (76.7%), carpooled (10%), walked (5.2%), public transportation (0.8%), worked from home (5.6%)
You may also like: Biggest sources of immigrants to Oregon
Finetooth // Wikimedia Commons
#15. Morrow County
– Average commute time: 20.1 minutes
— #2,298 longest among all counties nationwide
— 15.9% shorter than state average
— 27.2% shorter than national average
– Workers with 90+ minute commute: 1.4%
– Left for work from 12 a.m. to 6 a.m.: 26.1%
– Worked outside county of residence: 25%
– Means of transportation: drove alone (78.4%), carpooled (13.9%), walked (2.2%), public transportation (0.1%), worked from home (5%)

English: Gary Halvorson, Oregon State Archives // Wikimedia Commons
#14. Clatsop County
– Average commute time: 20.3 minutes
— #2,268 longest among all counties nationwide
— 15.1% shorter than state average
— 26.4% shorter than national average
– Workers with 90+ minute commute: 3.4%
– Left for work from 12 a.m. to 6 a.m.: 10.9%
– Worked outside county of residence: 4.6%
– Means of transportation: drove alone (72.7%), carpooled (10.5%), walked (8.1%), public transportation (1.1%), worked from home (4.5%)
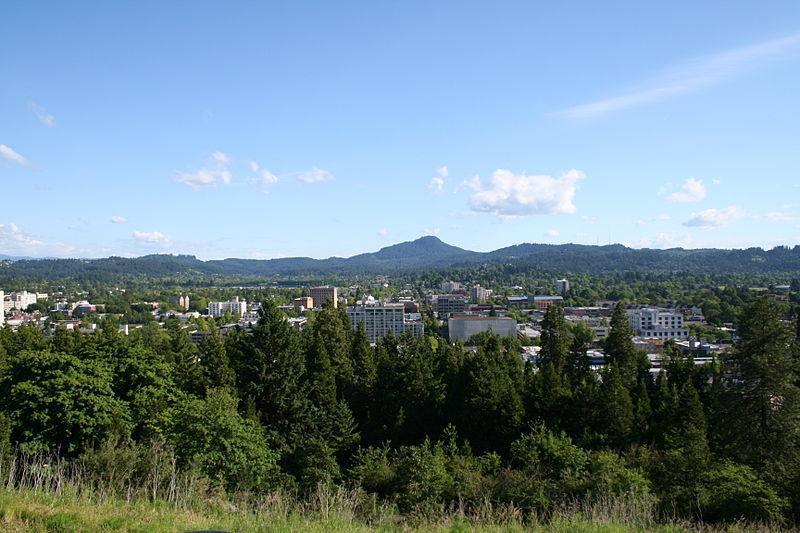
Lauram12345 // Wikicommons
#13. Lane County
– Average commute time: 20.4 minutes
— #2,246 longest among all counties nationwide
— 14.6% shorter than state average
— 26.1% shorter than national average
– Workers with 90+ minute commute: 2.0%
– Left for work from 12 a.m. to 6 a.m.: 12.2%
– Worked outside county of residence: 3.6%
– Means of transportation: drove alone (70.8%), carpooled (11%), walked (4.7%), public transportation (2.9%), worked from home (6.1%)
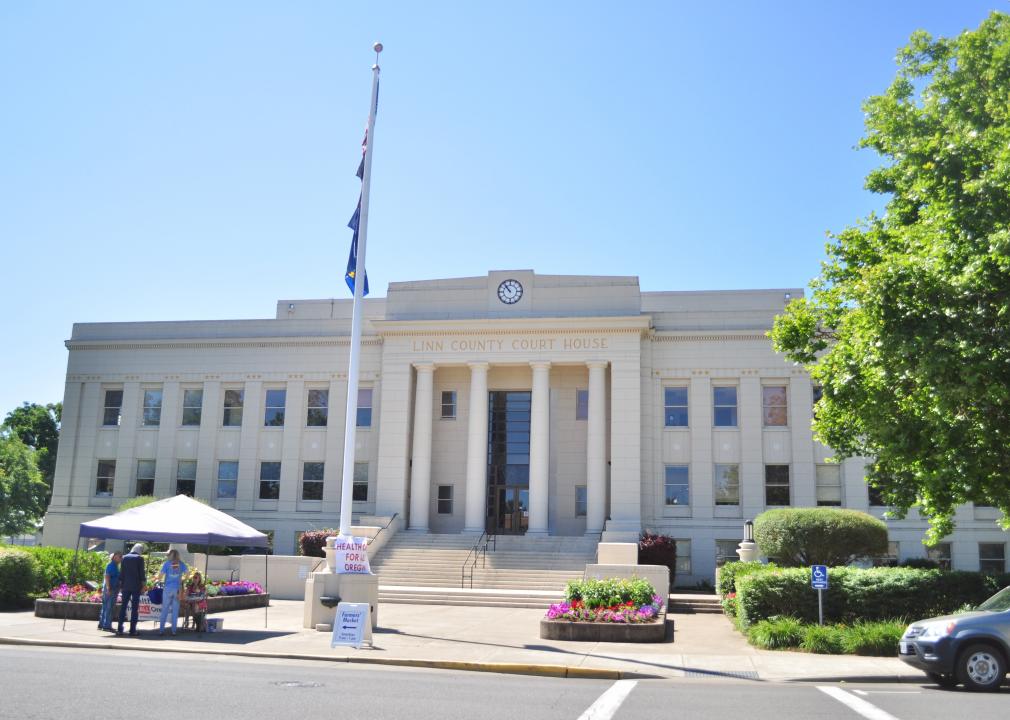
Jmabel // Wikimedia Commons
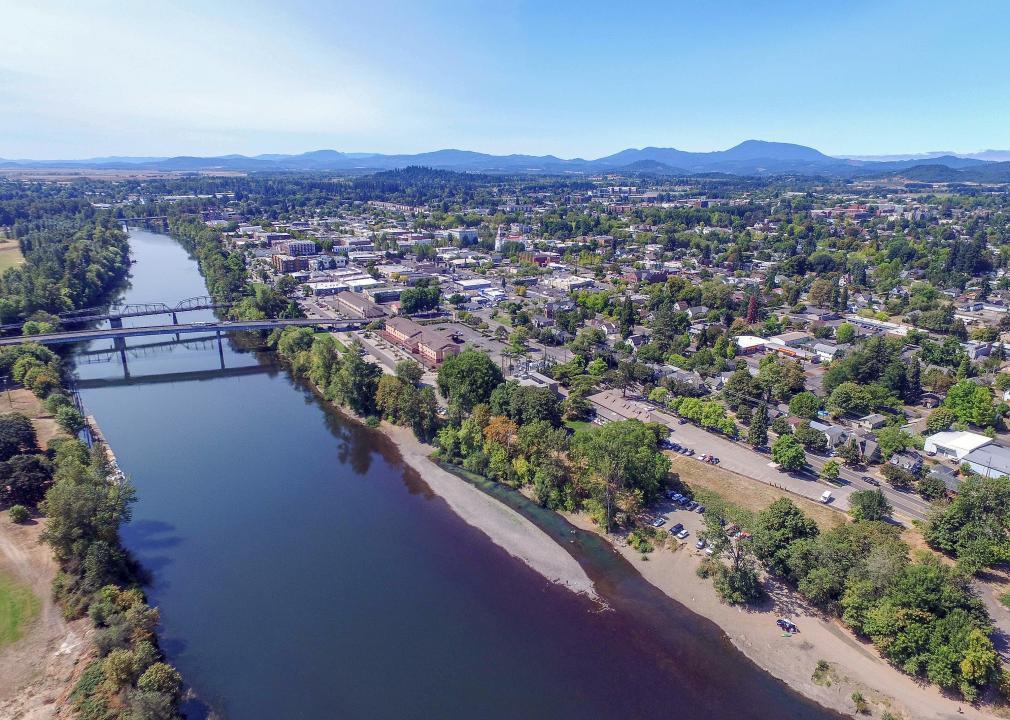
#12. Linn County
– Average commute time: 22.8 minutes
— #1,758 longest among all counties nationwide
— 4.6% shorter than state average
— 17.4% shorter than national average
– Workers with 90+ minute commute: 2.3%
– Left for work from 12 a.m. to 6 a.m.: 20.6%
– Worked outside county of residence: 33.3%
– Means of transportation: drove alone (79.3%), carpooled (11.2%), walked (2.2%), public transportation (0.2%), worked from home (5%)

Tomas Nevesely // Shutterstock
#11. Wheeler County
– Average commute time: 24 minutes
— #1,486 longest among all counties nationwide
— 0.4% longer than state average
— 13.0% shorter than national average
– Workers with 90+ minute commute: 5.9%
– Left for work from 12 a.m. to 6 a.m.: 21.3%
– Worked outside county of residence: 20.5%
– Means of transportation: drove alone (56%), carpooled (18.5%), walked (15.3%), public transportation (0%), worked from home (8.1%)
You may also like: Recipes from Oregon

Edmund Garman // Flickr
#10. Marion County
– Average commute time: 24.2 minutes
— #1,451 longest among all counties nationwide
— 1.3% longer than state average
— 12.3% shorter than national average
– Workers with 90+ minute commute: 1.8%
– Left for work from 12 a.m. to 6 a.m.: 17.2%
– Worked outside county of residence: 21.8%
– Means of transportation: drove alone (77%), carpooled (11.6%), walked (2.7%), public transportation (1.7%), worked from home (5.1%)
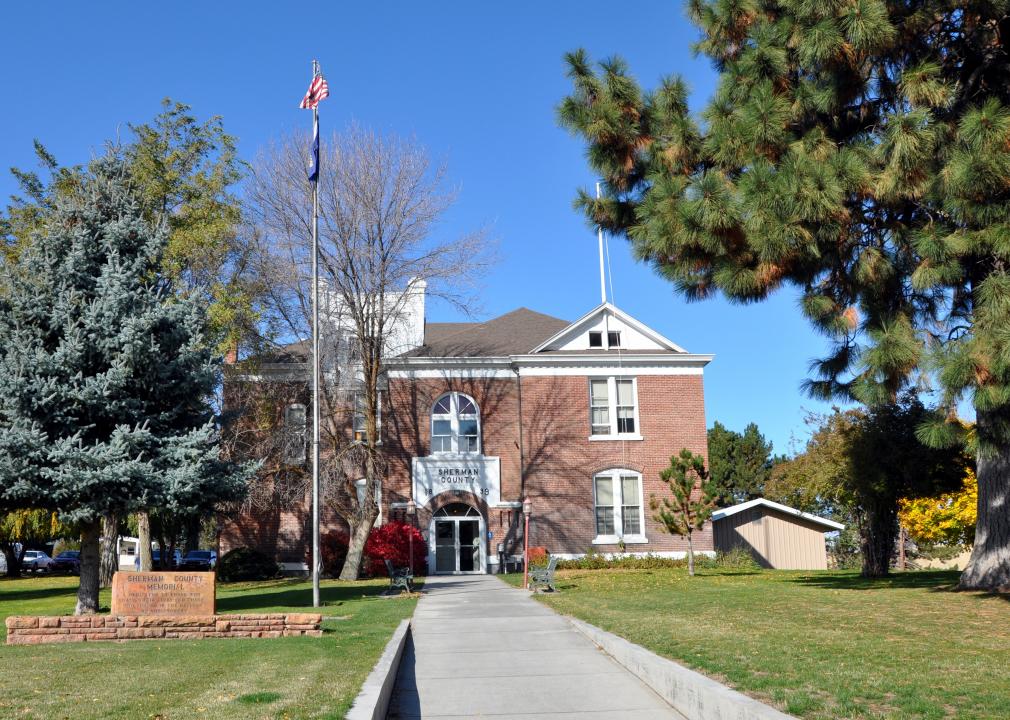
Finetooth // Wikimedia Commons
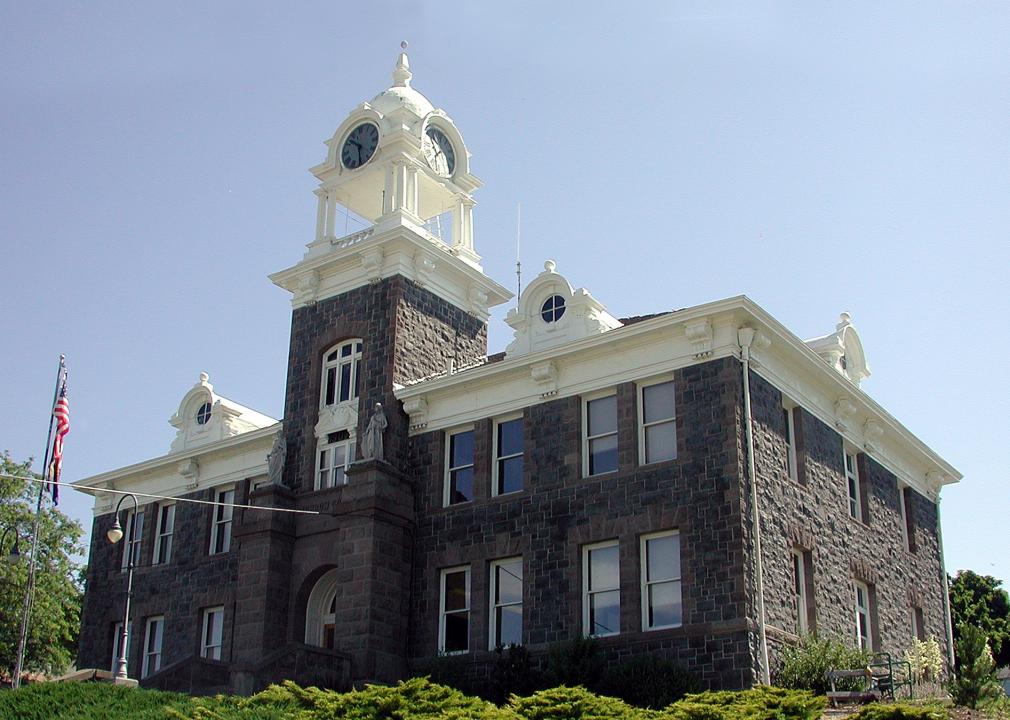
#9. Sherman County
– Average commute time: 24.5 minutes
— #1,363 longest among all counties nationwide
— 2.5% longer than state average
— 11.2% shorter than national average
– Workers with 90+ minute commute: 2.6%
– Left for work from 12 a.m. to 6 a.m.: 18.7%
– Worked outside county of residence: 25%
– Means of transportation: drove alone (77%), carpooled (5.6%), walked (4.9%), public transportation (0%), worked from home (10.2%)

M.O. Stevens // Wikimedia Commons
#8. Washington County
– Average commute time: 25.2 minutes
— #1,205 longest among all counties nationwide
— 5.4% longer than state average
— 8.7% shorter than national average
– Workers with 90+ minute commute: 1.4%
– Left for work from 12 a.m. to 6 a.m.: 12.8%
– Worked outside county of residence: 26.9%
– Means of transportation: drove alone (73.3%), carpooled (9.7%), walked (2.4%), public transportation (6.1%), worked from home (6.6%)
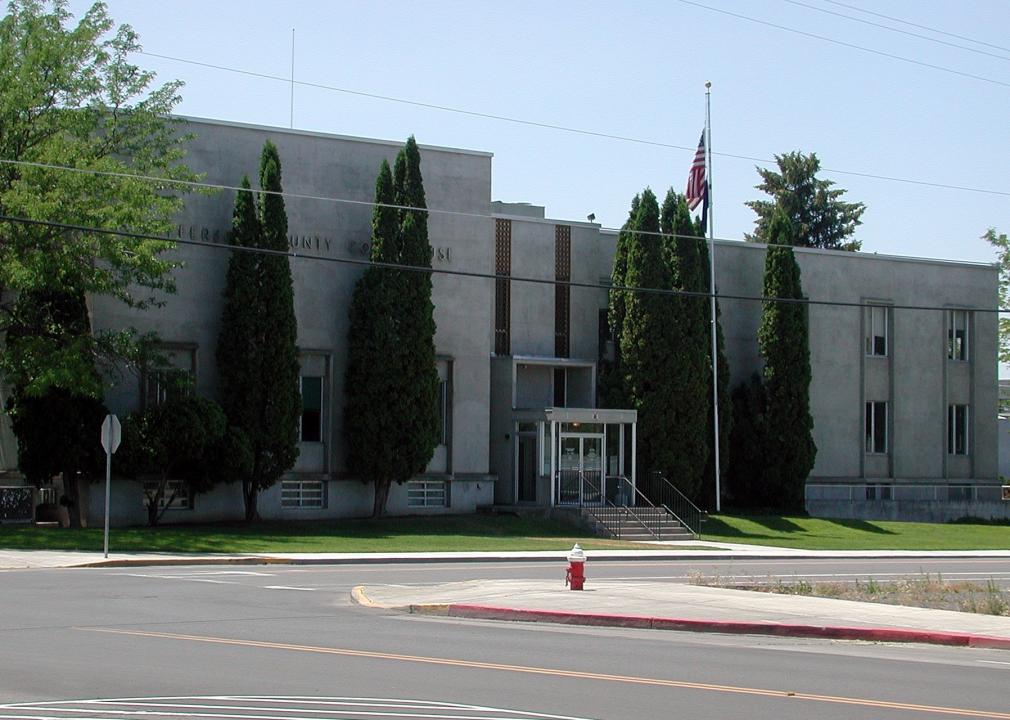
Finetooth // Wikimedia Commons
#7. Jefferson County
– Average commute time: 25.7 minutes
— #1,109 longest among all counties nationwide
— 7.5% longer than state average
— 6.9% shorter than national average
– Workers with 90+ minute commute: 3.6%
– Left for work from 12 a.m. to 6 a.m.: 19.2%
– Worked outside county of residence: 30.7%
– Means of transportation: drove alone (75.4%), carpooled (14.3%), walked (2.8%), public transportation (0.9%), worked from home (5.7%)
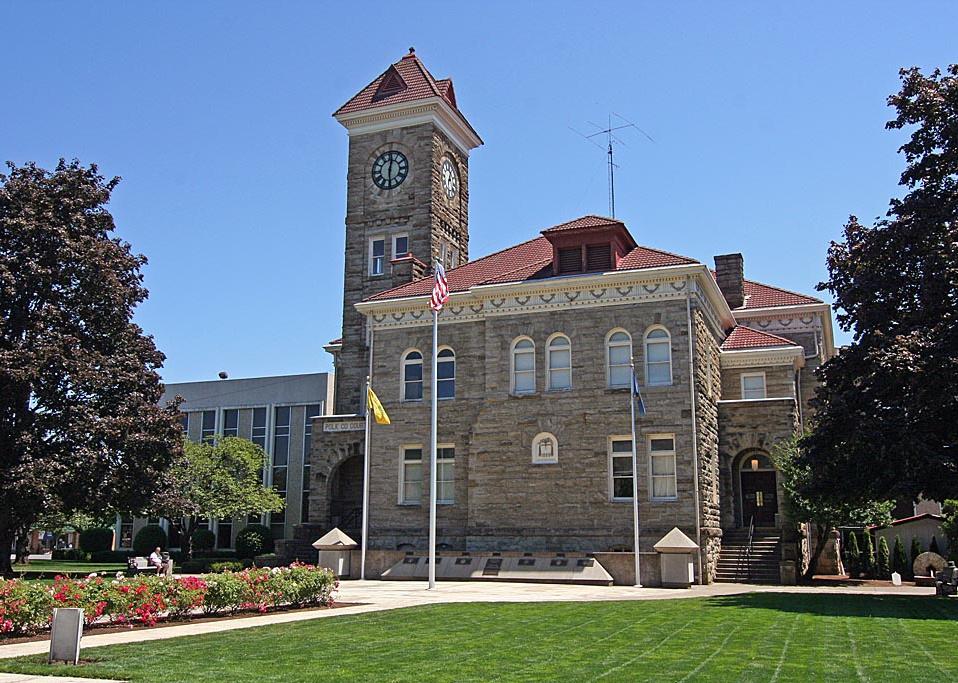
Bruce Fingerhood from Springfield, Oregon, US // Wikimedia Commons
#6. Polk County
– Average commute time: 25.8 minutes
— #1,087 longest among all counties nationwide
— 7.9% longer than state average
— 6.5% shorter than national average
– Workers with 90+ minute commute: 2.9%
– Left for work from 12 a.m. to 6 a.m.: 13.0%
– Worked outside county of residence: 55.7%
– Means of transportation: drove alone (78.5%), carpooled (9.7%), walked (3.6%), public transportation (0.7%), worked from home (6.4%)
You may also like: Most popular boy names in the 60s in Oregon
M.O. Stevens // Wikimedia Commons
#5. Yamhill County
– Average commute time: 26.1 minutes
— #1,031 longest among all counties nationwide
— 9.2% longer than state average
— 5.4% shorter than national average
– Workers with 90+ minute commute: 2.5%
– Left for work from 12 a.m. to 6 a.m.: 18.3%
– Worked outside county of residence: 35.3%
– Means of transportation: drove alone (75%), carpooled (10.5%), walked (5.5%), public transportation (0.7%), worked from home (5.9%)

Stuart Seeger // Wikicommons
#4. Multnomah County
– Average commute time: 27 minutes
— #868 longest among all counties nationwide
— 13.0% longer than state average
— 2.2% shorter than national average
– Workers with 90+ minute commute: 2.1%
– Left for work from 12 a.m. to 6 a.m.: 11.5%
– Worked outside county of residence: 17.2%
– Means of transportation: drove alone (60.1%), carpooled (8.9%), walked (5.2%), public transportation (11.8%), worked from home (7.8%)
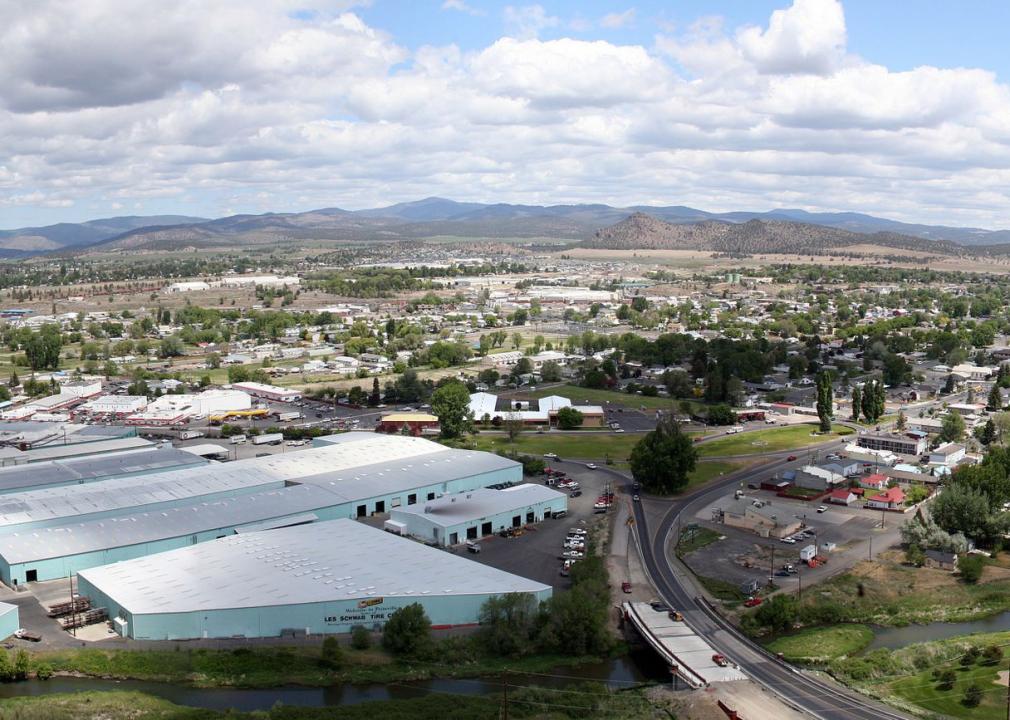
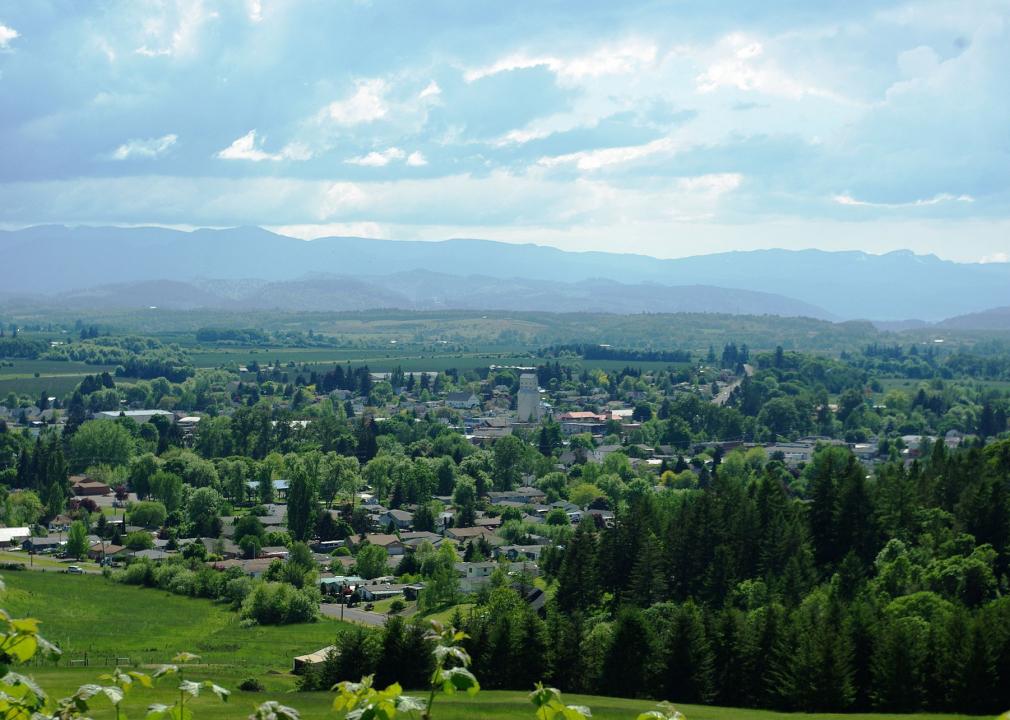
Cacophony // Wikimedia Commons
#3. Crook County
– Average commute time: 27.9 minutes
— #724 longest among all counties nationwide
— 16.7% longer than state average
— 1.1% longer than national average
– Workers with 90+ minute commute: 4.3%
– Left for work from 12 a.m. to 6 a.m.: 20.5%
– Worked outside county of residence: 38.5%
– Means of transportation: drove alone (79.4%), carpooled (12.7%), walked (2.4%), public transportation (0%), worked from home (4.3%)

Mrgadget51 // Wikimedia Commons
#2. Clackamas County
– Average commute time: 29.2 minutes
— #536 longest among all counties nationwide
— 22.2% longer than state average
— 5.8% longer than national average
– Workers with 90+ minute commute: 2.3%
– Left for work from 12 a.m. to 6 a.m.: 15.5%
– Worked outside county of residence: 47.6%
– Means of transportation: drove alone (76%), carpooled (8.6%), walked (2.1%), public transportation (3%), worked from home (8.4%)

Cacophony // Wikimedia Commons
#1. Columbia County
– Average commute time: 33.9 minutes
— #144 longest among all counties nationwide
— 41.8% longer than state average
— 22.8% longer than national average
– Workers with 90+ minute commute: 3.0%
– Left for work from 12 a.m. to 6 a.m.: 25.1%
– Worked outside county of residence: 46%
– Means of transportation: drove alone (78.3%), carpooled (11.4%), walked (2%), public transportation (0.5%), worked from home (6.6%)
You may also like: Counties with the oldest homes in Oregon
