How the cost of independent living has changed over time

Deemerwha studio // Shutterstock
How the cost of independent living has changed over time
Person calculating expenses with a calculator and a notebook, holding a stack of money.
If the hit 1990s sitcom “Friends” debuted today, it might look a little different. For one thing, the showrunners would probably need to cast consistent roles to play the main characters’ parents or even grandparents—the de facto roommates for a growing number of Americans in recent decades.
Since the turn of the century, it’s become more expensive for Americans to live on their own. And the effect is shifting away from the nation’s late 20th-century culture of independence, perhaps for years to come.
To quantify that escalation, Magnifi, an AI investing app, analyzed and charted historical Bureau of Labor Statistics price data from 1981 to 2023 to see how independent living costs have grown in relation to wages.
![]()
Magnifi
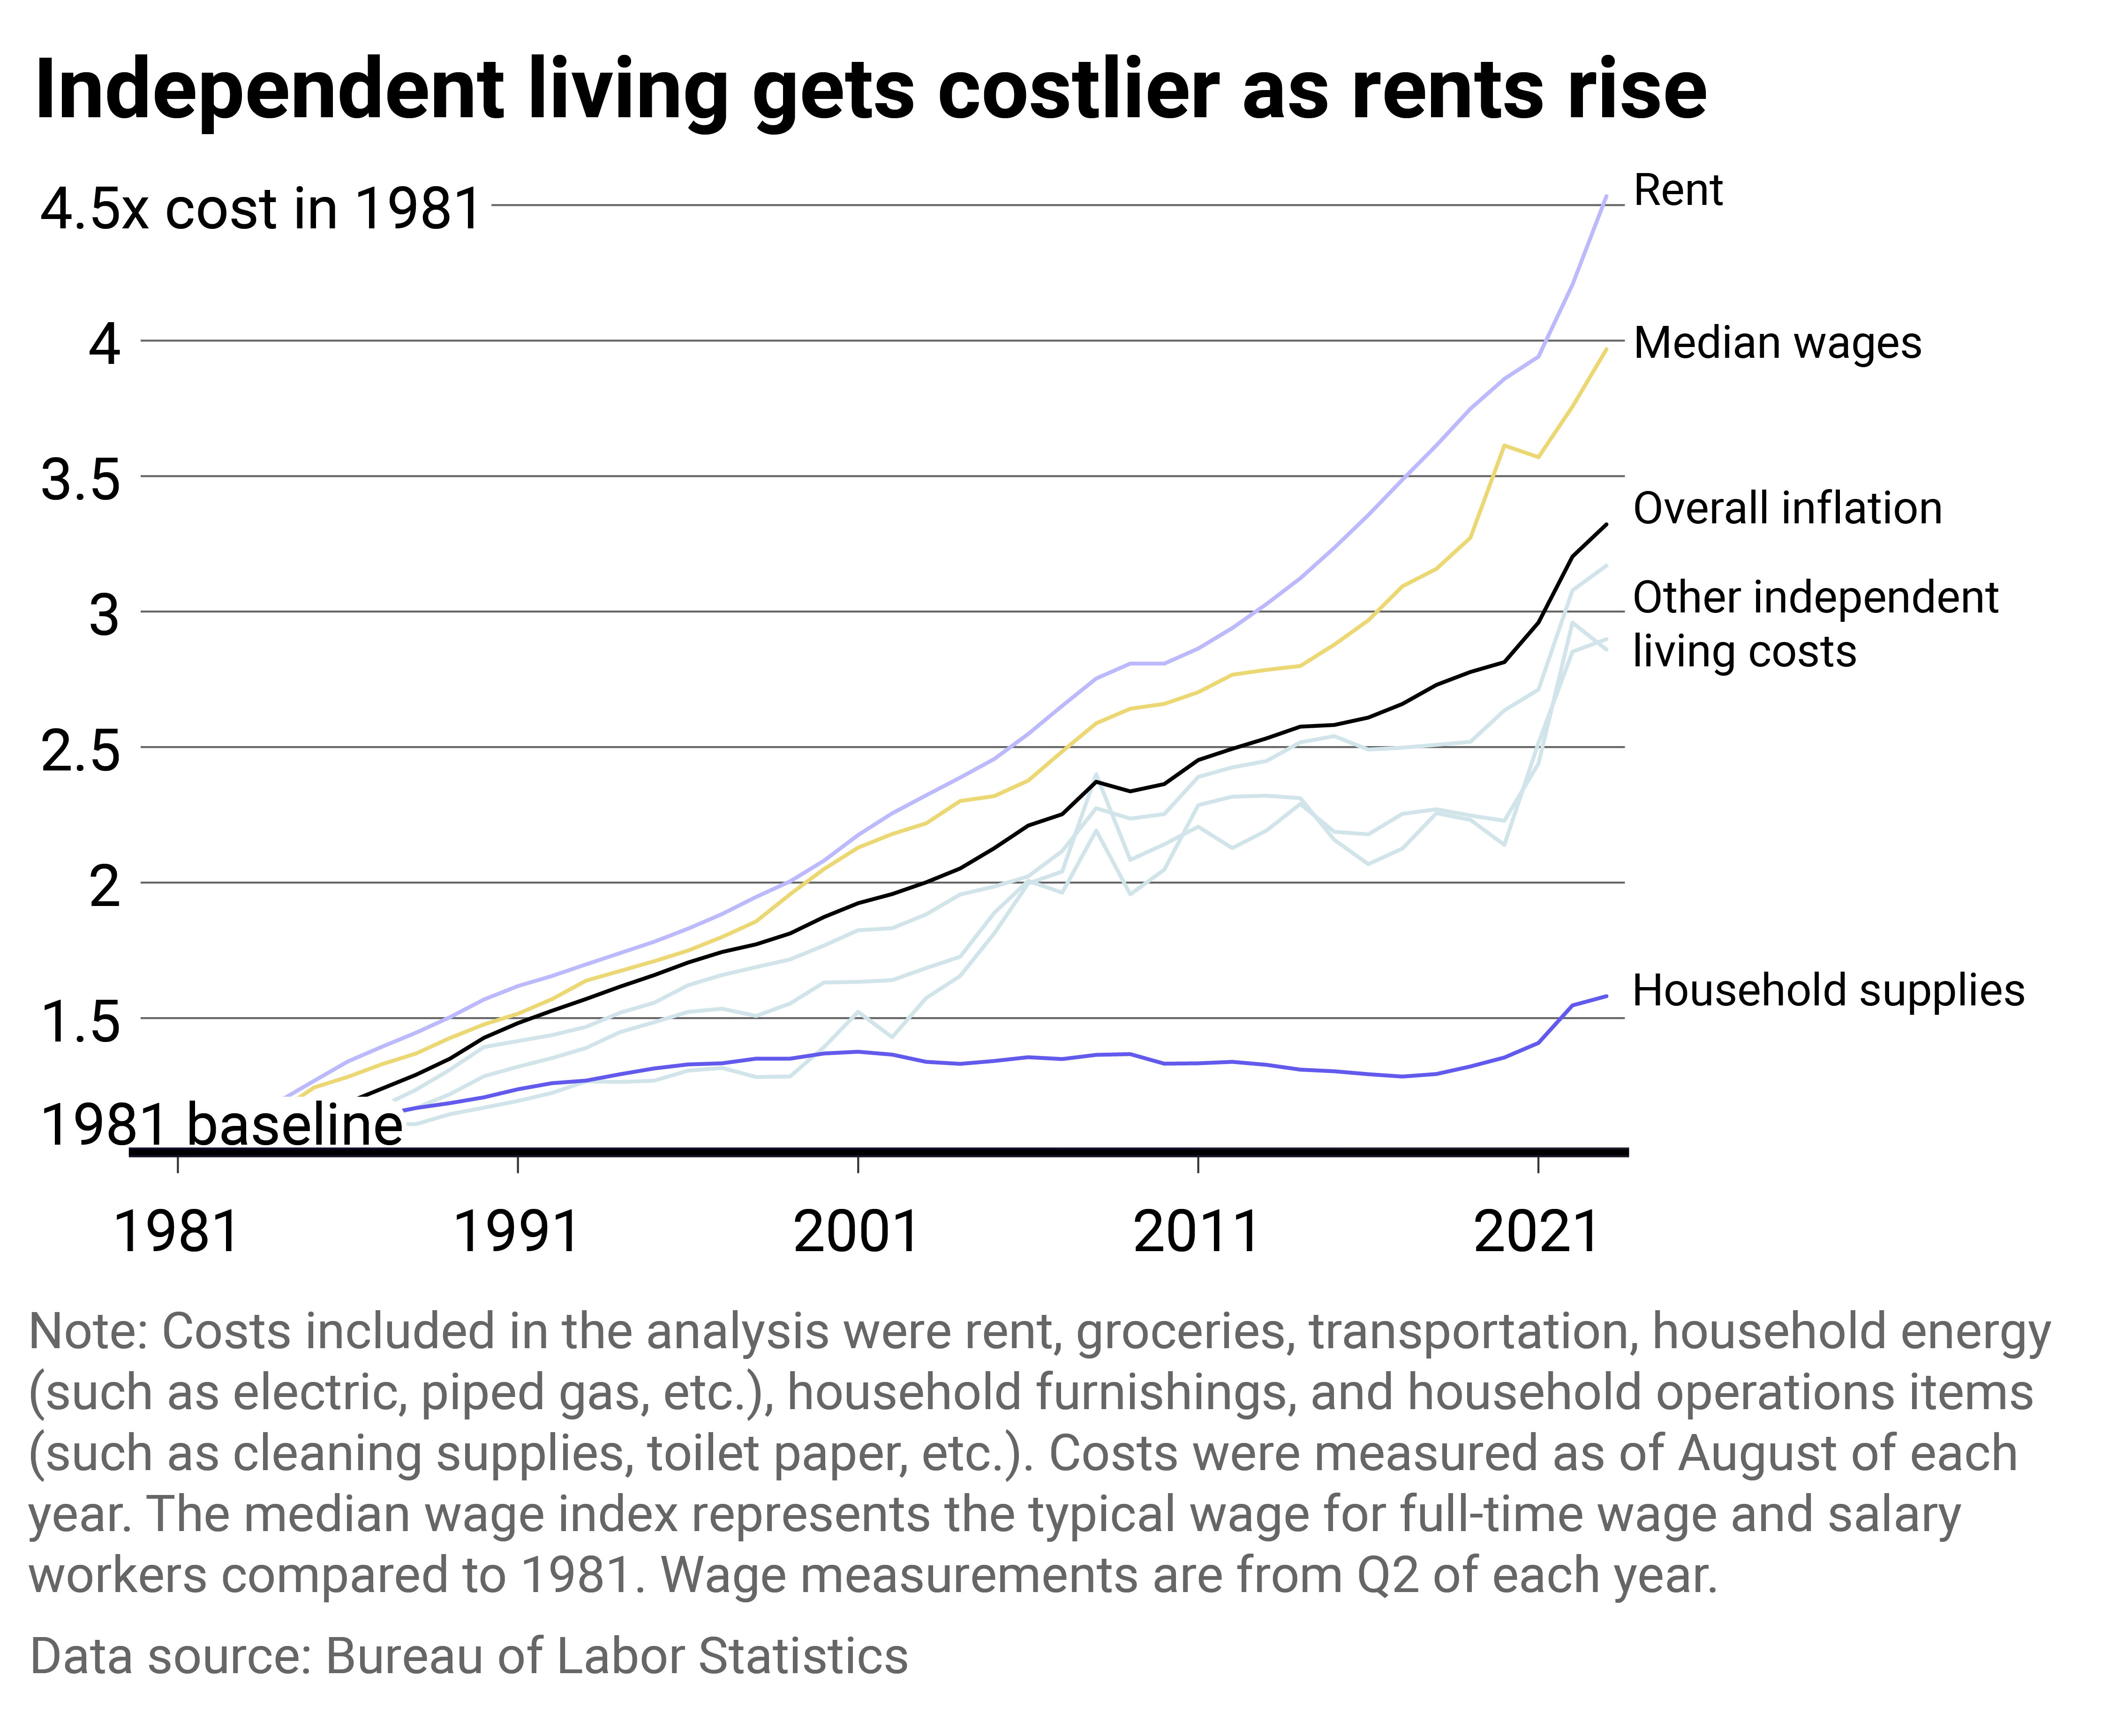
Wage growth and shelter diverge
A multiline chart showing changes in the cost of various items over time.
The average cost of rent for Americans has increased faster than all other costs and wages since the start of the 1980s, where this analysis begins. The single most significant monthly expense for most people—shelter—has risen faster than the average income of a typical single American.
The higher prices are a symptom of an imbalance in supply and demand for single-family and multifamily housing in the U.S. that’s been festering for about 15 years. As the economy recovered in the wake of the 2008 housing market collapse, construction of new housing failed to meet demand, pushing the vacancy rate down and keeping prices relatively high.
Typical hourly wages grew at roughly 5% per year in the late 1990s and then a more modest 3% to 4% in the early 2000s after the collapse of the tech bubble. After the Global Financial Crisis, wages hardly grew at all, notching 1% to 2% growth until just before the pandemic struck in 2020.
Meanwhile, the rising costs of other essential factors for independent living, including gas, electricity, and food, have taken a bite out of those wage increases.
Rent, however, made a more dramatic departure from the typical American income in the early 2000s. From 2005 to 2015, the share of 18-to-34-year-olds living with their parents grew from 26% to 34.1%, according to Census Bureau data.
By 2019, the number of Americans living in each household broke a longtime downward trend, ticking upward for the first time in more than a century. After that, the COVID-19 pandemic pushed more working-age young people into their parents’ homes.
The share of adults under 30 who lived in their parents’ homes surpassed a new milestone in 2020—Pew Research reported that 52% lived at home with their parents. That’s on par with the aftermath of the Great Depression.
But the trend of larger households also includes middle-aged people supporting older generations. Studies have suggested that despite these changes in family dynamics and household structures, Americans may be okay with being a part of larger households. In 2019, 45% of Americans said it made no difference, up from 32% in 2019, according to a Pew Research survey.
To put independent living in the U.S. into perspective, Europeans might argue current trends are not a bad thing. For instance, in eastern and southern European countries, more than 60% of the adult population under 34 lives in their parents’ homes.
Story editing by Jeff Inglis. Copy editing by Kristen Wegrzyn.
This story originally appeared on Magnifi and was produced and
distributed in partnership with Stacker Studio.
