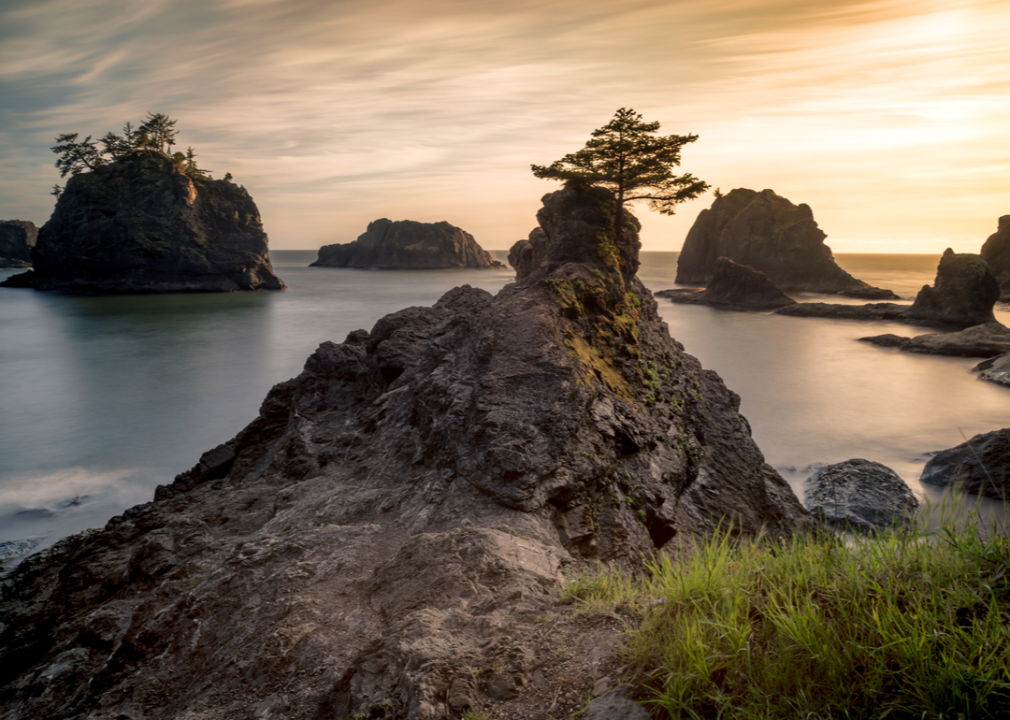
Fastest-growing counties in Oregon

Stuart Seeger // Wikicommons
Fastest-growing counties in Oregon
From 2019 to 2020, the U.S. population grew by .35%, its slowest rate since 1900. Declining births, increasing deaths largely due to the graying Baby Boomer population, and a crackdown on immigration have contributed to many states seeing net population losses in recent years.
But in other pockets of the country, populations are growing. These shifts can be due to job opportunities, high quality of life, easy commutability to job centers, low rents, or any combination of these or other factors. Stacker compiled a list of the fastest-growing counties in Oregon using data from the U.S. Census Bureau. Counties are ranked by the highest population growth from 2010 to 2020.
A county typically sees population growth as a “bedroom community” (a municipality with an atypically large commuting population) to a large city. These communities are typically quieter than their feeder cities, offer lower rents and a higher quality of living, and are remote enough to be immune to the feeder city’s crime, traffic, and crowds. Keep reading to see if your home county made the list.
![]()

Finetooth // Wikimedia Commons
#36. Grant County
– 2010 to 2020 population change: -116
— #1,702 among all counties nationwide
– 2010 to 2020 percent population change: -1.6%
— #36 among counties in Oregon, #1,801 among all counties nationwide
– 2020 population: 7,233
— #33 largest county in Oregon, #2,642 largest county nationwide

Tomas Nevesely // Shutterstock
#35. Wheeler County
– 2010 to 2020 population change: 8
— #1,551 among all counties nationwide
– 2010 to 2020 percent population change: +0.6%
— #35 among counties in Oregon, #1,486 among all counties nationwide
– 2020 population: 1,451
— #36 largest county in Oregon, #3,078 largest county nationwide
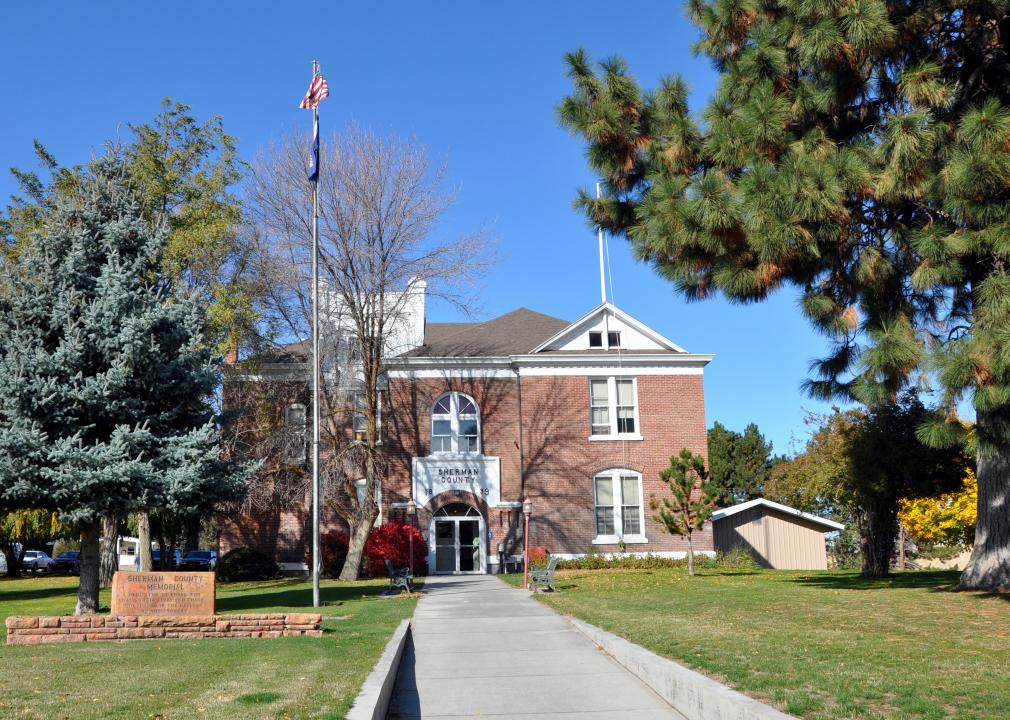
Finetooth // Wikimedia Commons
#34. Sherman County
– 2010 to 2020 population change: 51
— #1,500 among all counties nationwide
– 2010 to 2020 percent population change: +2.8%
— #31 among counties in Oregon, #1,183 among all counties nationwide
– 2020 population: 1,870
— #35 largest county in Oregon, #3,053 largest county nationwide

Ken Lund // Wikimedia Commons
#33. Harney County
– 2010 to 2020 population change: 131
— #1,443 among all counties nationwide
– 2010 to 2020 percent population change: +1.8%
— #33 among counties in Oregon, #1,320 among all counties nationwide
– 2020 population: 7,495
— #31 largest county in Oregon, #2,620 largest county nationwide
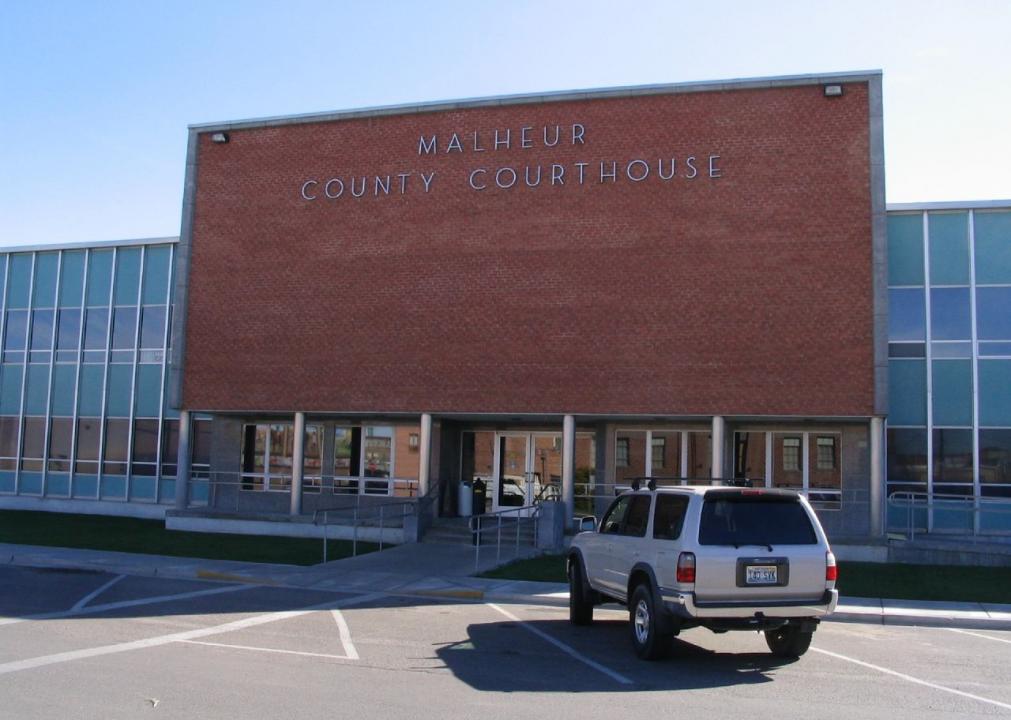
Ken Lund from Reno, Nevada, USA // Wikimedia Commons
#32. Malheur County
– 2010 to 2020 population change: 245
— #1,368 among all counties nationwide
– 2010 to 2020 percent population change: +0.8%
— #34 among counties in Oregon, #1,456 among all counties nationwide
– 2020 population: 31,571
— #20 largest county in Oregon, #1,383 largest county nationwide

Tedder // Wikimedia Commons
#31. Gilliam County
– 2010 to 2020 population change: 264
— #1,350 among all counties nationwide
– 2010 to 2020 percent population change: +15.3%
— #4 among counties in Oregon, #300 among all counties nationwide
– 2020 population: 1,995
— #34 largest county in Oregon, #3,040 largest county nationwide
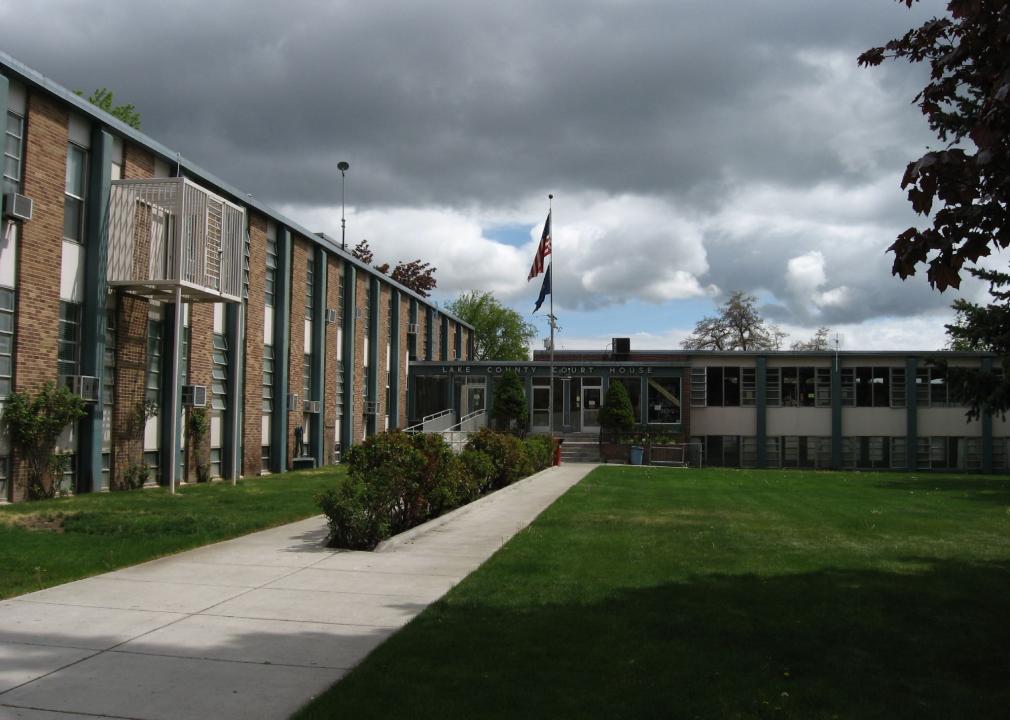
Ken Lund // Wikimedia Commons
#30. Lake County
– 2010 to 2020 population change: 278
— #1,340 among all counties nationwide
– 2010 to 2020 percent population change: +3.5%
— #28 among counties in Oregon, #1,088 among all counties nationwide
– 2020 population: 8,160
— #30 largest county in Oregon, #2,568 largest county nationwide

Sam Beebe // Wikimedia Commons
#29. Wallowa County
– 2010 to 2020 population change: 472
— #1,249 among all counties nationwide
– 2010 to 2020 percent population change: +6.8%
— #24 among counties in Oregon, #783 among all counties nationwide
– 2020 population: 7,391
— #32 largest county in Oregon, #2,631 largest county nationwide
Finetooth // Wikimedia Commons
#28. Baker County
– 2010 to 2020 population change: 518
— #1,231 among all counties nationwide
– 2010 to 2020 percent population change: +3.2%
— #30 among counties in Oregon, #1,121 among all counties nationwide
– 2020 population: 16,668
— #28 largest county in Oregon, #1,993 largest county nationwide

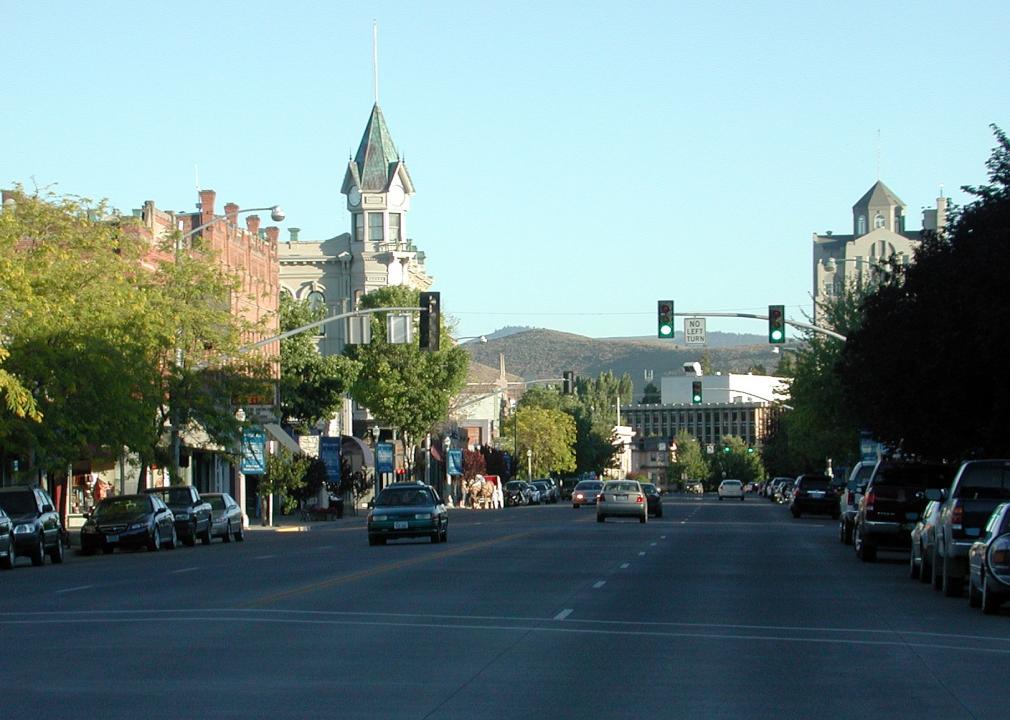
Williamborg // Wikimedia Commons
#27. Union County
– 2010 to 2020 population change: 823
— #1,124 among all counties nationwide
– 2010 to 2020 percent population change: +3.2%
— #29 among counties in Oregon, #1,115 among all counties nationwide
– 2020 population: 26,196
— #23 largest county in Oregon, #1,553 largest county nationwide
Manuela Durson // Shutterstock
#26. Curry County
– 2010 to 2020 population change: 1,035
— #1,073 among all counties nationwide
– 2010 to 2020 percent population change: +4.6%
— #25 among counties in Oregon, #973 among all counties nationwide
– 2020 population: 23,446
— #27 largest county in Oregon, #1,660 largest county nationwide

Finetooth // Wikimedia Commons
#25. Morrow County
– 2010 to 2020 population change: 1,074
— #1,066 among all counties nationwide
– 2010 to 2020 percent population change: +9.7%
— #18 among counties in Oregon, #582 among all counties nationwide
– 2020 population: 12,186
— #29 largest county in Oregon, #2,264 largest county nationwide
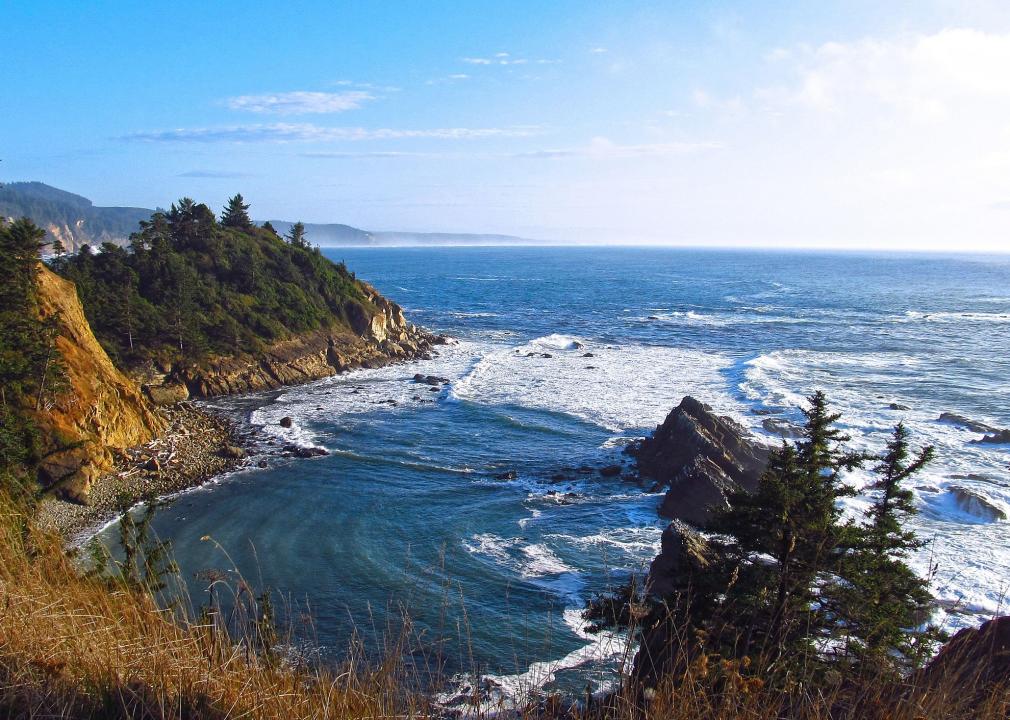
Debbie Tegtmeier // Wikimedia Commons
#24. Coos County
– 2010 to 2020 population change: 1,610
— #956 among all counties nationwide
– 2010 to 2020 percent population change: +2.5%
— #32 among counties in Oregon, #1,211 among all counties nationwide
– 2020 population: 64,929
— #16 largest county in Oregon, #830 largest county nationwide
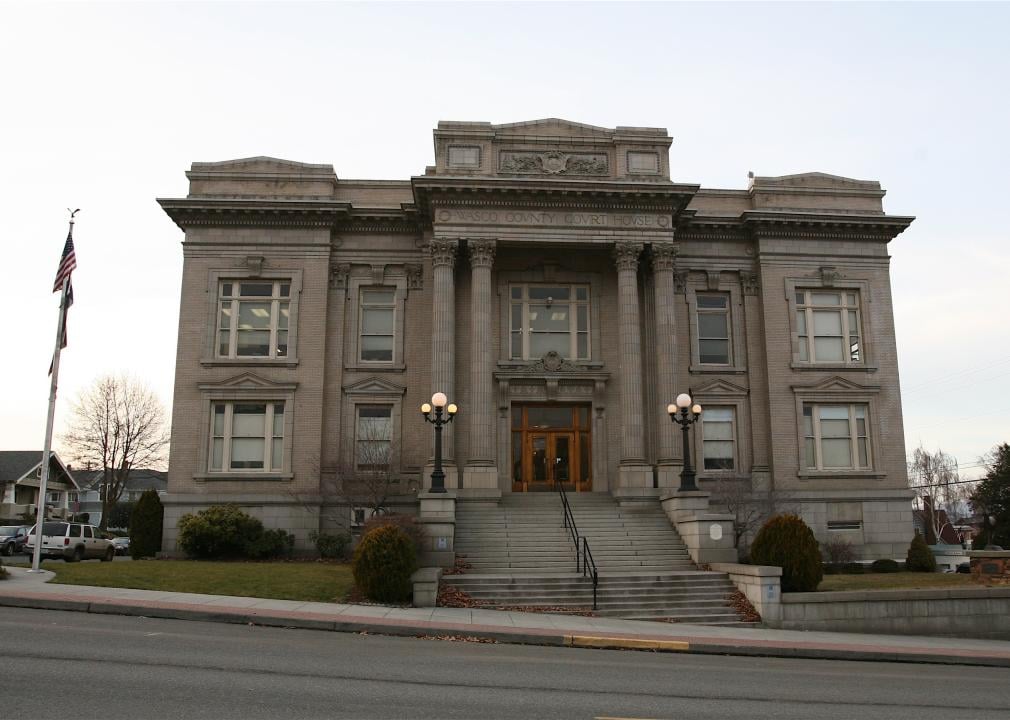
Cacophony // Wikimedia Commons
#23. Wasco County
– 2010 to 2020 population change: 1,975
— #906 among all counties nationwide
– 2010 to 2020 percent population change: +8.0%
— #20 among counties in Oregon, #696 among all counties nationwide
– 2020 population: 26,670
— #22 largest county in Oregon, #1,540 largest county nationwide
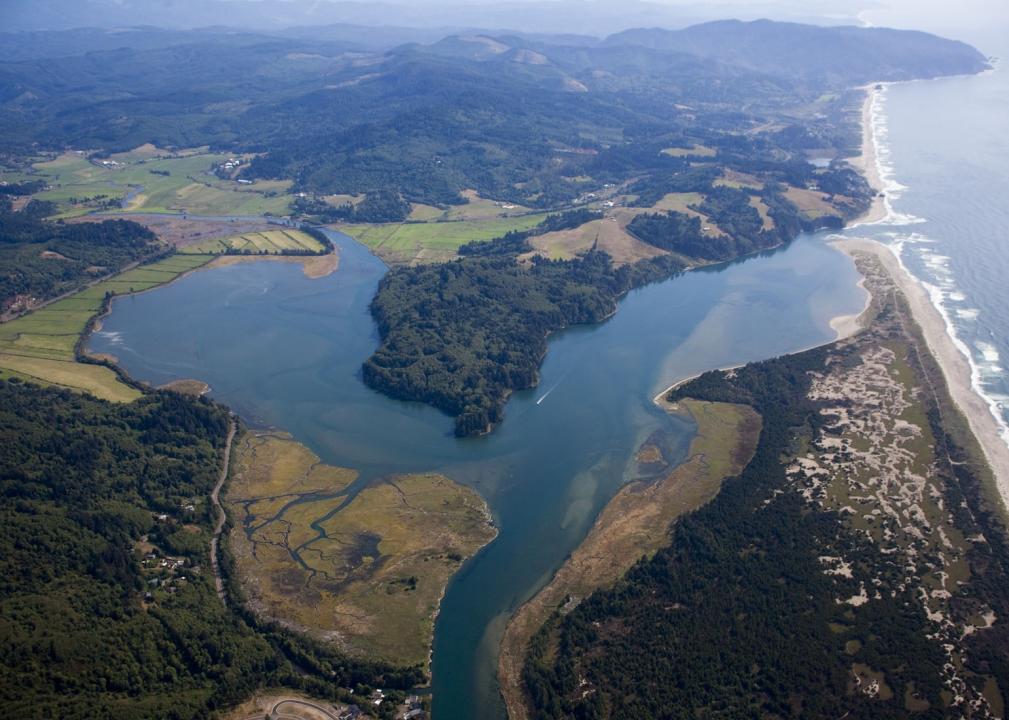
USFWS Headquarters’ photostream // Wikimedia Commons
#22. Tillamook County
– 2010 to 2020 population change: 2,190
— #869 among all counties nationwide
– 2010 to 2020 percent population change: +8.7%
— #19 among counties in Oregon, #637 among all counties nationwide
– 2020 population: 27,390
— #21 largest county in Oregon, #1,515 largest county nationwide
Sam Beebe // Wikimedia Commons
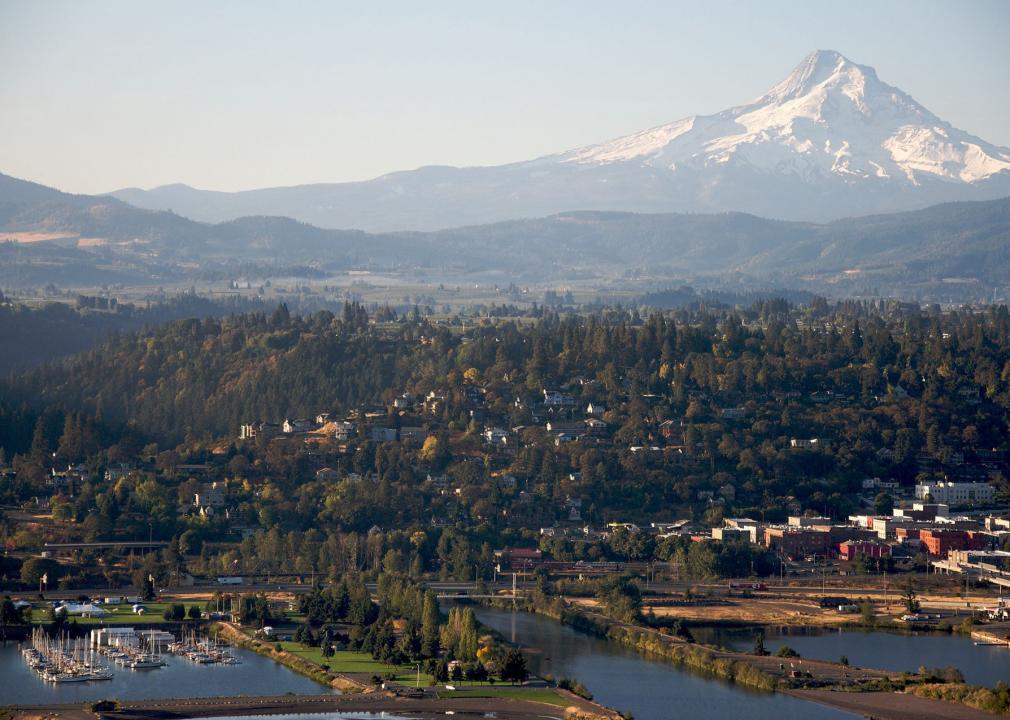
#21. Hood River County
– 2010 to 2020 population change: 2,271
— #857 among all counties nationwide
– 2010 to 2020 percent population change: +10.5%
— #15 among counties in Oregon, #530 among all counties nationwide
– 2020 population: 23,977
— #26 largest county in Oregon, #1,642 largest county nationwide
Finetooth // Wikimedia Commons
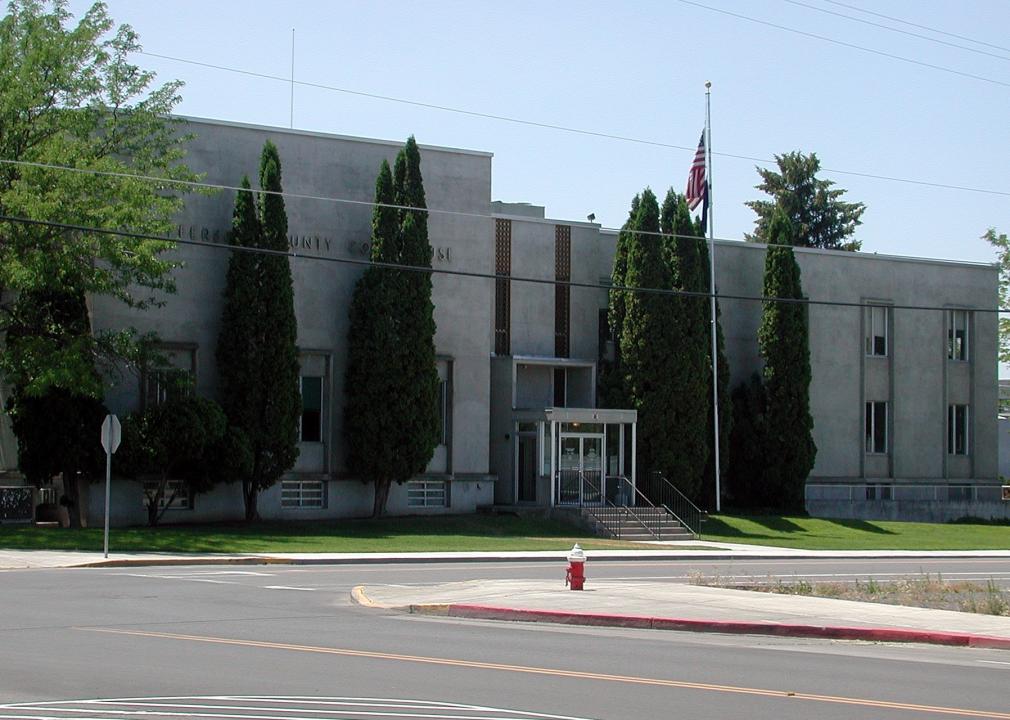
#20. Jefferson County
– 2010 to 2020 population change: 2,850
— #786 among all counties nationwide
– 2010 to 2020 percent population change: +13.2%
— #8 among counties in Oregon, #381 among all counties nationwide
– 2020 population: 24,502
— #25 largest county in Oregon, #1,627 largest county nationwide
Bobjgalindo // Wikimedia Commons
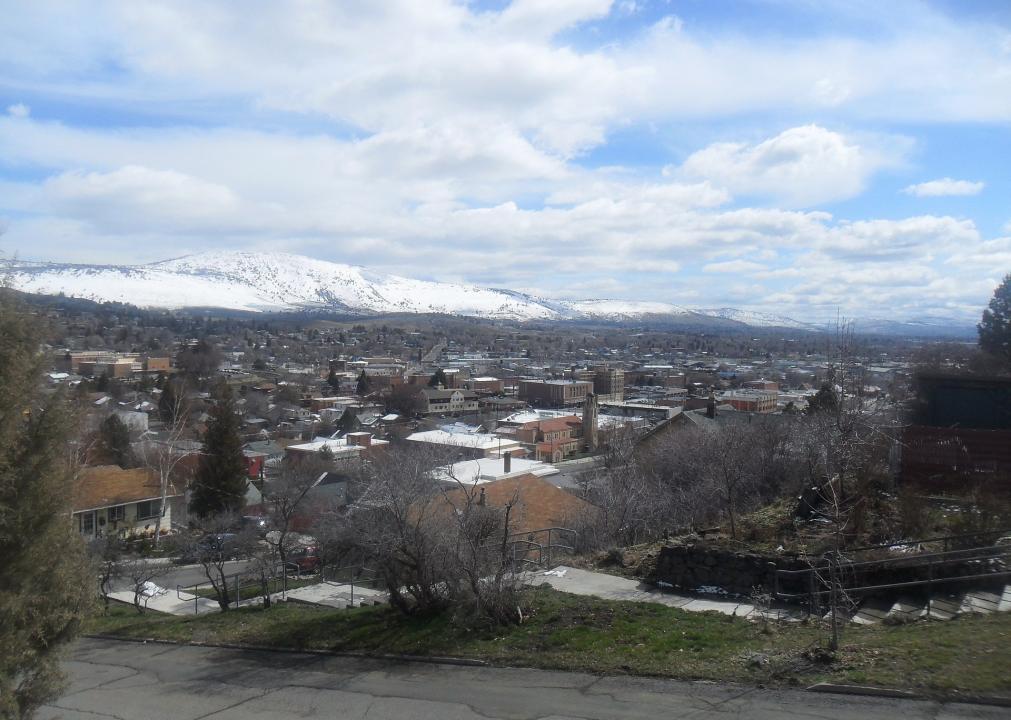
#19. Klamath County
– 2010 to 2020 population change: 2,893
— #781 among all counties nationwide
– 2010 to 2020 percent population change: +4.3%
— #26 among counties in Oregon, #993 among all counties nationwide
– 2020 population: 69,413
— #15 largest county in Oregon, #776 largest county nationwide
Cacophony // Wikimedia Commons
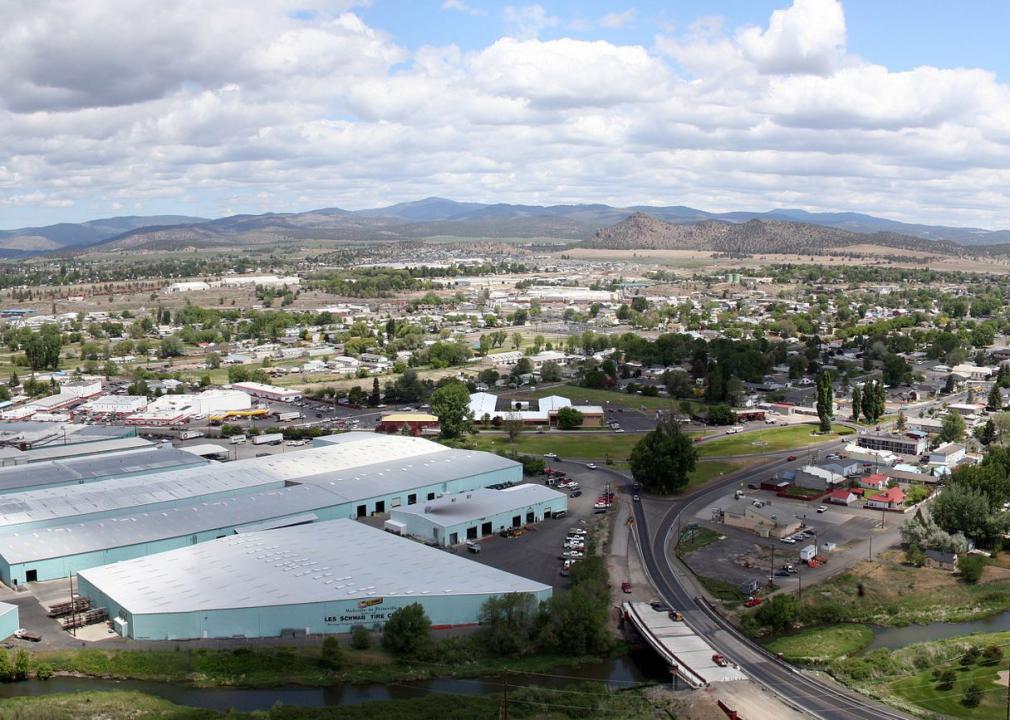
#18. Crook County
– 2010 to 2020 population change: 3,223
— #751 among all counties nationwide
– 2010 to 2020 percent population change: +15.0%
— #5 among counties in Oregon, #311 among all counties nationwide
– 2020 population: 24,738
— #24 largest county in Oregon, #1,612 largest county nationwide
Cacophony // Wikimedia Commons
#17. Columbia County
– 2010 to 2020 population change: 3,583
— #719 among all counties nationwide
– 2010 to 2020 percent population change: +7.3%
— #21 among counties in Oregon, #745 among all counties nationwide
– 2020 population: 52,589
— #17 largest county in Oregon, #954 largest county nationwide
English: Gary Halvorson, Oregon State Archives // Wikimedia Commons
#16. Douglas County
– 2010 to 2020 population change: 3,992
— #690 among all counties nationwide
– 2010 to 2020 percent population change: +3.7%
— #27 among counties in Oregon, #1,067 among all counties nationwide
– 2020 population: 111,201
— #9 largest county in Oregon, #551 largest county nationwide

English: Gary Halvorson, Oregon State Archives // Wikimedia Commons
#15. Clatsop County
– 2010 to 2020 population change: 4,214
— #677 among all counties nationwide
– 2010 to 2020 percent population change: +11.4%
— #12 among counties in Oregon, #473 among all counties nationwide
– 2020 population: 41,072
— #19 largest county in Oregon, #1,157 largest county nationwide
EncMstr // Wikimedia Commons
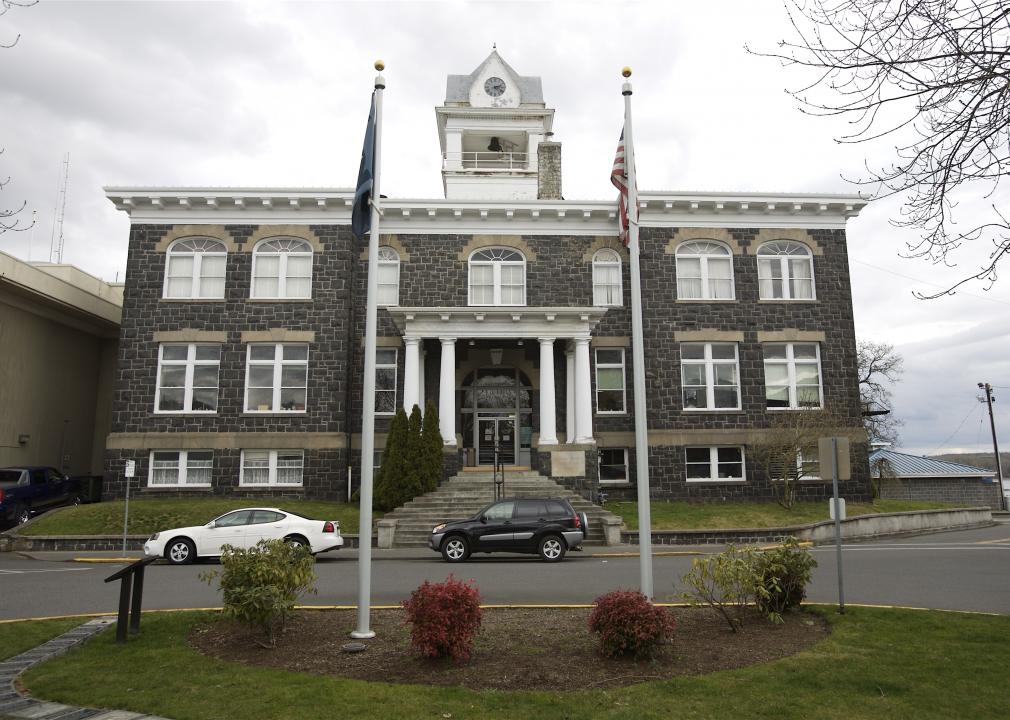
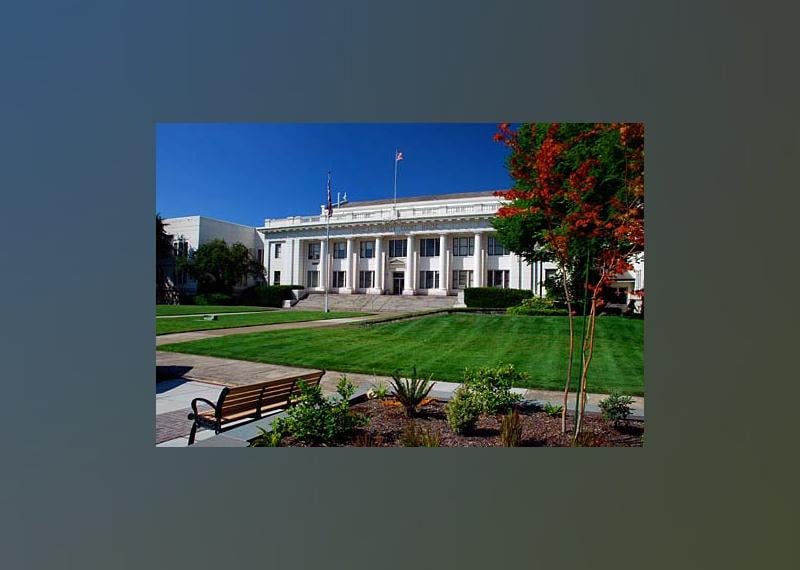
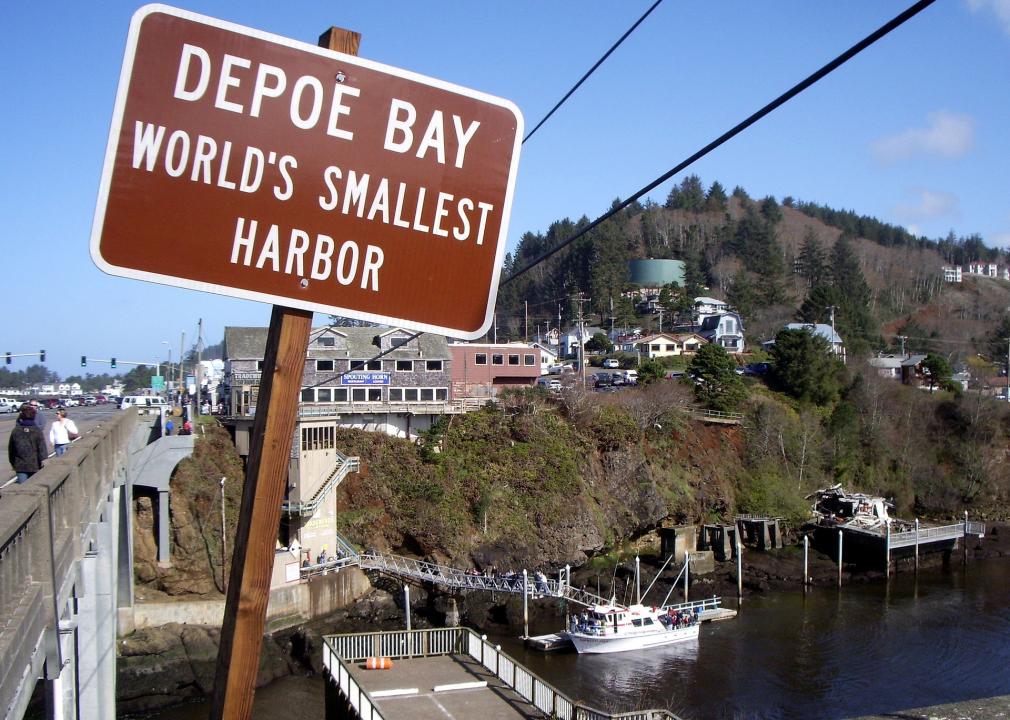
#14. Lincoln County
– 2010 to 2020 population change: 4,538
— #655 among all counties nationwide
– 2010 to 2020 percent population change: +9.9%
— #17 among counties in Oregon, #568 among all counties nationwide
– 2020 population: 50,395
— #18 largest county in Oregon, #986 largest county nationwide
Gancayco // Wikimedia Commons
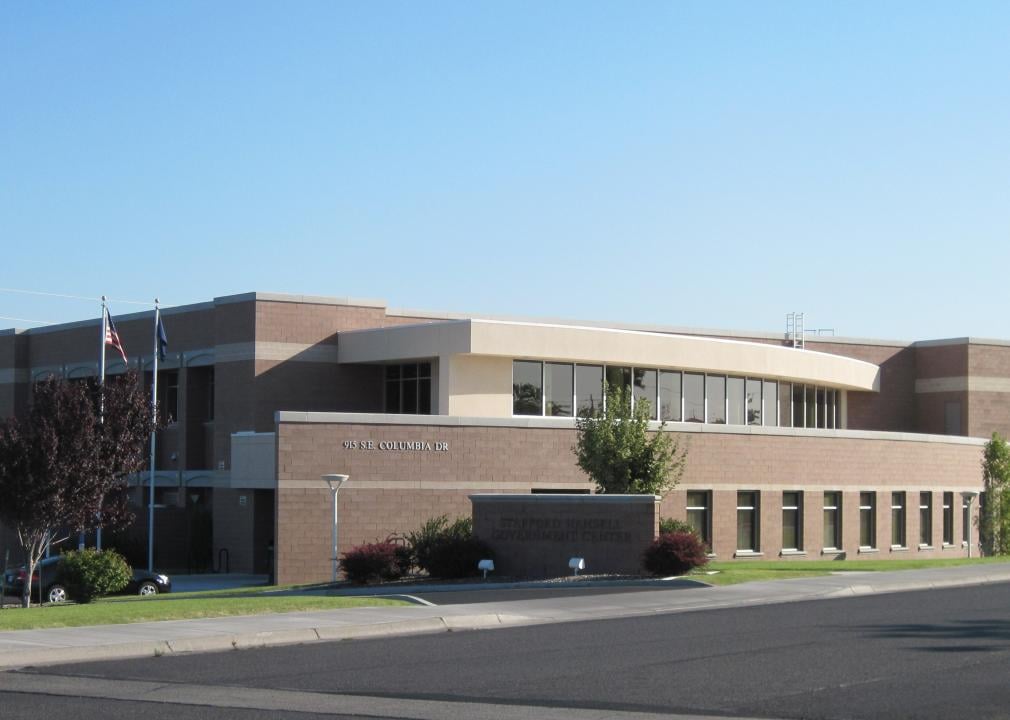
#13. Umatilla County
– 2010 to 2020 population change: 5,271
— #614 among all counties nationwide
– 2010 to 2020 percent population change: +7.0%
— #23 among counties in Oregon, #760 among all counties nationwide
– 2020 population: 80,075
— #14 largest county in Oregon, #711 largest county nationwide

Joseph Novak // Wikicommons
#12. Josephine County
– 2010 to 2020 population change: 5,918
— #590 among all counties nationwide
– 2010 to 2020 percent population change: +7.2%
— #22 among counties in Oregon, #749 among all counties nationwide
– 2020 population: 88,090
— #12 largest county in Oregon, #664 largest county nationwide

M.O. Stevens // Wikimedia Commons
#11. Yamhill County
– 2010 to 2020 population change: 10,792
— #461 among all counties nationwide
– 2010 to 2020 percent population change: +11.1%
— #14 among counties in Oregon, #488 among all counties nationwide
– 2020 population: 107,722
— #10 largest county in Oregon, #569 largest county nationwide
cpaulfell // Shutterstock
#10. Benton County
– 2010 to 2020 population change: 11,026
— #455 among all counties nationwide
– 2010 to 2020 percent population change: +13.1%
— #9 among counties in Oregon, #389 among all counties nationwide
– 2020 population: 95,184
— #11 largest county in Oregon, #635 largest county nationwide
Bruce Fingerhood from Springfield, Oregon, US // Wikimedia Commons
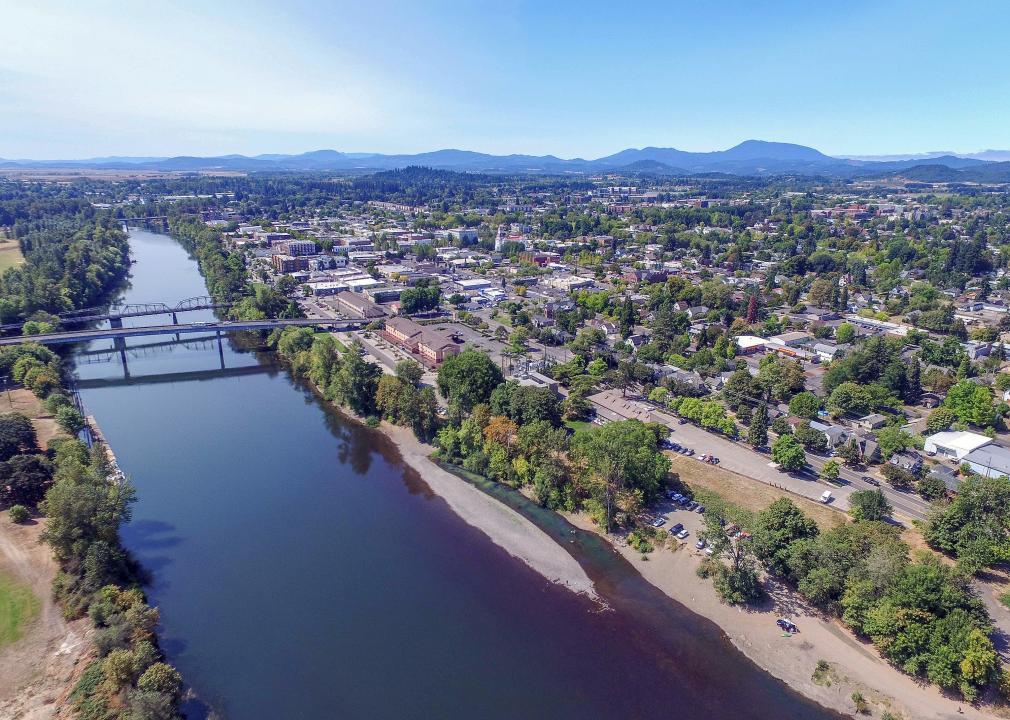
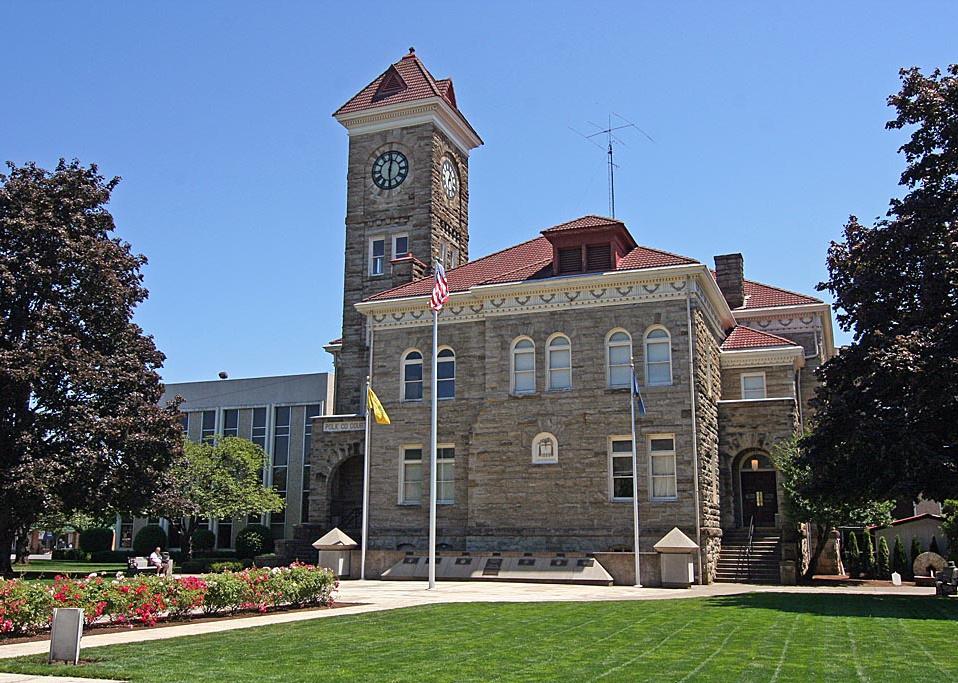
#9. Polk County
– 2010 to 2020 population change: 13,688
— #407 among all counties nationwide
– 2010 to 2020 percent population change: +18.6%
— #2 among counties in Oregon, #218 among all counties nationwide
– 2020 population: 87,433
— #13 largest county in Oregon, #668 largest county nationwide

Jmabel // Wikimedia Commons
#8. Linn County
– 2010 to 2020 population change: 14,295
— #387 among all counties nationwide
– 2010 to 2020 percent population change: +12.5%
— #10 among counties in Oregon, #417 among all counties nationwide
– 2020 population: 128,610
— #8 largest county in Oregon, #505 largest county nationwide
Little Mountain 5 // Wikicommons
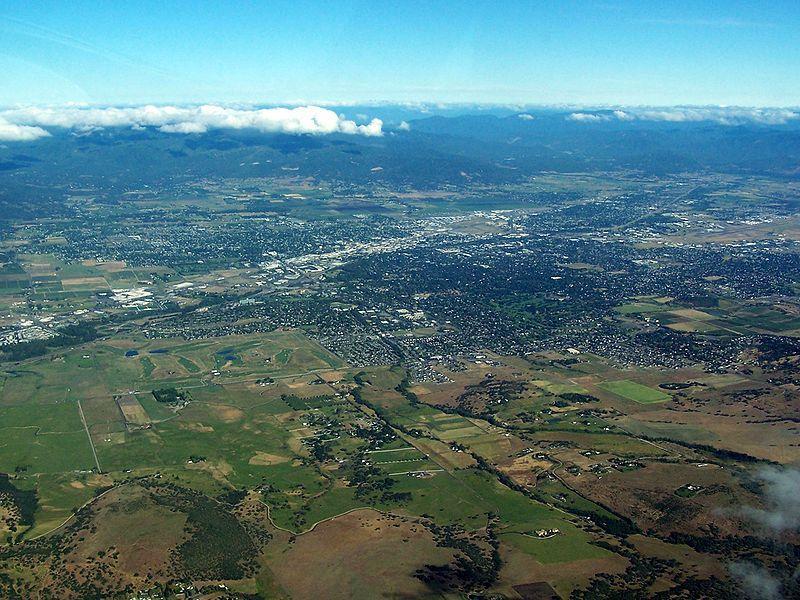
#7. Jackson County
– 2010 to 2020 population change: 22,672
— #308 among all counties nationwide
– 2010 to 2020 percent population change: +11.3%
— #13 among counties in Oregon, #478 among all counties nationwide
– 2020 population: 223,259
— #6 largest county in Oregon, #311 largest county nationwide
Lauram12345 // Wikicommons
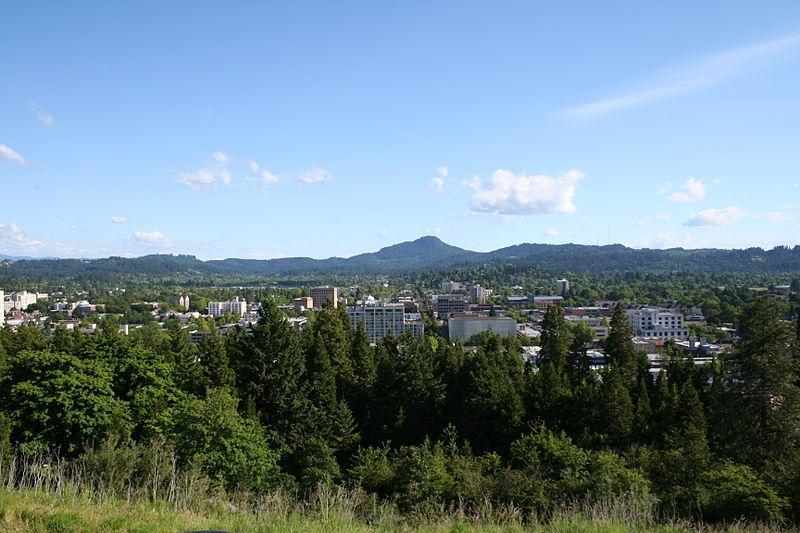
#6. Lane County
– 2010 to 2020 population change: 35,815
— #210 among all counties nationwide
– 2010 to 2020 percent population change: +10.3%
— #16 among counties in Oregon, #537 among all counties nationwide
– 2020 population: 382,971
— #4 largest county in Oregon, #189 largest county nationwide

Edmund Garman // Flickr
#5. Marion County
– 2010 to 2020 population change: 36,026
— #209 among all counties nationwide
– 2010 to 2020 percent population change: +11.6%
— #11 among counties in Oregon, #459 among all counties nationwide
– 2020 population: 345,920
— #5 largest county in Oregon, #209 largest county nationwide
Ian Poellet // Wikimedia Commons
#4. Deschutes County
– 2010 to 2020 population change: 43,685
— #172 among all counties nationwide
– 2010 to 2020 percent population change: +28.3%
— #1 among counties in Oregon, #83 among all counties nationwide
– 2020 population: 198,253
— #7 largest county in Oregon, #342 largest county nationwide
Mrgadget51 // Wikimedia Commons
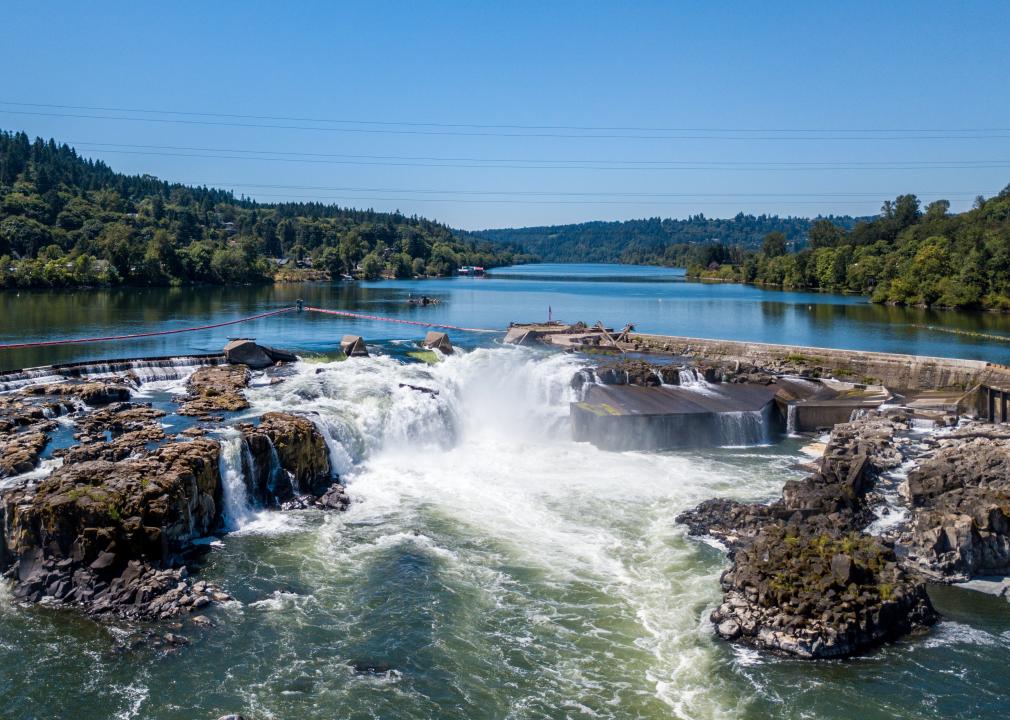
#3. Clackamas County
– 2010 to 2020 population change: 50,922
— #148 among all counties nationwide
– 2010 to 2020 percent population change: +13.7%
— #7 among counties in Oregon, #359 among all counties nationwide
– 2020 population: 421,401
— #3 largest county in Oregon, #169 largest county nationwide

M.O. Stevens // Wikimedia Commons
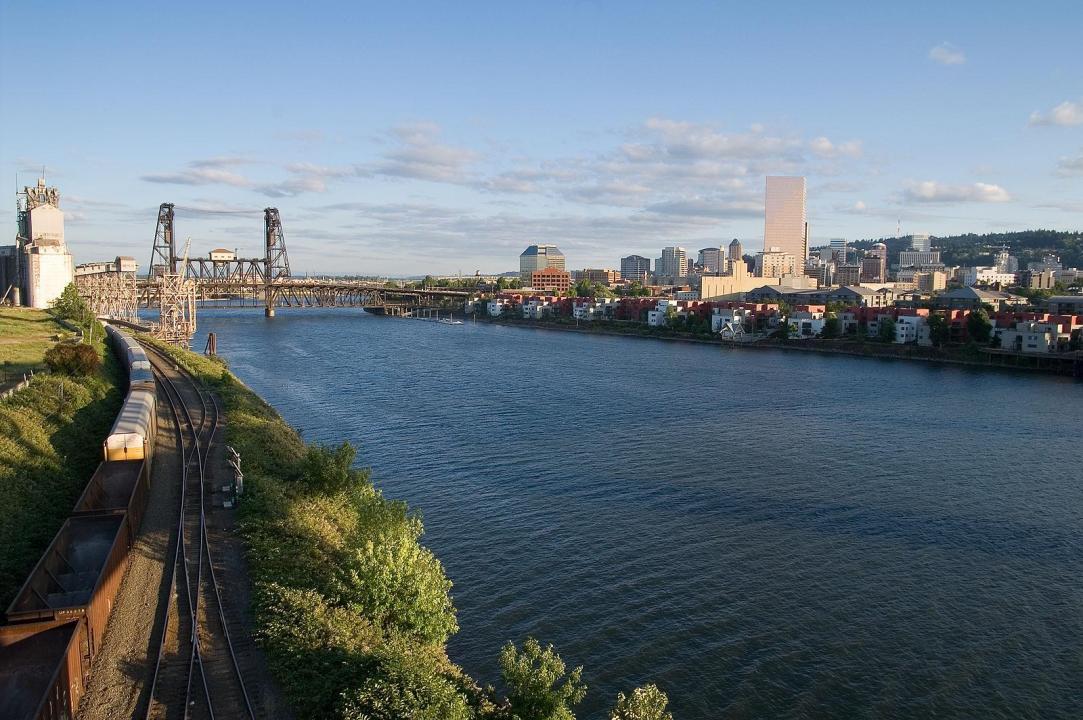
#2. Washington County
– 2010 to 2020 population change: 83,707
— #88 among all counties nationwide
– 2010 to 2020 percent population change: +16.2%
— #3 among counties in Oregon, #275 among all counties nationwide
– 2020 population: 600,372
— #2 largest county in Oregon, #114 largest county nationwide
Stuart Seeger // Wikicommons
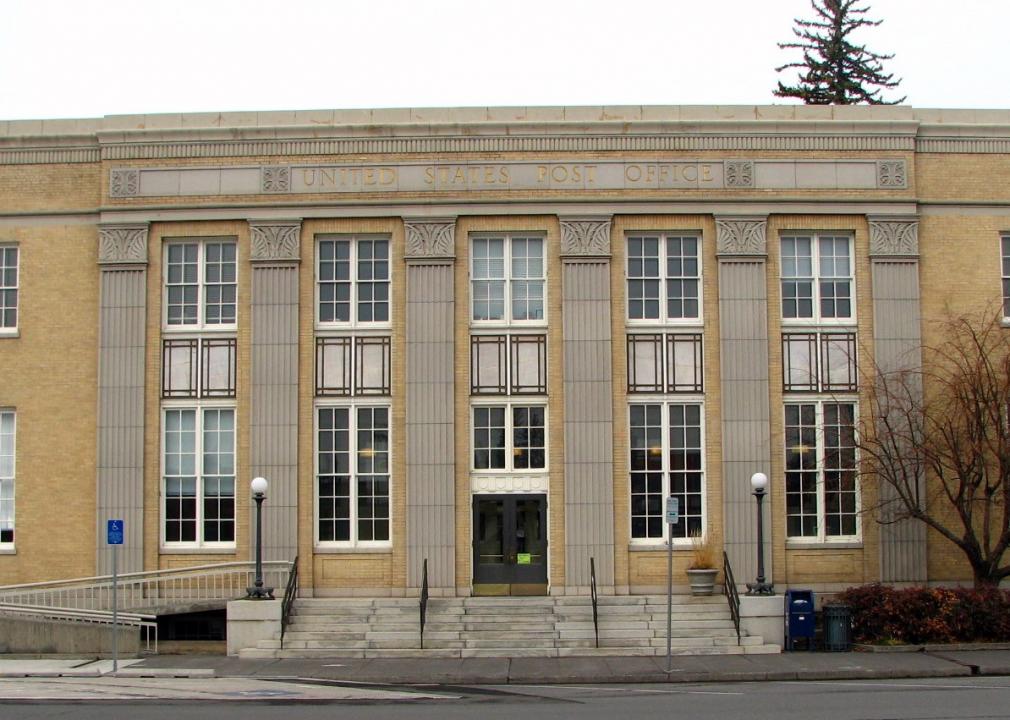
#1. Multnomah County
– 2010 to 2020 population change: 103,392
— #57 among all counties nationwide
– 2010 to 2020 percent population change: +14.5%
— #6 among counties in Oregon, #335 among all counties nationwide
– 2020 population: 815,428
— #1 largest county in Oregon, #79 largest county nationwide
