Counties with the most emergency shelters in Oregon

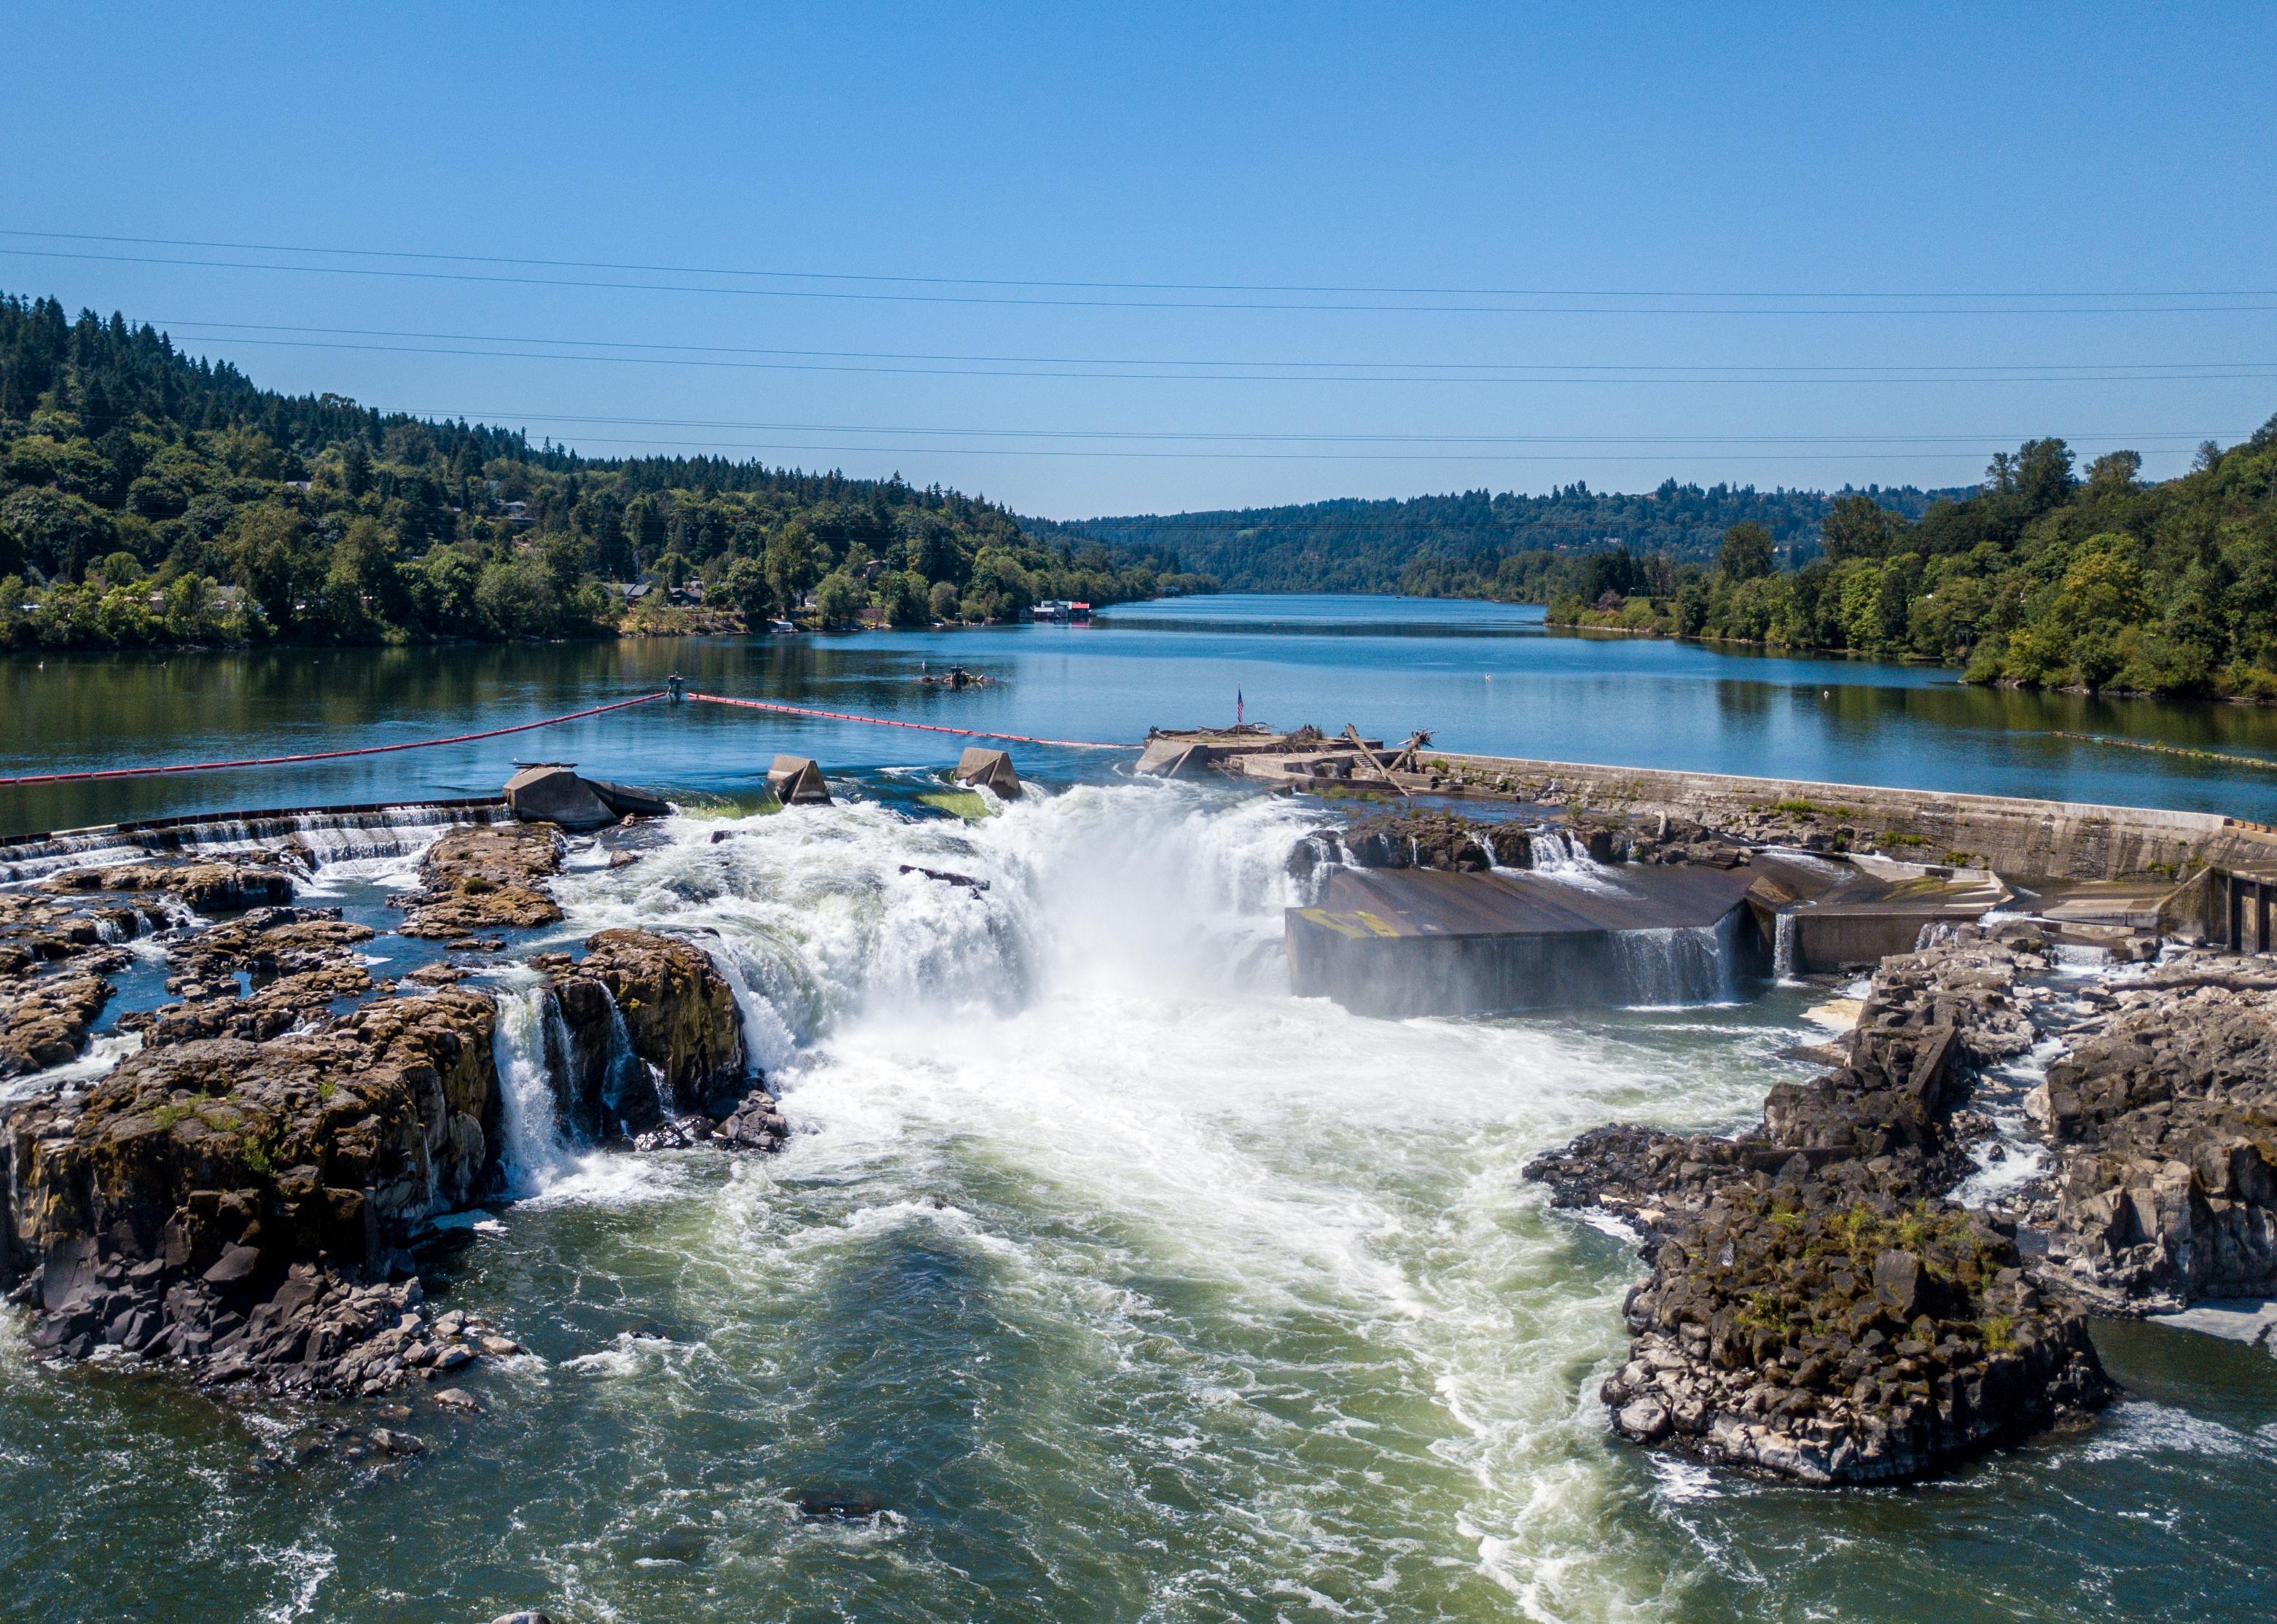
Tomas Nevesely // Shutterstock
Counties with the most emergency shelters in Oregon
As climate change drives weather to greater extremes, and devastating hurricanes, wildfires, droughts, and blizzards preoccupy an increasing number of Americans, it is hard to avoid comparing the reality of everyday news coverage to the computer-generated images seen in disaster movies.
Over the last 50 years, natural disasters have become five times more common due to climate change, according to the World Meteorological Organization. They’ve also become more economically debilitating—the five most expensive climate disasters in American history have all taken place over the last two decades.
The increasing frequency and severity of natural disasters means that the need for emergency evacuation and shelter plans has never been greater. According to the Federal Emergency Management Association, understanding your climate risk, or proximity to probable natural disaster, is an important first step for making a plan. Tools like the Climate Mapping for Resilience and Adaptation allow you to assess your risk by location.
Knowing where nearby emergency shelters are located is another way to prepare for the worst. In the event of flooding, hurricane-level winds, or other disasters, emergency shelters offer a place to sleep, and also often provide food, water, and first aid services. Stacker examined the Department of Homeland Security’s National Shelter System Facilities database to identify the counties with the most emergency shelters in Oregon. Counties are ranked by emergency shelters per 100K people, with total capacity per 100K people serving as a tiebreaker.
![]()
Ken Lund // Wikimedia Commons
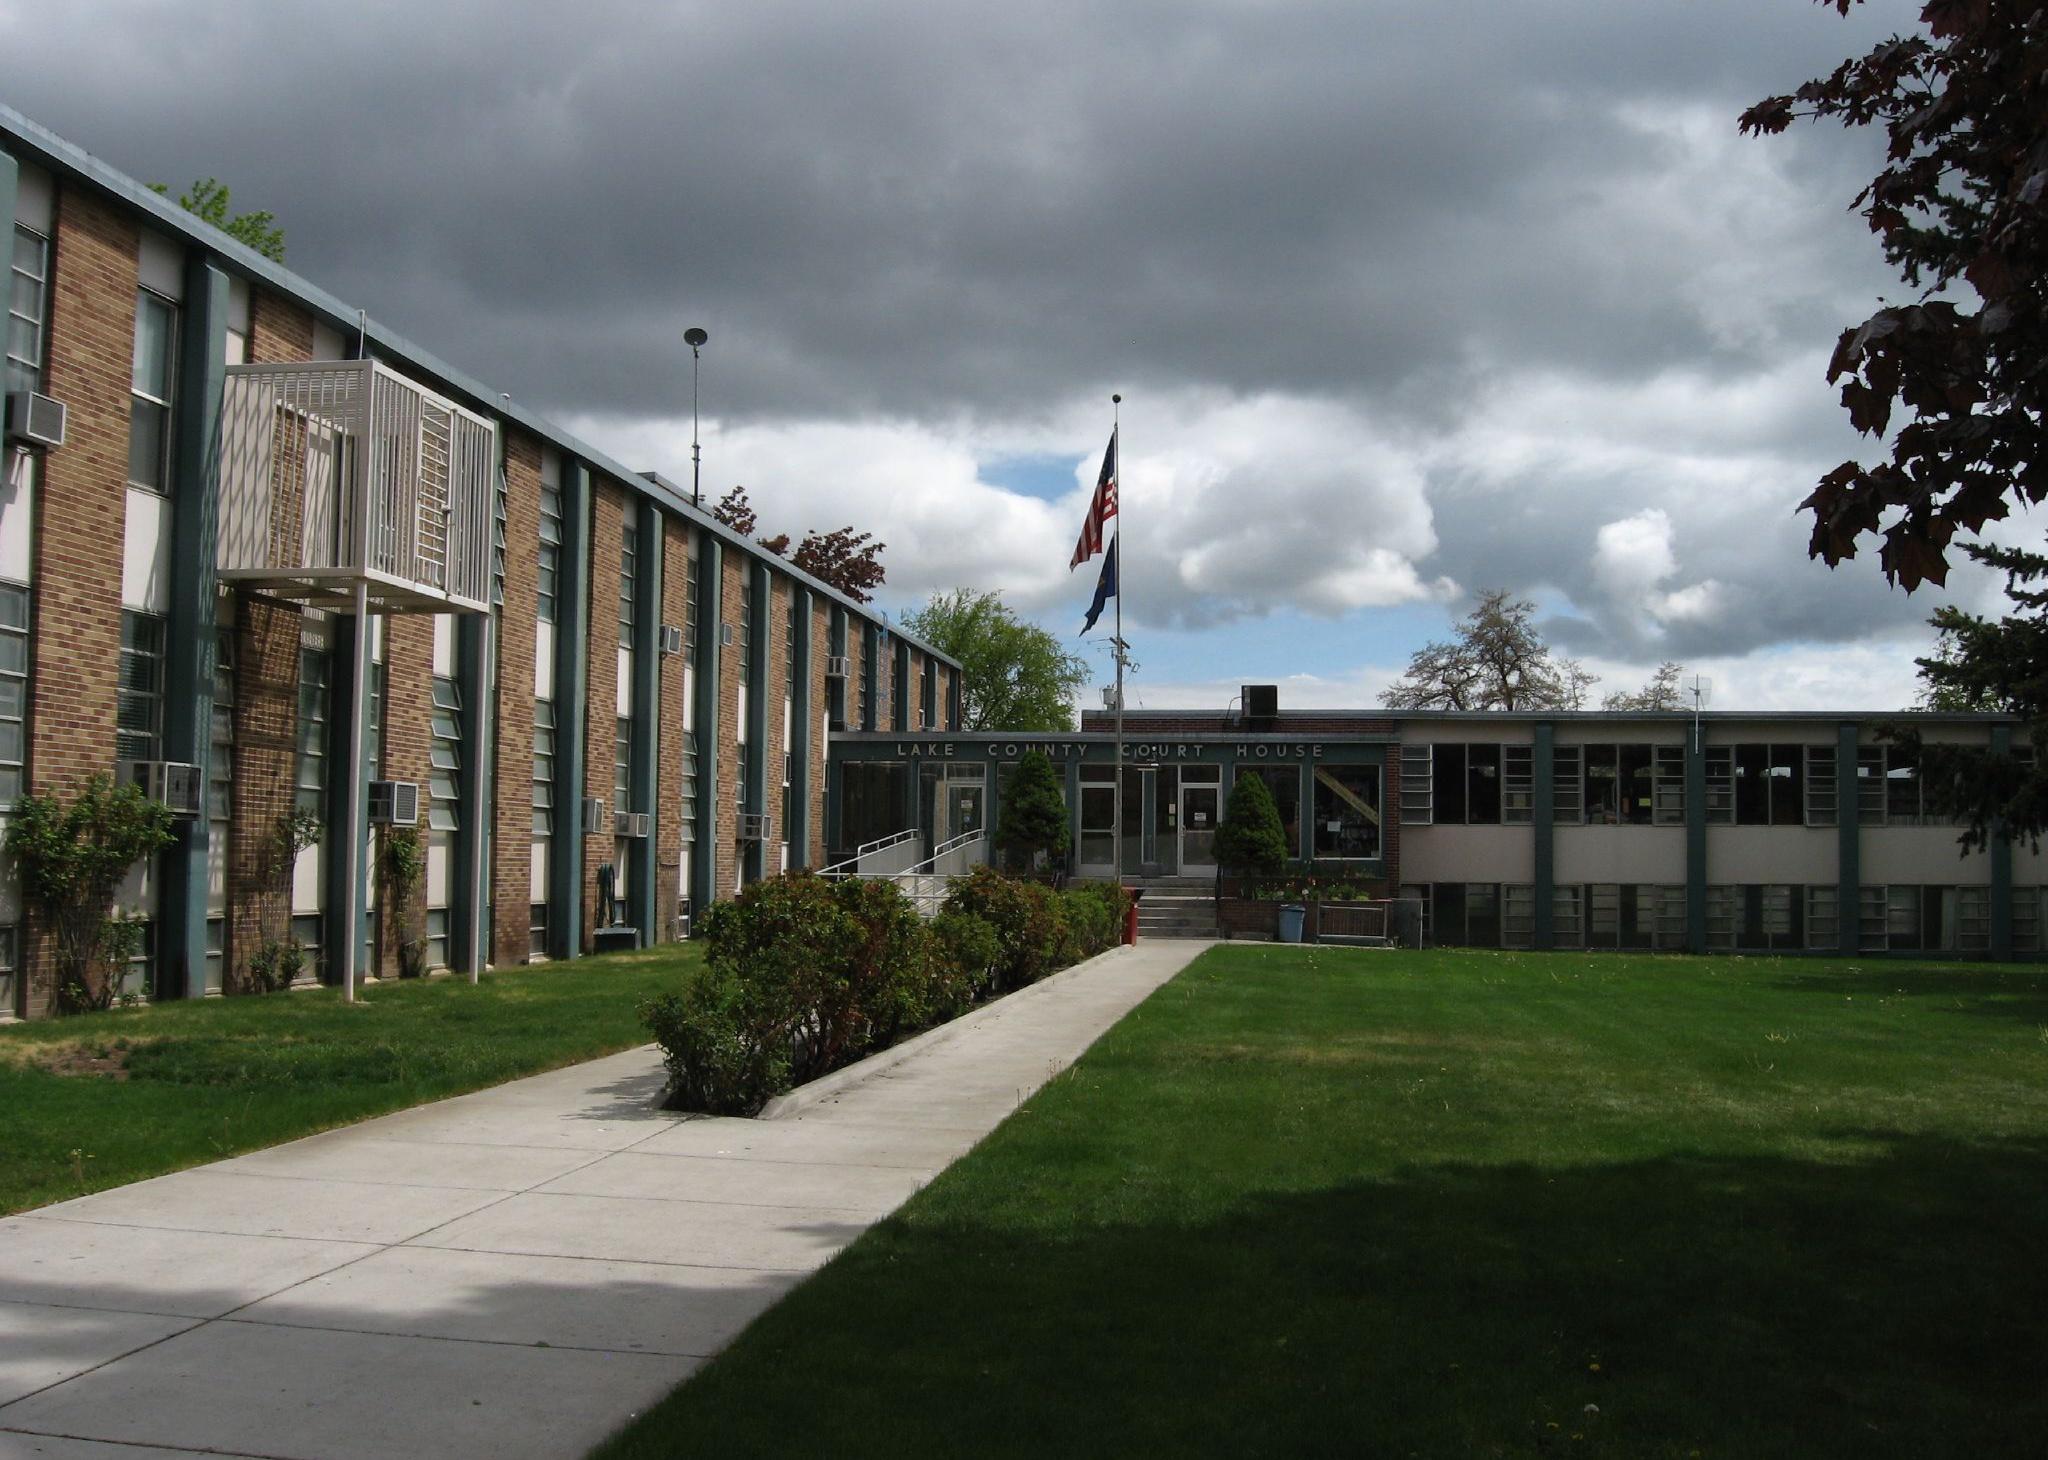
#36. Lake County
– Emergency shelters per 100K people: 12.3 (1 shelters in database)
– Emergency shelter capacity per 100K: 4,278,815 people (347,397 total capacity)
– Shelters with generators: 0
– Shelters in 100-year floodplain: 0

Edmund Garman // Flickr
#35. Marion County
– Emergency shelters per 100K people: 16.0 (55 shelters in database)
– Emergency shelter capacity per 100K: 3,413,738 people (11,744,522 total capacity)
– Shelters with generators: 6
– Shelters in 100-year floodplain: 0
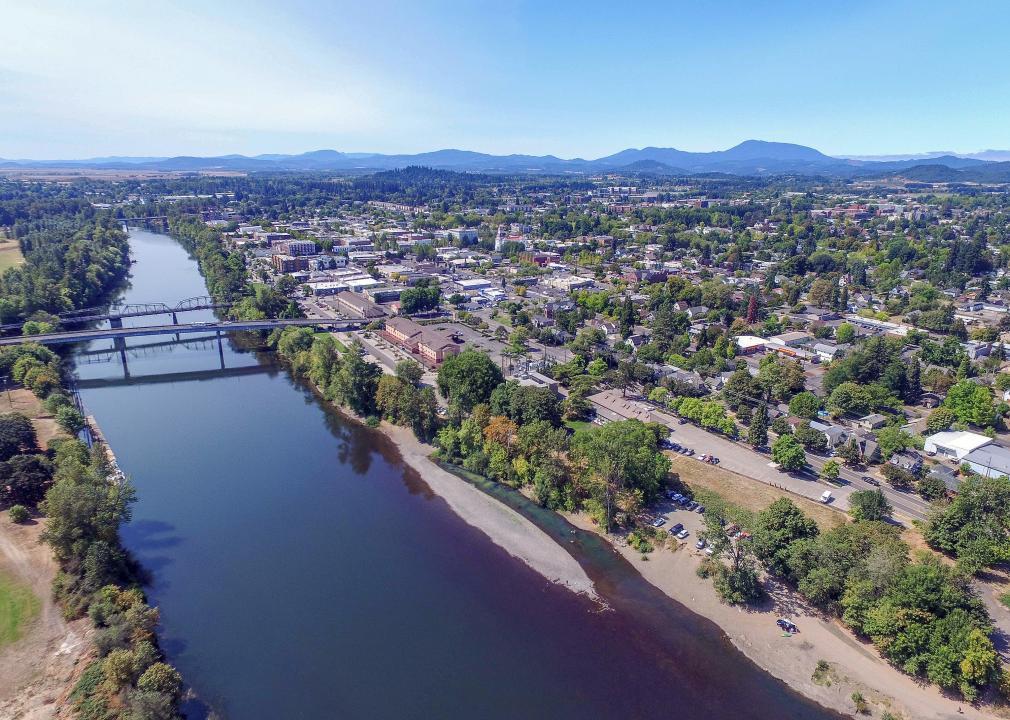
Bruce Fingerhood from Springfield, Oregon, US // Wikimedia Commons
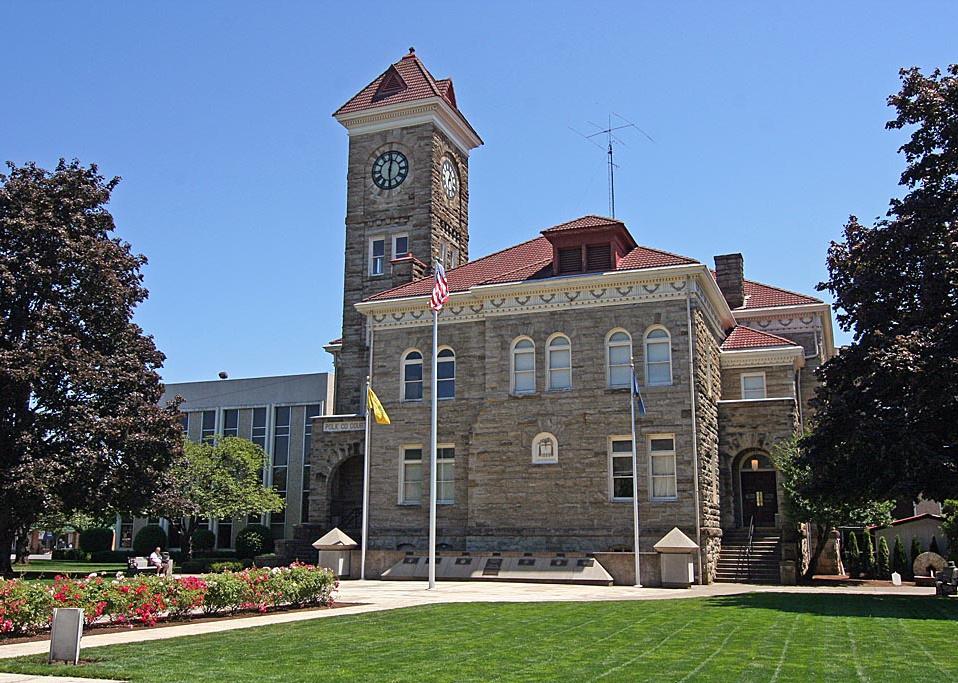
#34. Polk County
– Emergency shelters per 100K people: 19.7 (17 shelters in database)
– Emergency shelter capacity per 100K: 3,416,929 people (2,950,416 total capacity)
– Shelters with generators: 1
– Shelters in 100-year floodplain: 0
Stuart Seeger // Wikicommons
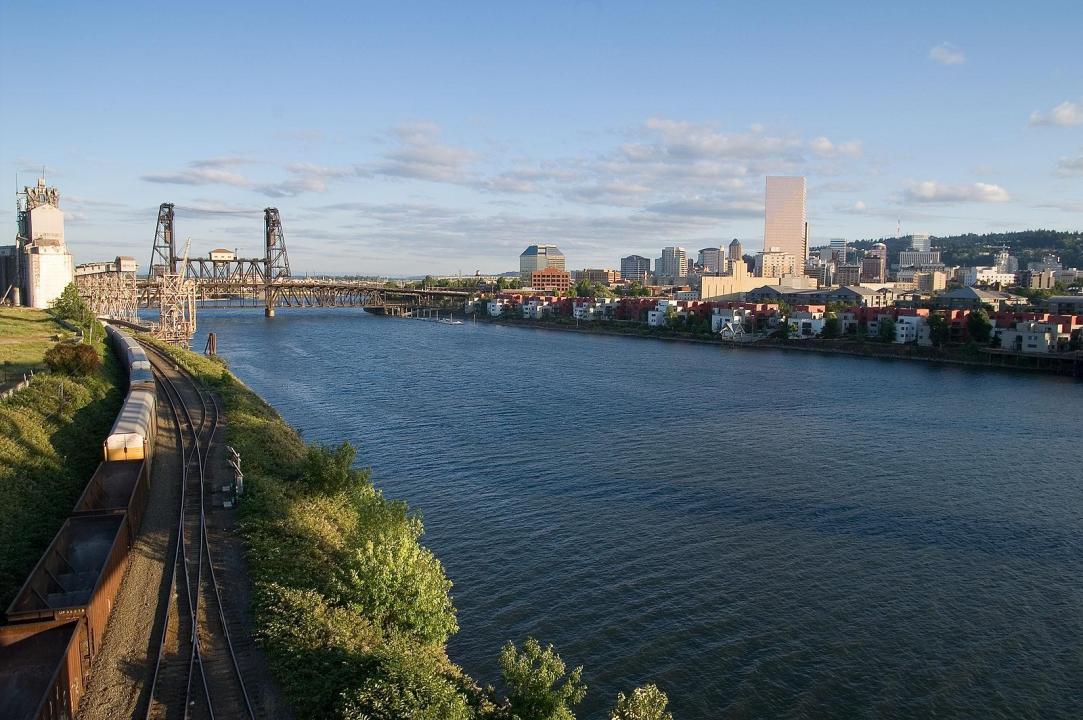
#33. Multnomah County
– Emergency shelters per 100K people: 19.8 (160 shelters in database)
– Emergency shelter capacity per 100K: 2,372,773 people (19,219,719 total capacity)
– Shelters with generators: 16
– Shelters in 100-year floodplain: 0

M.O. Stevens // Wikimedia Commons
#32. Washington County
– Emergency shelters per 100K people: 20.4 (122 shelters in database)
– Emergency shelter capacity per 100K: 2,662,656 people (15,895,232 total capacity)
– Shelters with generators: 15
– Shelters in 100-year floodplain: 1
Bobjgalindo // Wikimedia Commons
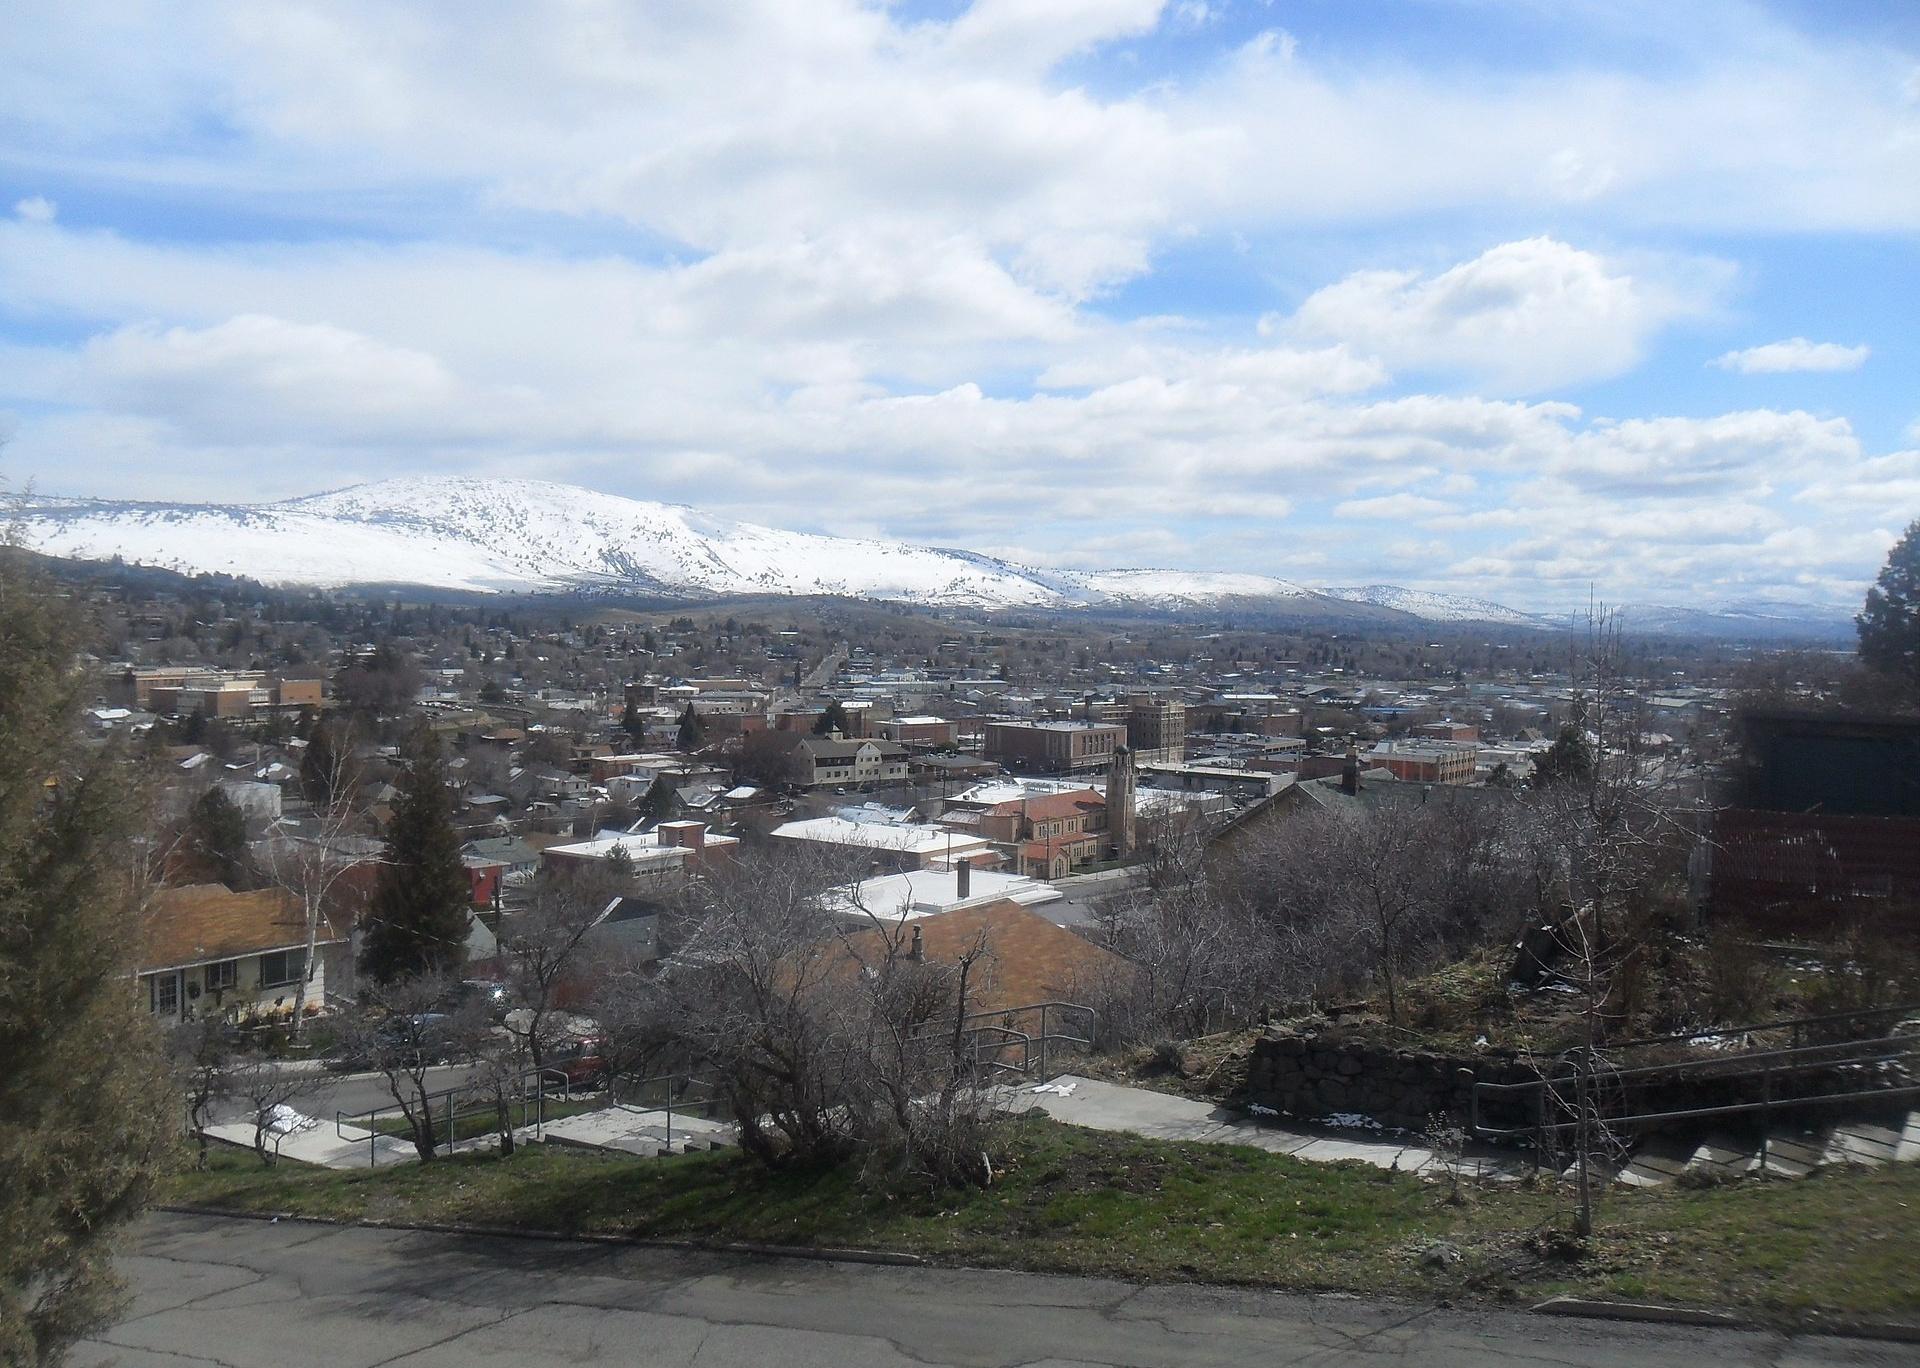
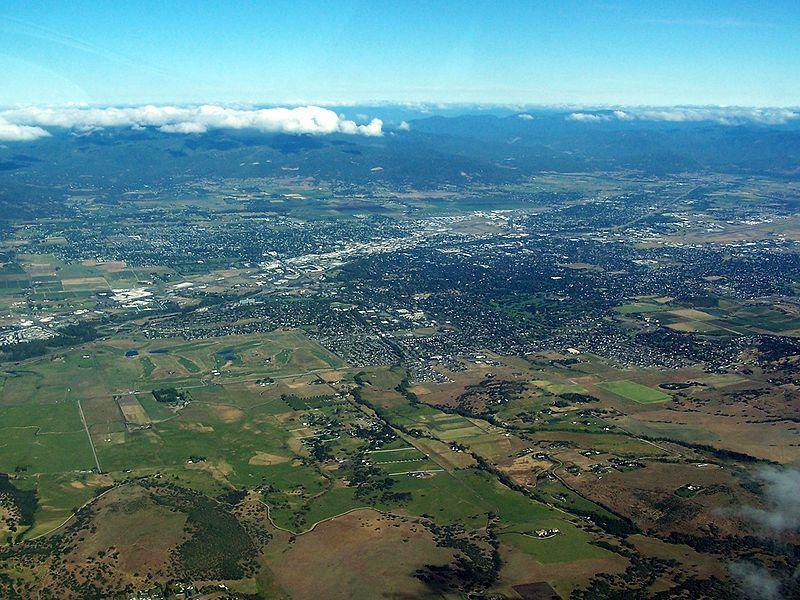
#31. Klamath County
– Emergency shelters per 100K people: 24.7 (17 shelters in database)
– Emergency shelter capacity per 100K: 8,323,700 people (5,734,946 total capacity)
– Shelters with generators: 1
– Shelters in 100-year floodplain: 0
Mrgadget51 // Wikimedia Commons
#30. Clackamas County
– Emergency shelters per 100K people: 28.7 (120 shelters in database)
– Emergency shelter capacity per 100K: 3,798,052 people (15,897,772 total capacity)
– Shelters with generators: 14
– Shelters in 100-year floodplain: 1
cpaulfell // Shutterstock
#29. Benton County
– Emergency shelters per 100K people: 35.9 (34 shelters in database)
– Emergency shelter capacity per 100K: 3,948,991 people (3,738,391 total capacity)
– Shelters with generators: 2
– Shelters in 100-year floodplain: 0
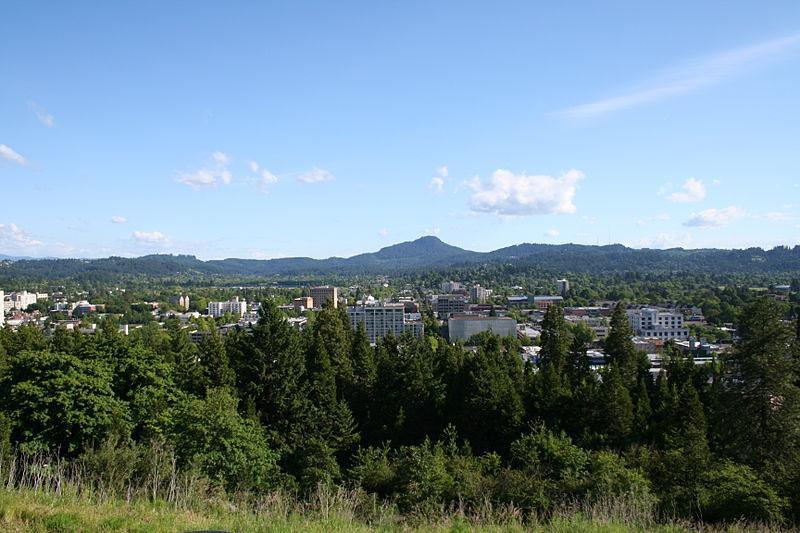
Lauram12345 // Wikicommons
#28. Lane County
– Emergency shelters per 100K people: 36.0 (137 shelters in database)
– Emergency shelter capacity per 100K: 3,711,338 people (14,122,828 total capacity)
– Shelters with generators: 39
– Shelters in 100-year floodplain: 40
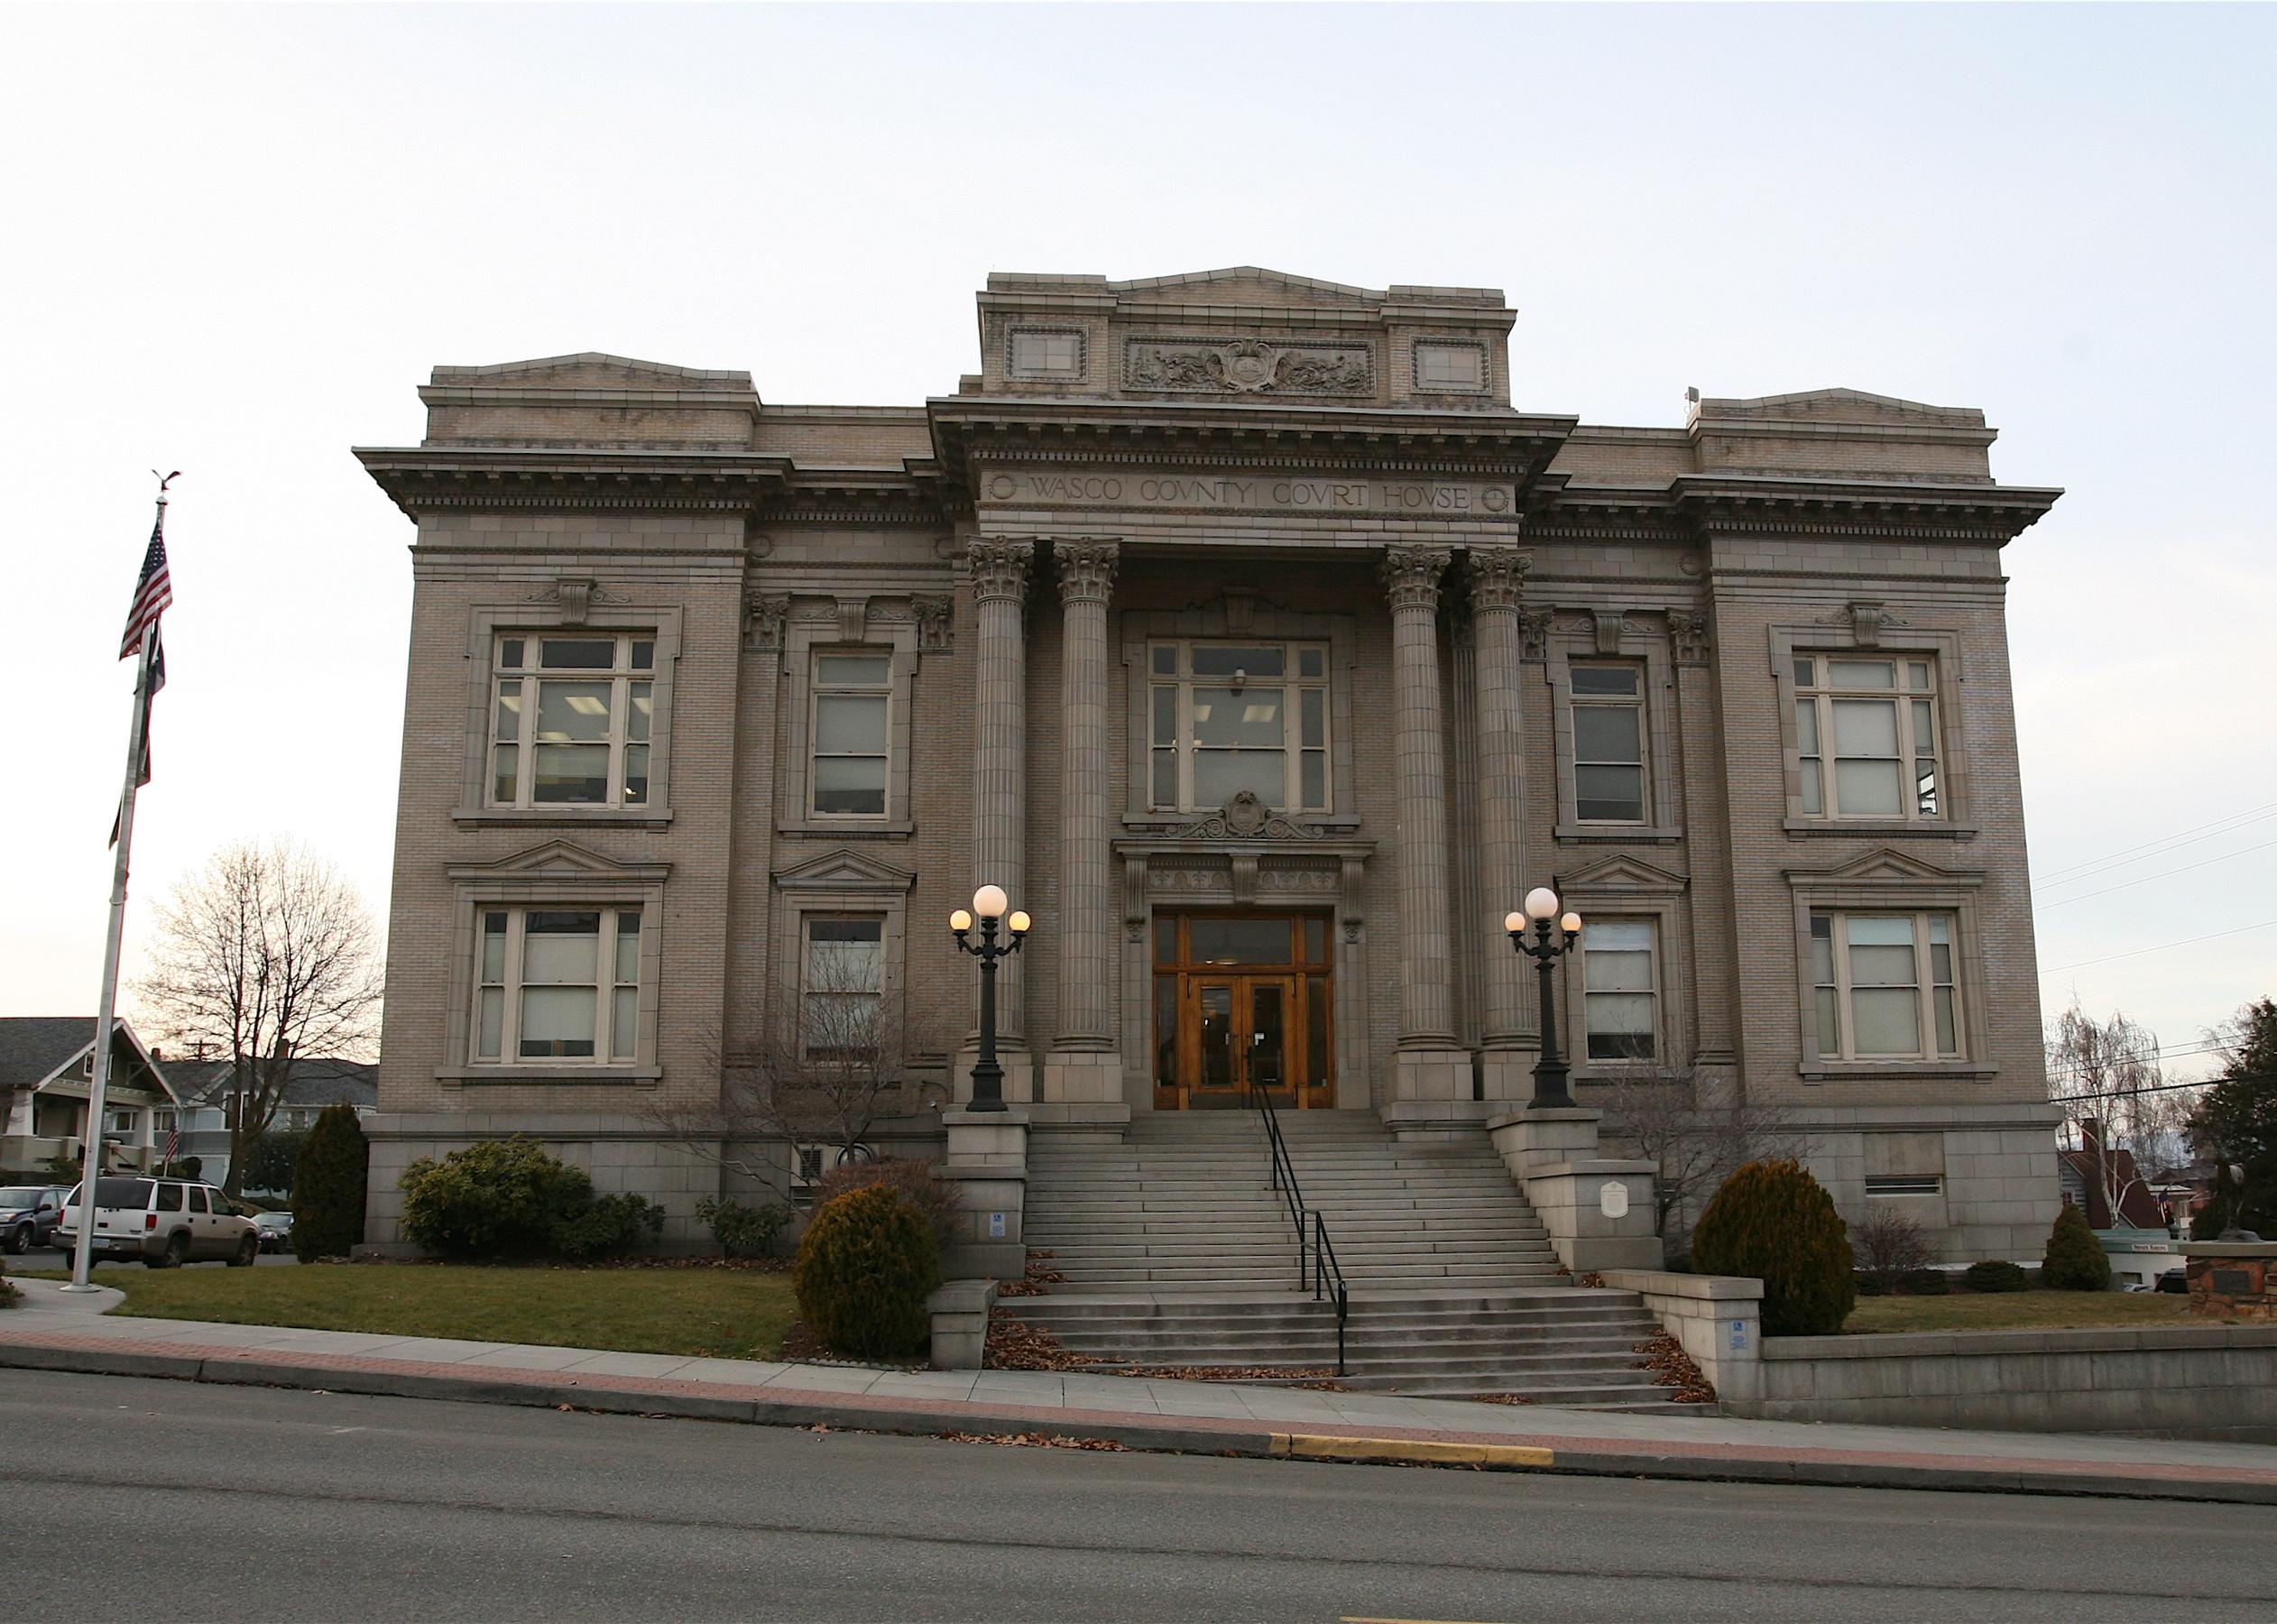
Cacophony // Wikimedia Commons
#27. Wasco County
– Emergency shelters per 100K people: 37.6 (10 shelters in database)
– Emergency shelter capacity per 100K: 13,220,622 people (3,517,082 total capacity)
– Shelters with generators: 2
– Shelters in 100-year floodplain: 0
Ian Poellet // Wikimedia Commons
#26. Deschutes County
– Emergency shelters per 100K people: 41.0 (80 shelters in database)
– Emergency shelter capacity per 100K: 5,735,911 people (11,182,962 total capacity)
– Shelters with generators: 9
– Shelters in 100-year floodplain: 0
Ken Lund from Reno, Nevada, USA // Wikimedia Commons
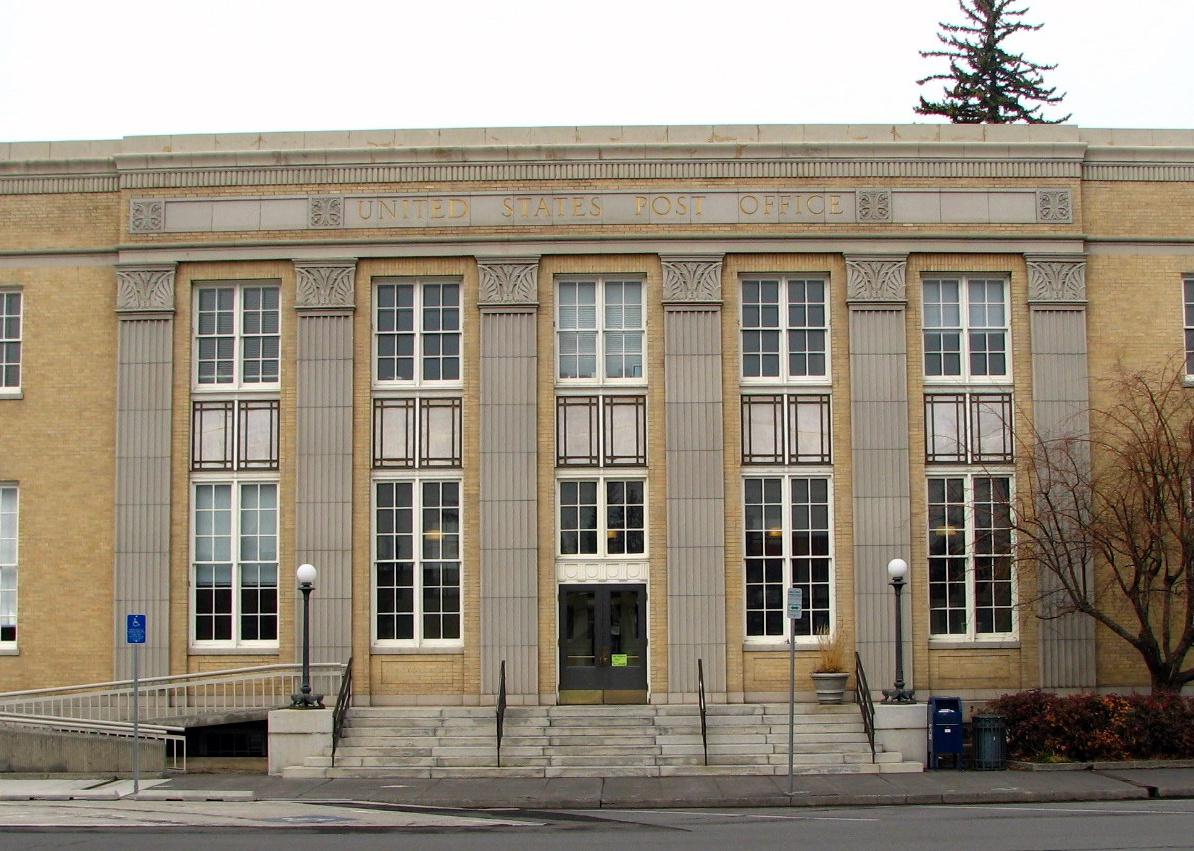
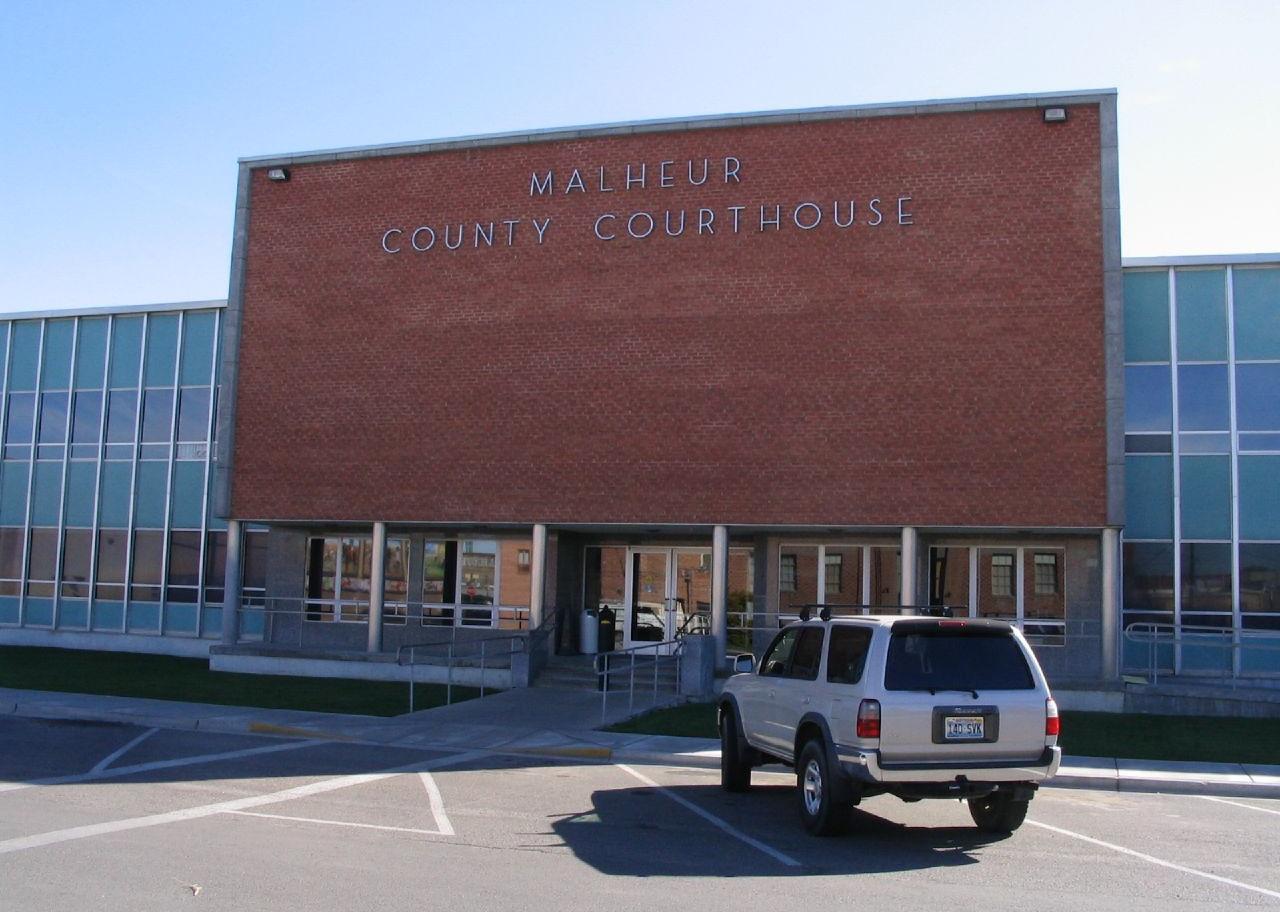
#25. Malheur County
– Emergency shelters per 100K people: 47.9 (15 shelters in database)
– Emergency shelter capacity per 100K: 4,599,812 people (1,440,339 total capacity)
– Shelters with generators: 0
– Shelters in 100-year floodplain: 0
Jmabel // Wikimedia Commons
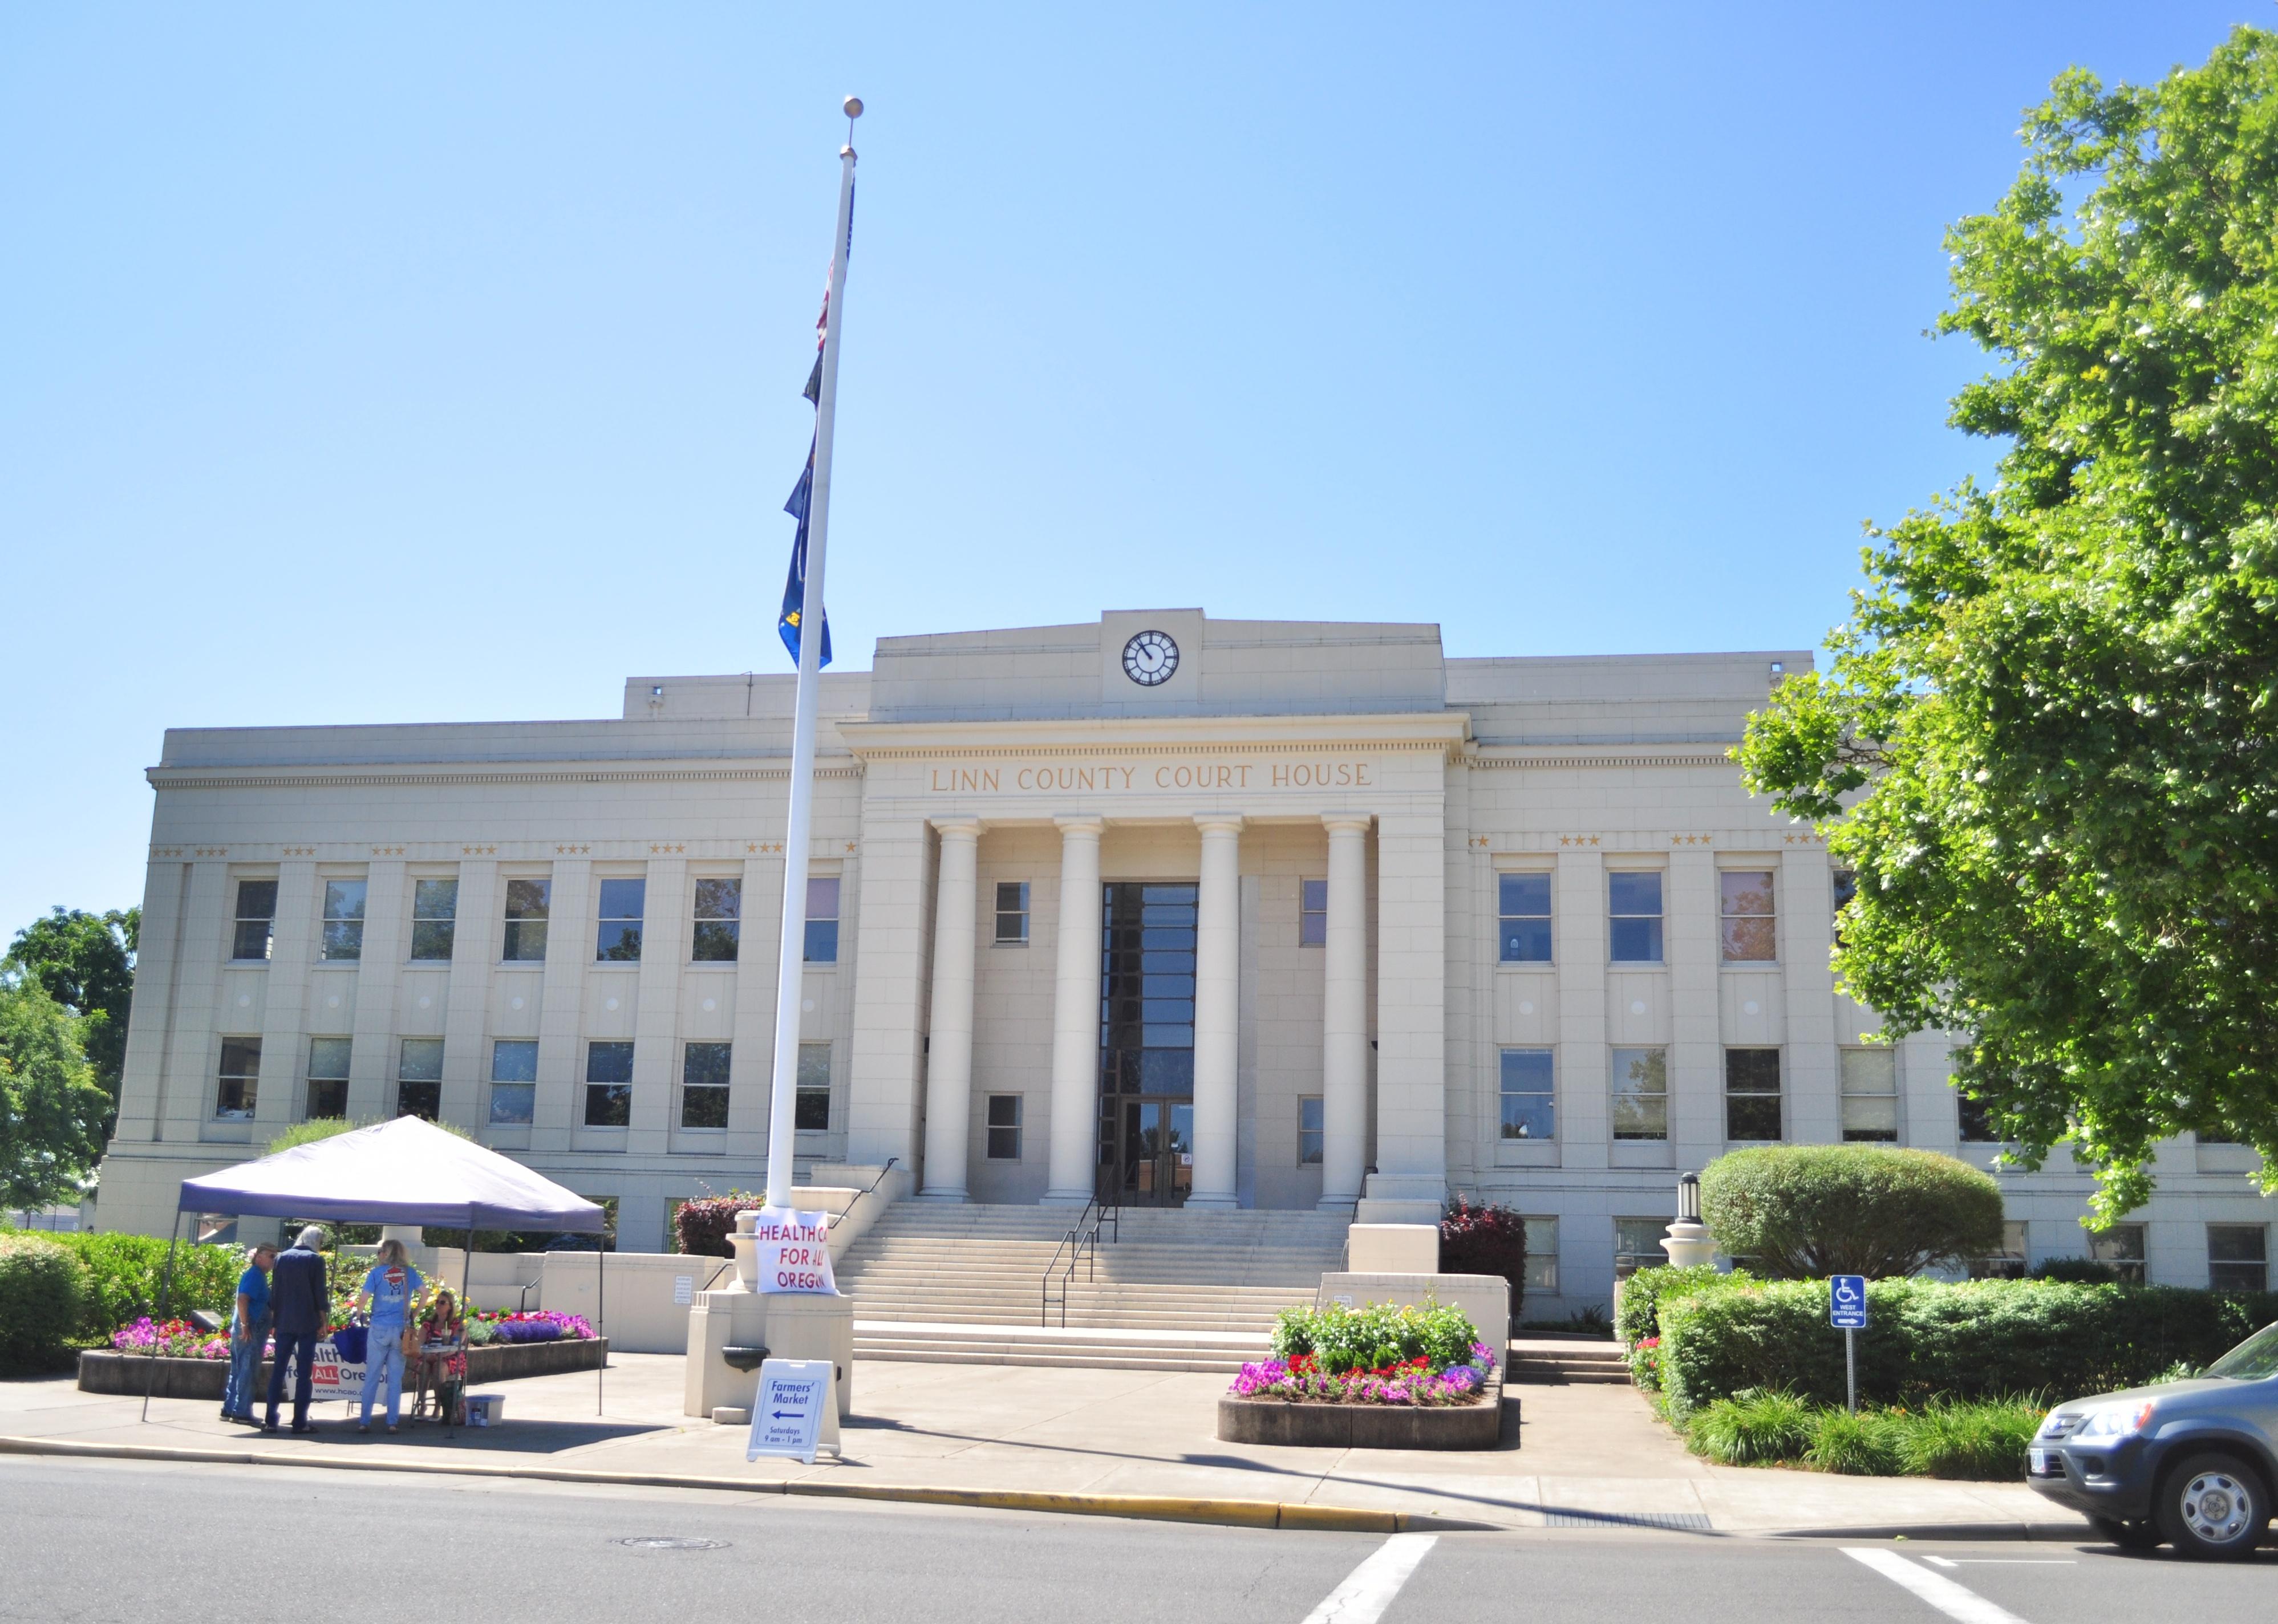
#24. Linn County
– Emergency shelters per 100K people: 49.5 (63 shelters in database)
– Emergency shelter capacity per 100K: 6,005,432 people (7,638,910 total capacity)
– Shelters with generators: 2
– Shelters in 100-year floodplain: 2
Joseph Novak // Wikicommons
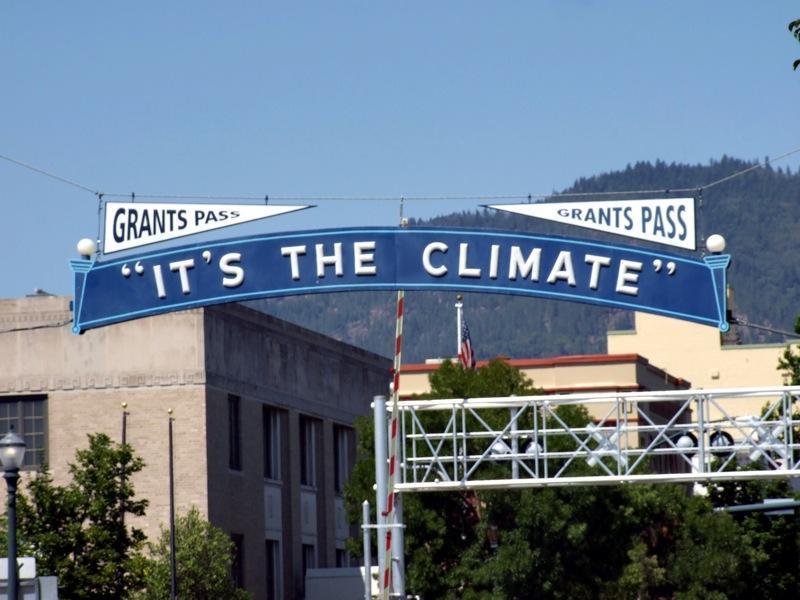
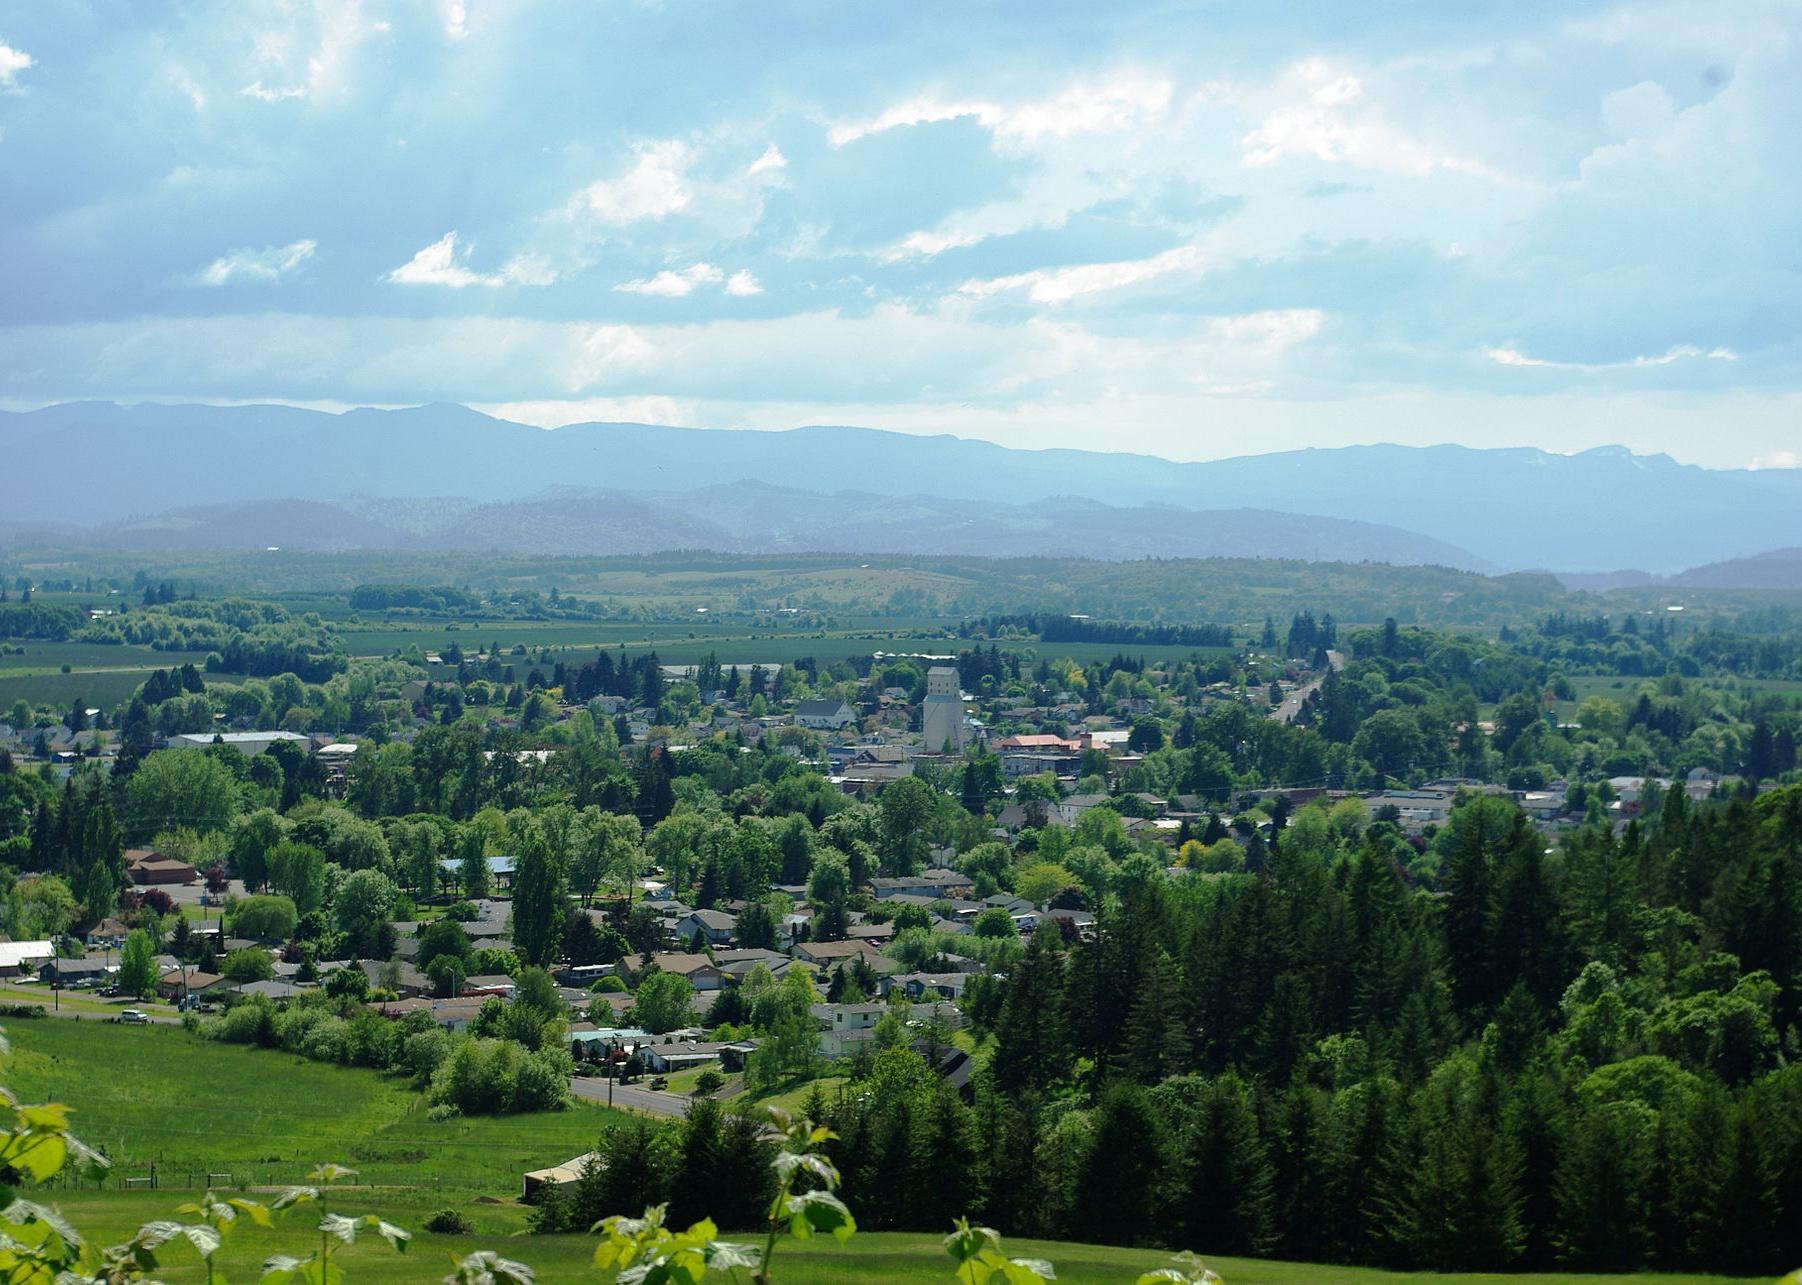
#23. Josephine County
– Emergency shelters per 100K people: 51.3 (45 shelters in database)
– Emergency shelter capacity per 100K: 9,126,241 people (8,002,436 total capacity)
– Shelters with generators: 1
– Shelters in 100-year floodplain: 0
Little Mountain 5 // Wikicommons
#22. Jackson County
– Emergency shelters per 100K people: 51.9 (115 shelters in database)
– Emergency shelter capacity per 100K: 6,714,392 people (14,883,255 total capacity)
– Shelters with generators: 9
– Shelters in 100-year floodplain: 0
M.O. Stevens // Wikimedia Commons
#21. Yamhill County
– Emergency shelters per 100K people: 53.3 (57 shelters in database)
– Emergency shelter capacity per 100K: 5,908,711 people (6,323,739 total capacity)
– Shelters with generators: 12
– Shelters in 100-year floodplain: 0
Finetooth // Wikimedia Commons
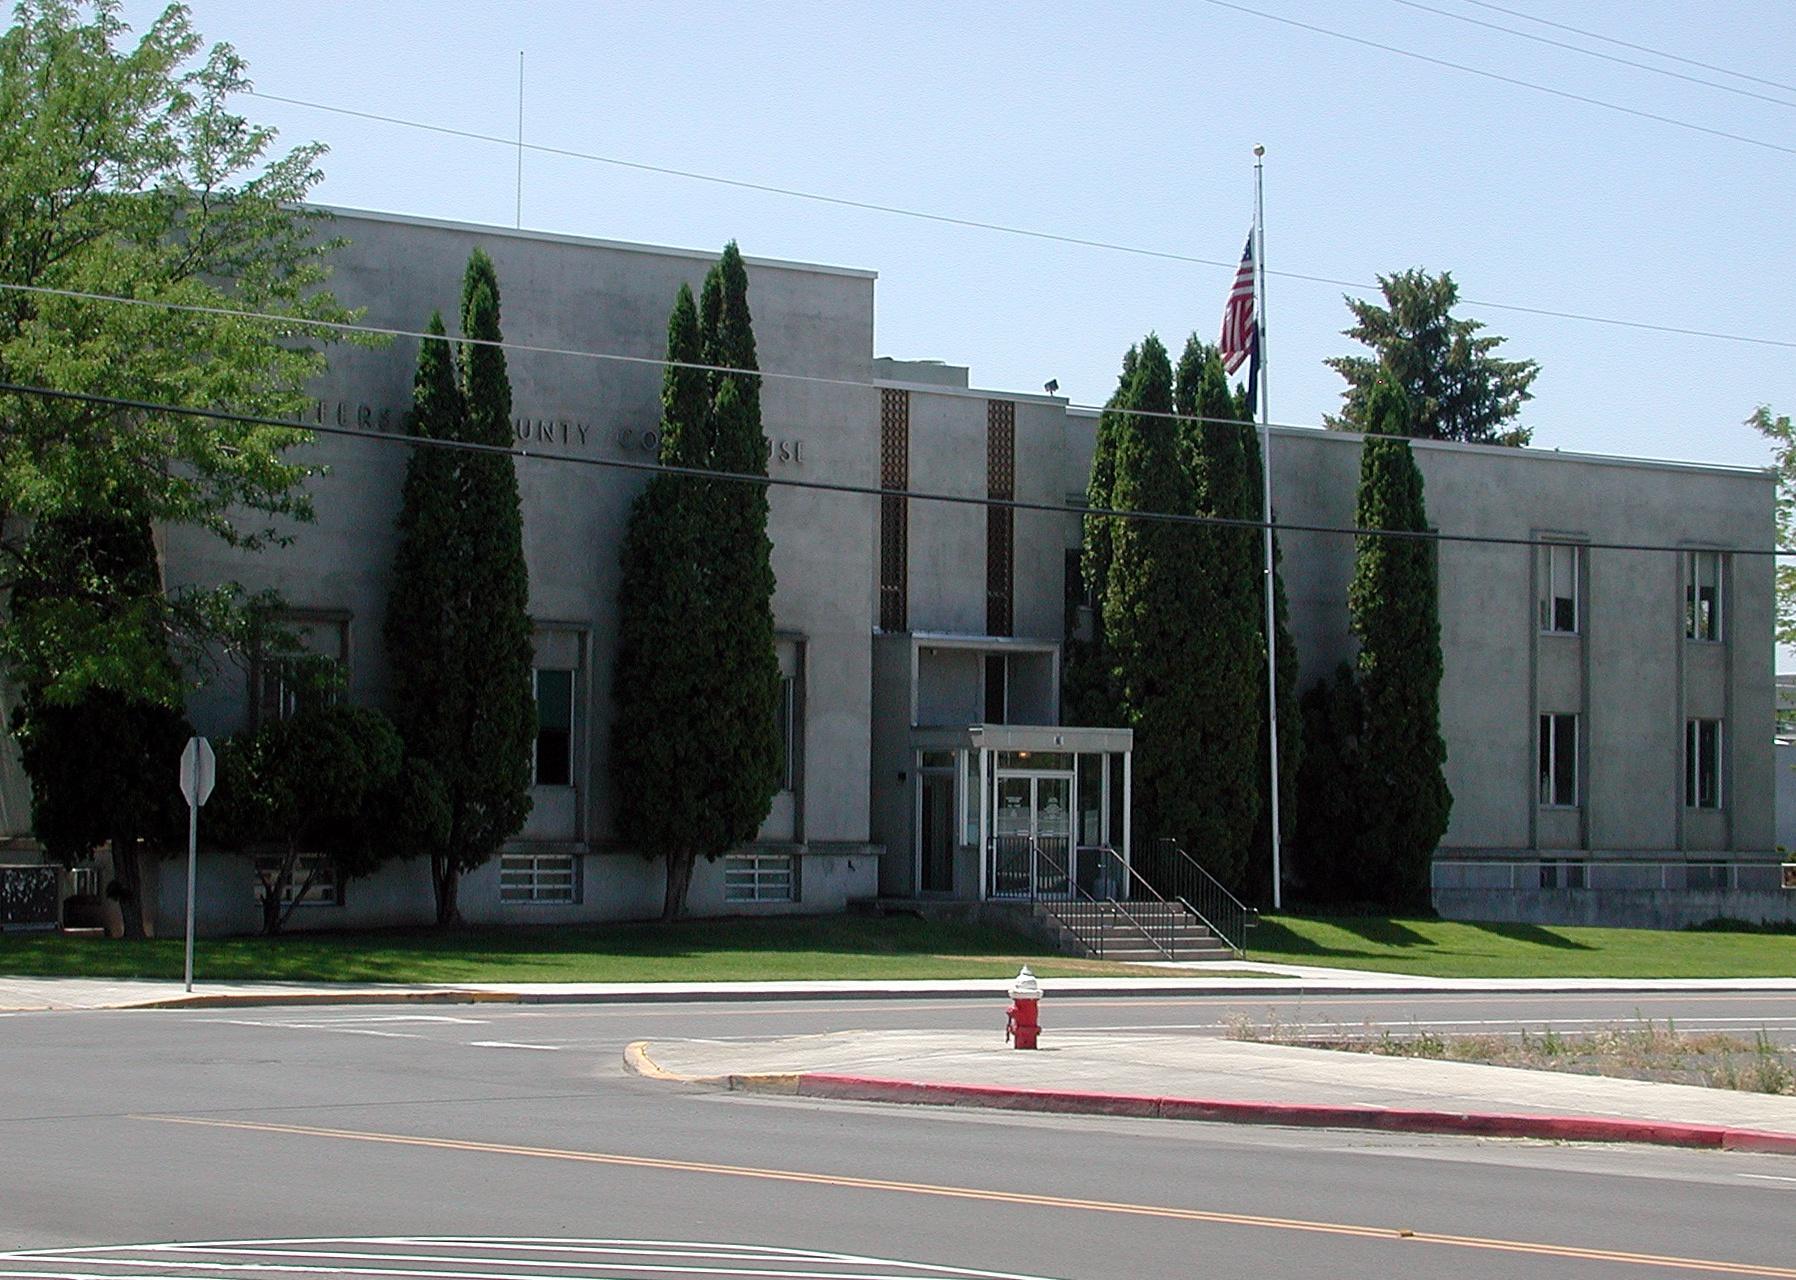
#20. Jefferson County
– Emergency shelters per 100K people: 53.6 (13 shelters in database)
– Emergency shelter capacity per 100K: 7,417,762 people (1,797,472 total capacity)
– Shelters with generators: 0
– Shelters in 100-year floodplain: 0
EncMstr // Wikimedia Commons
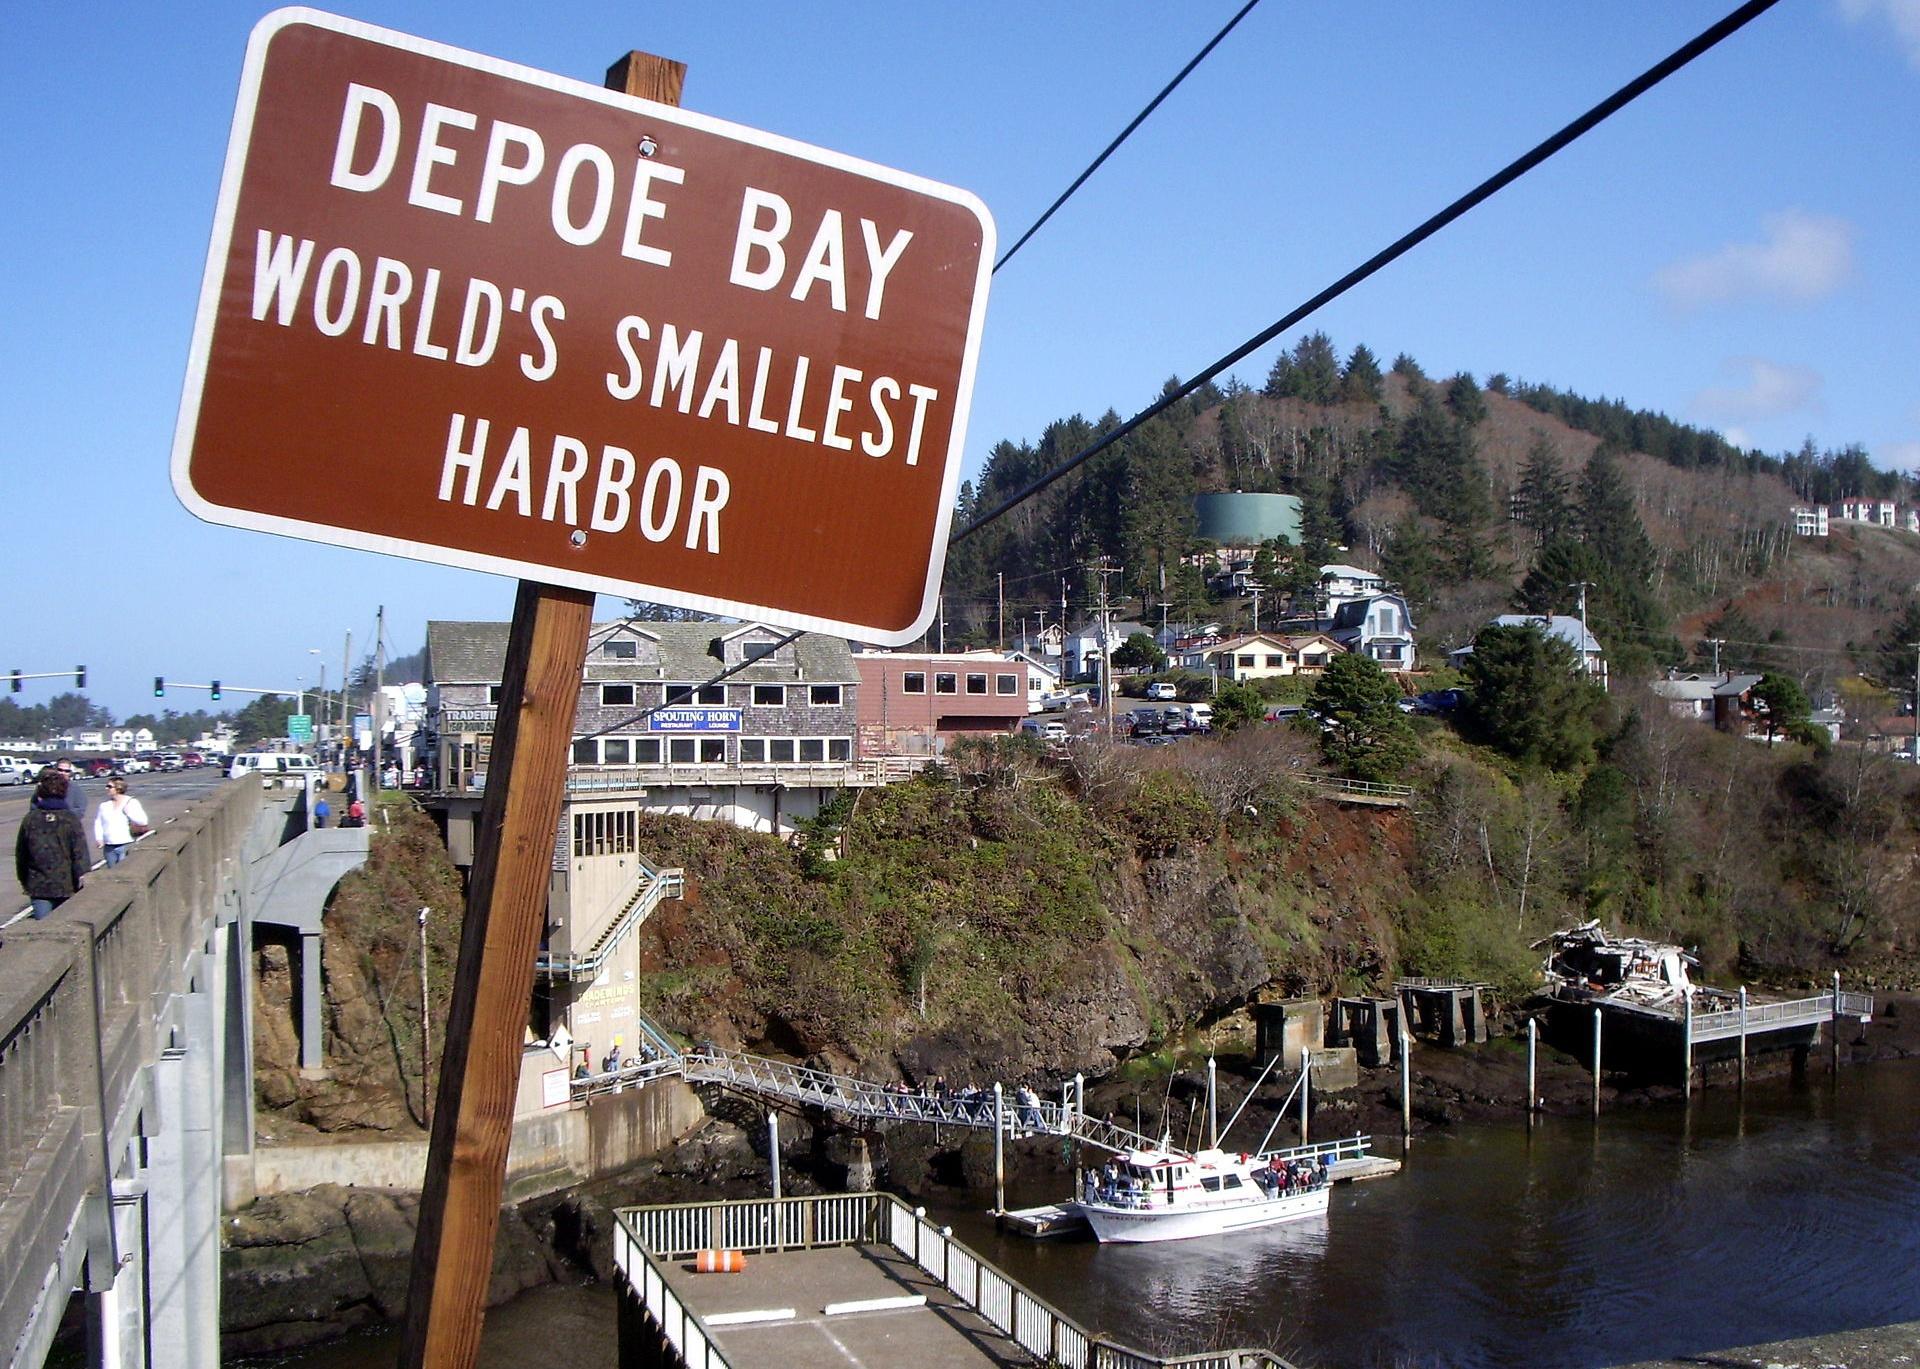
#19. Lincoln County
– Emergency shelters per 100K people: 54.1 (27 shelters in database)
– Emergency shelter capacity per 100K: 12,817,316 people (6,391,483 total capacity)
– Shelters with generators: 3
– Shelters in 100-year floodplain: 1
Cacophony // Wikimedia Commons
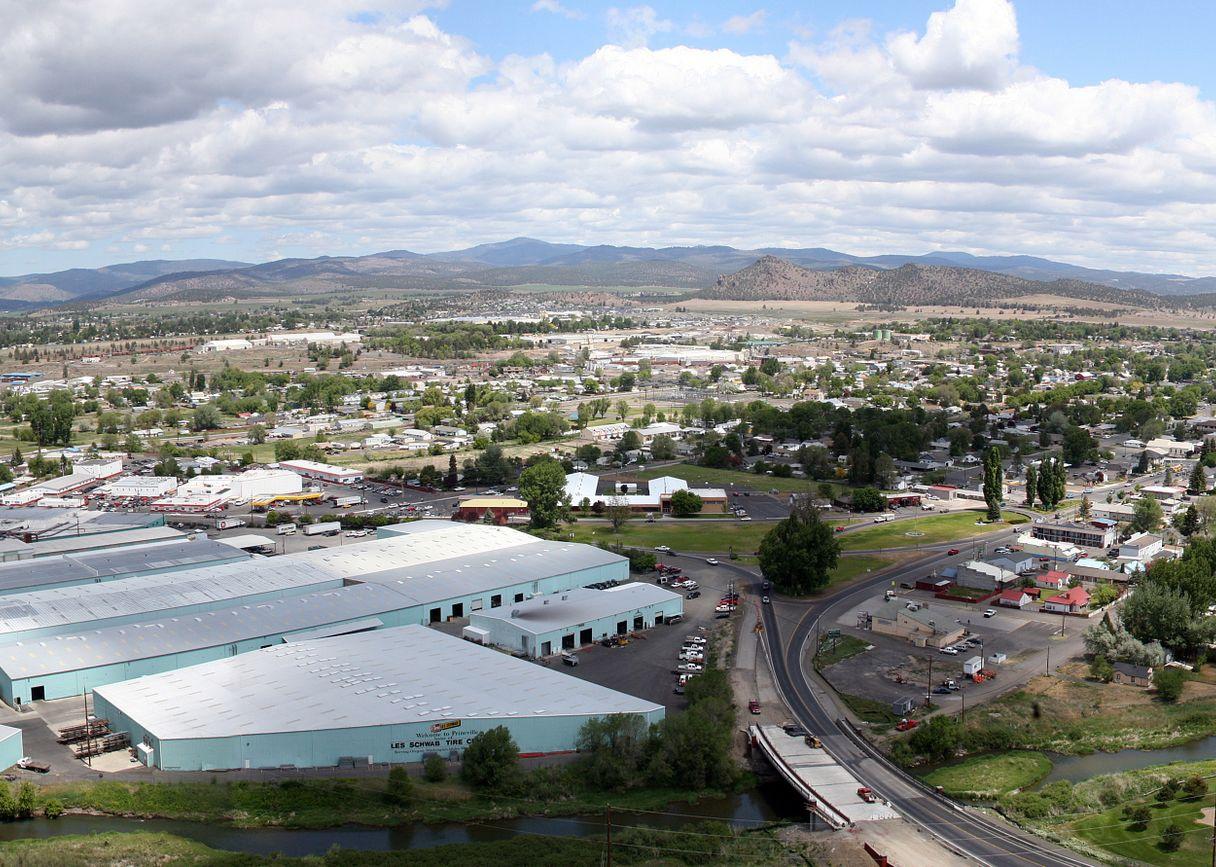
#18. Crook County
– Emergency shelters per 100K people: 57.6 (14 shelters in database)
– Emergency shelter capacity per 100K: 7,885,247 people (1,916,115 total capacity)
– Shelters with generators: 1
– Shelters in 100-year floodplain: 0
Finetooth // Wikimedia Commons
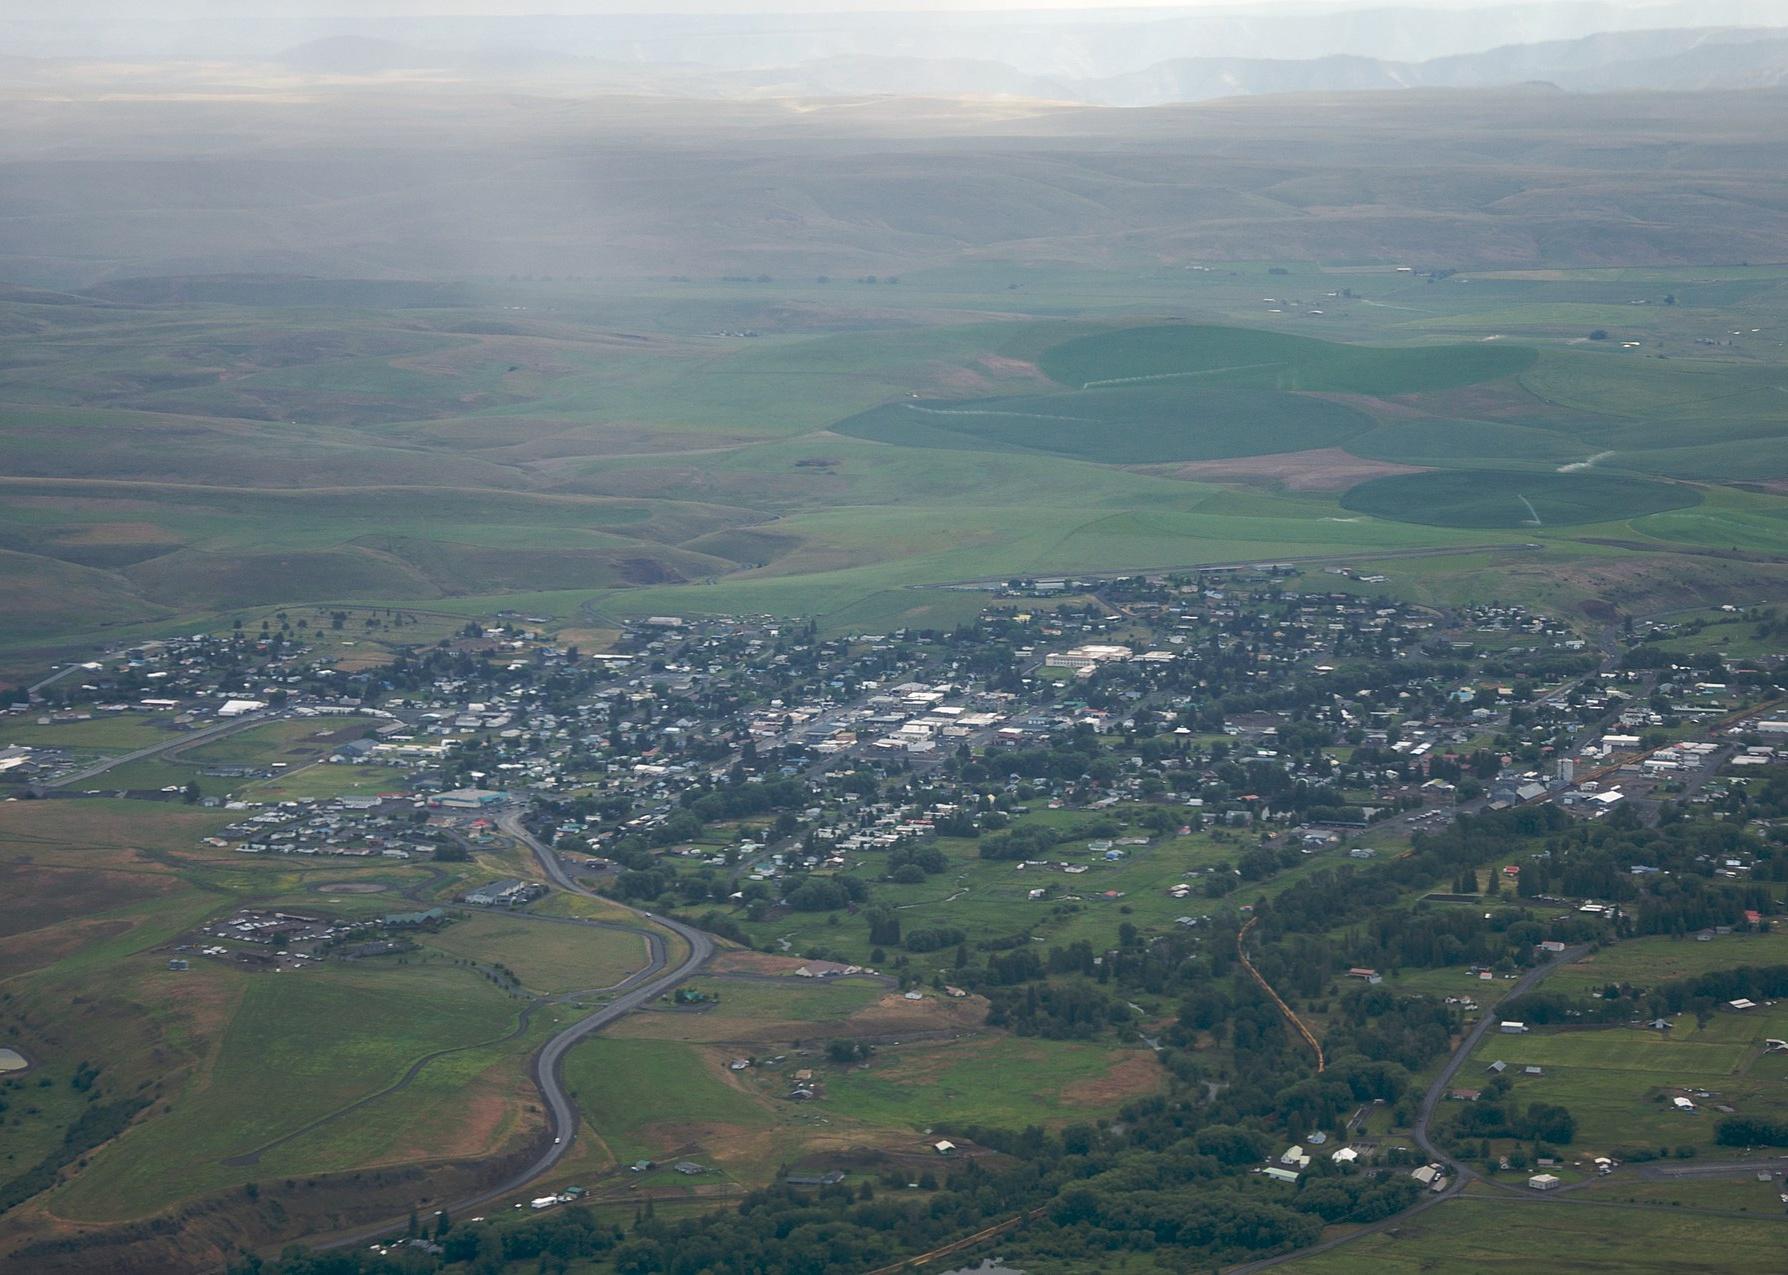
#17. Morrow County
– Emergency shelters per 100K people: 66.9 (8 shelters in database)
– Emergency shelter capacity per 100K: 19,289,744 people (2,307,825 total capacity)
– Shelters with generators: 0
– Shelters in 100-year floodplain: 0
Sam Beebe // Wikimedia Commons
#16. Wallowa County
– Emergency shelters per 100K people: 68.2 (5 shelters in database)
– Emergency shelter capacity per 100K: 24,124,707 people (1,768,341 total capacity)
– Shelters with generators: 0
– Shelters in 100-year floodplain: 0
Gancayco // Wikimedia Commons
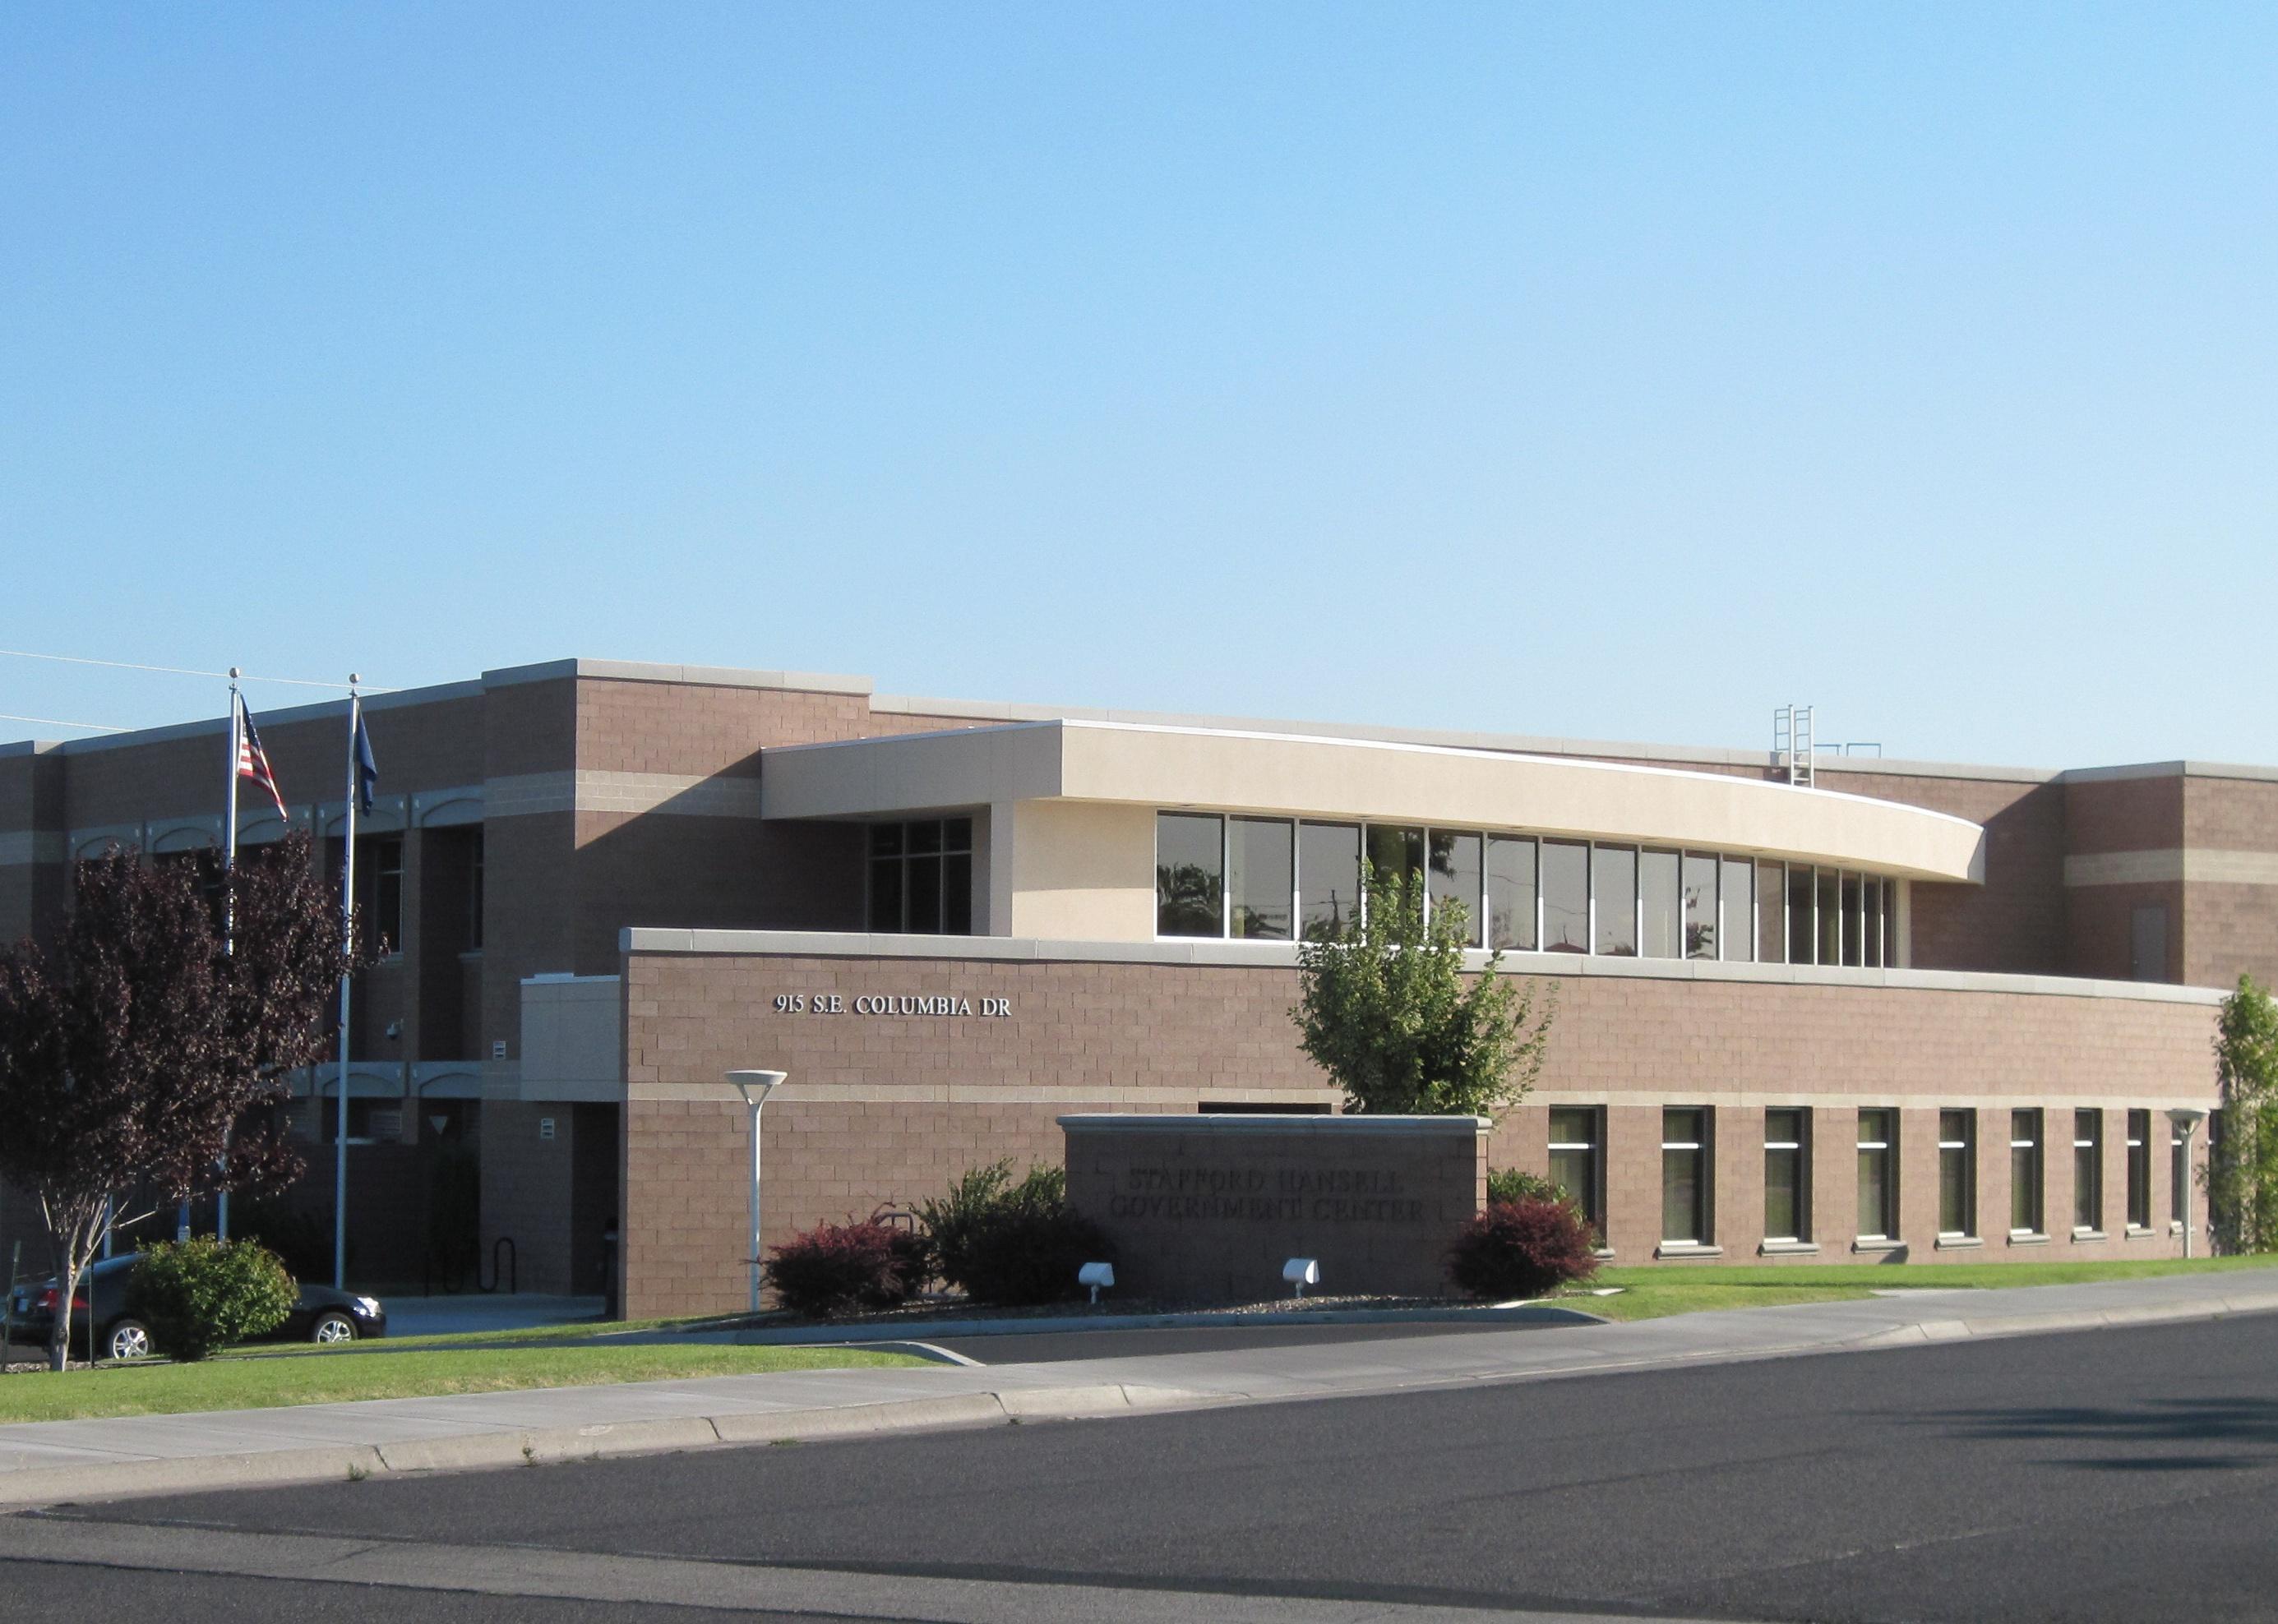
#15. Umatilla County
– Emergency shelters per 100K people: 71.7 (57 shelters in database)
– Emergency shelter capacity per 100K: 9,332,808 people (7,420,422 total capacity)
– Shelters with generators: 8
– Shelters in 100-year floodplain: 0

English: Gary Halvorson, Oregon State Archives // Wikimedia Commons
#14. Douglas County
– Emergency shelters per 100K people: 75.0 (83 shelters in database)
– Emergency shelter capacity per 100K: 9,203,093 people (10,185,983 total capacity)
– Shelters with generators: 2
– Shelters in 100-year floodplain: 4
Cacophony // Wikimedia Commons
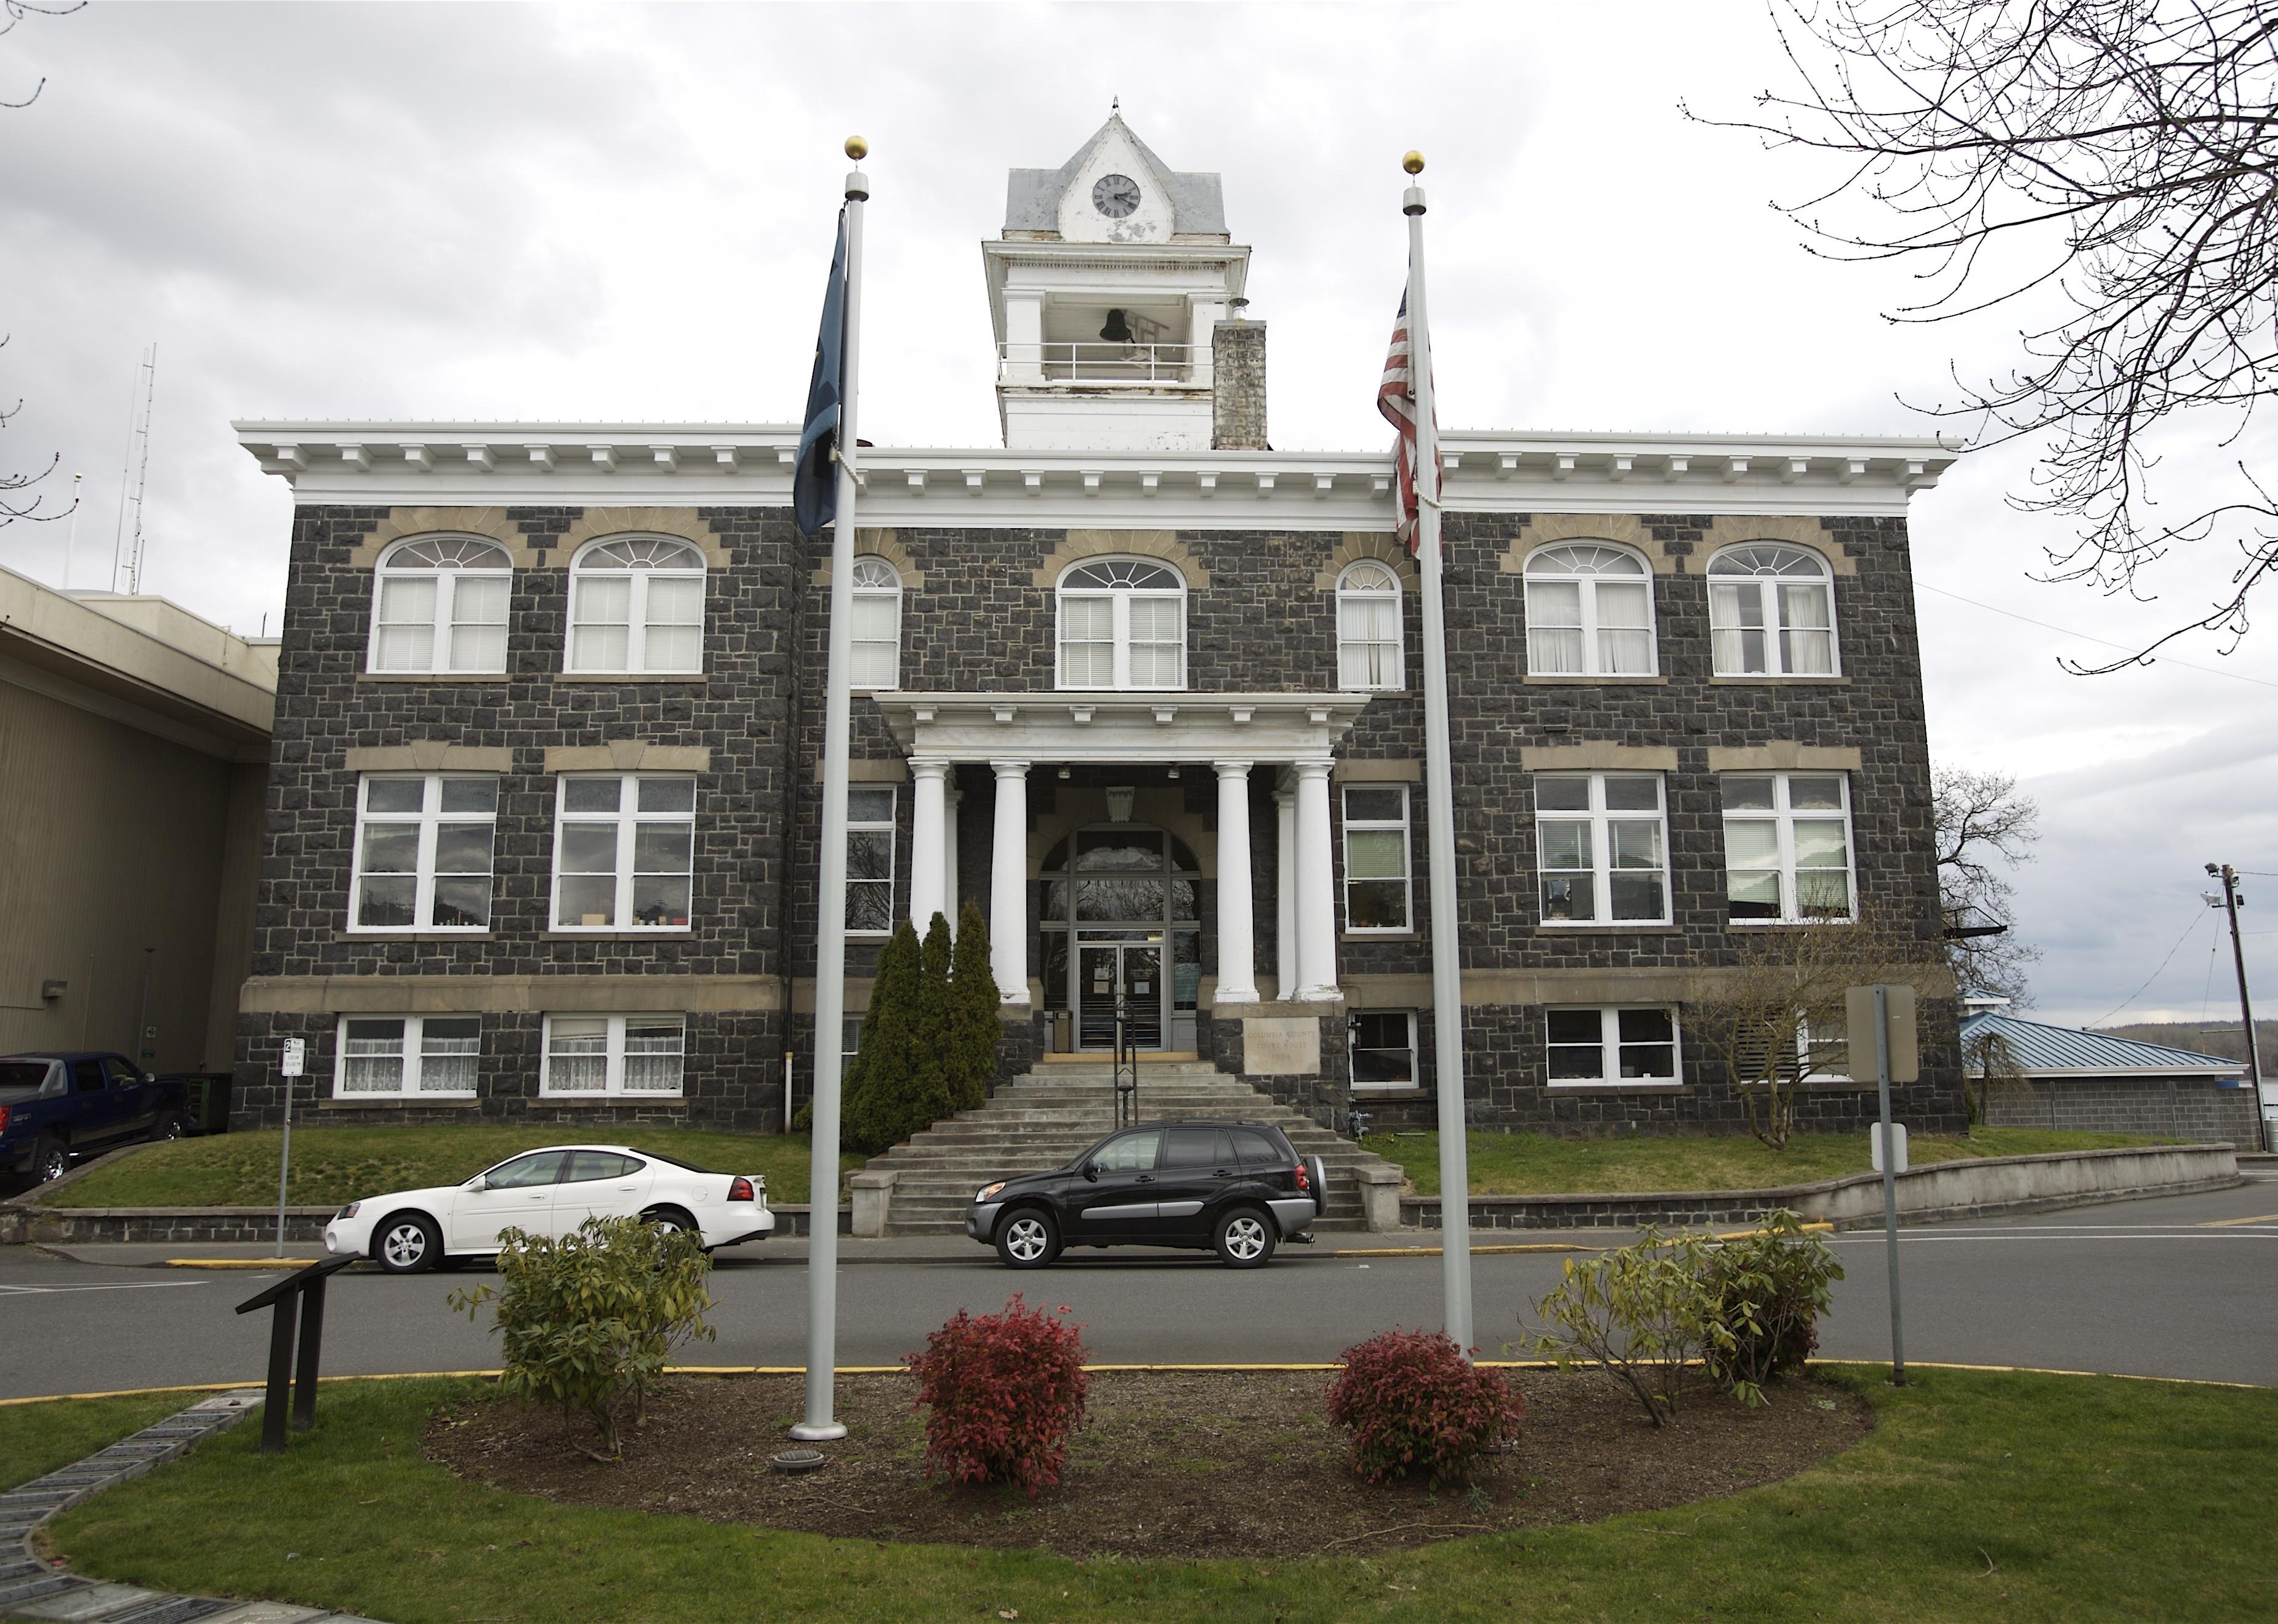
#13. Columbia County
– Emergency shelters per 100K people: 76.4 (40 shelters in database)
– Emergency shelter capacity per 100K: 7,894,231 people (4,135,077 total capacity)
– Shelters with generators: 4
– Shelters in 100-year floodplain: 1
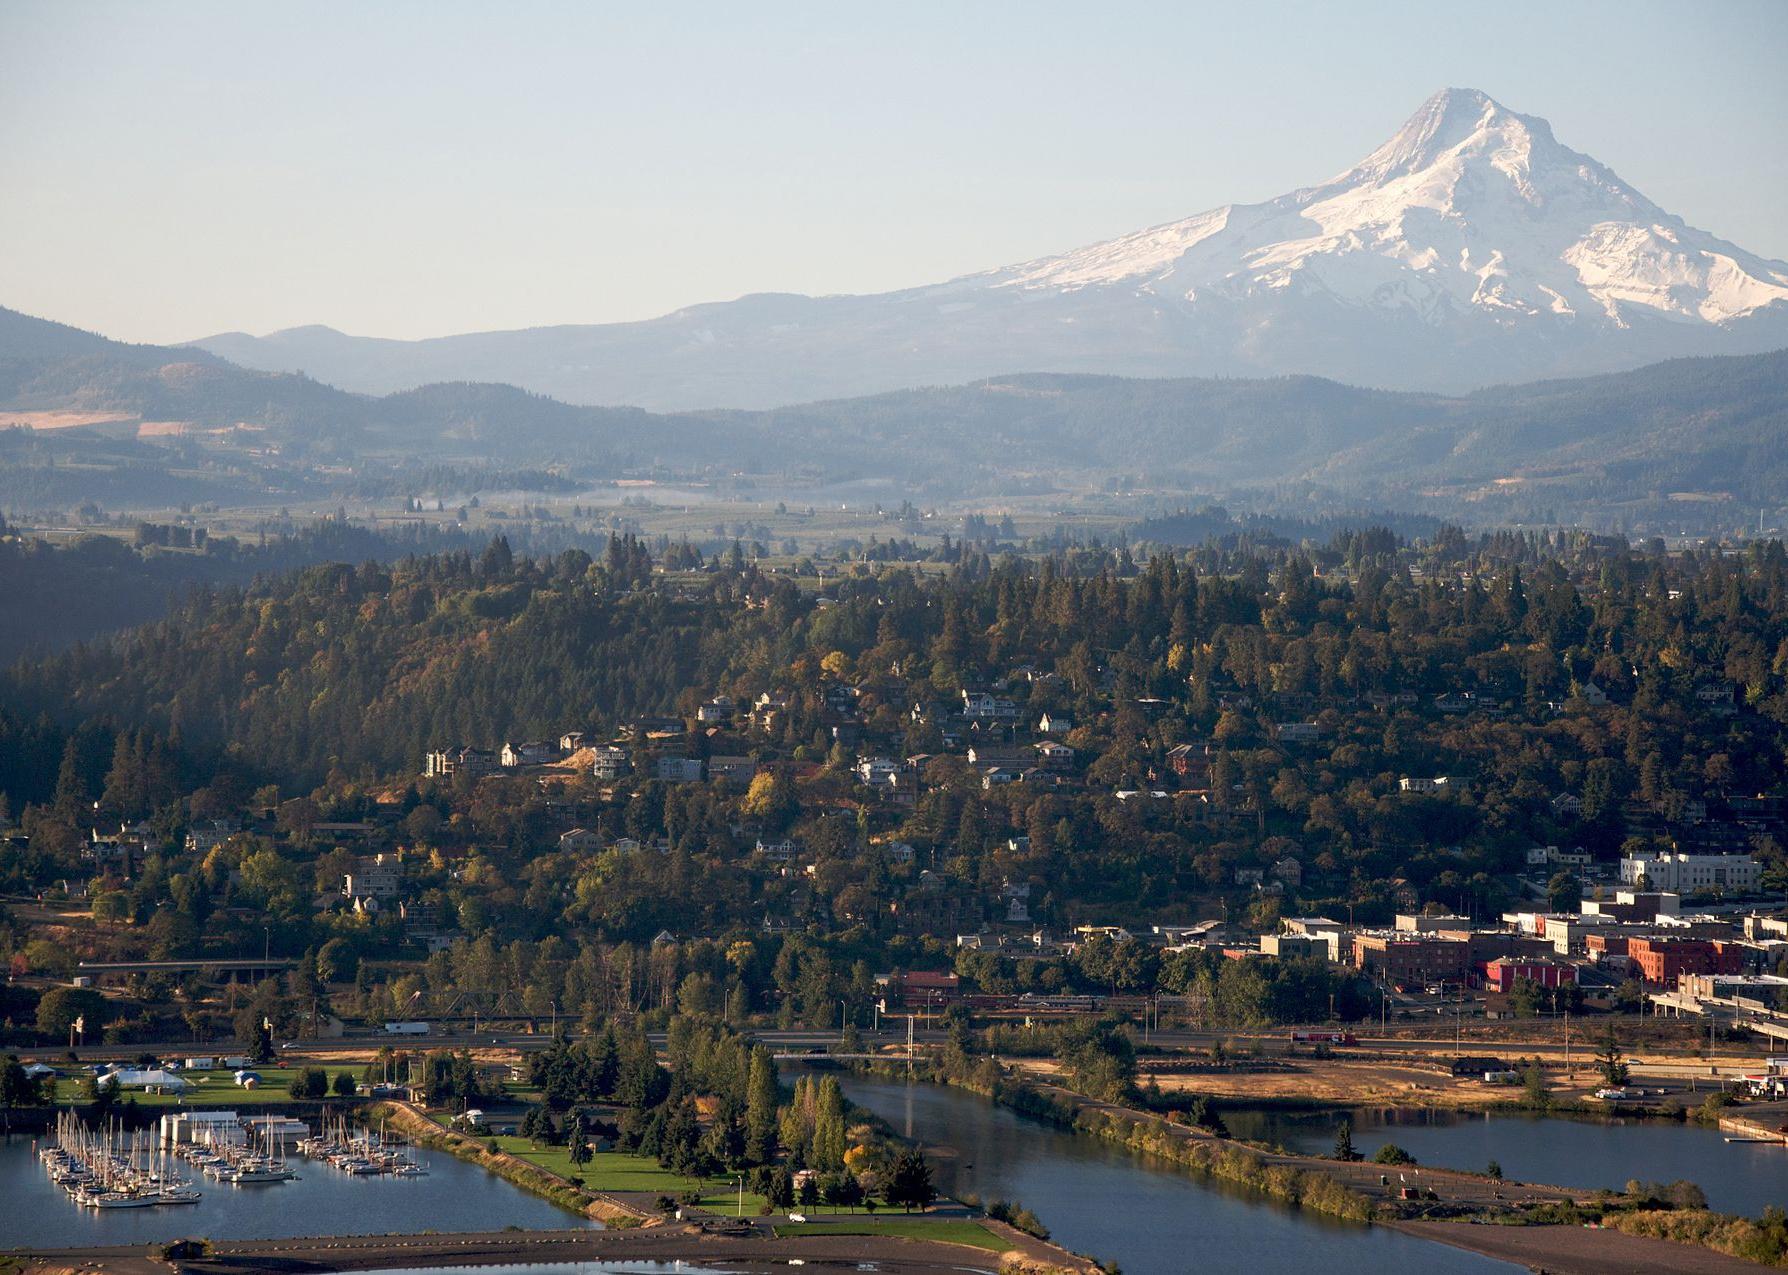
Sam Beebe // Wikimedia Commons
#12. Hood River County
– Emergency shelters per 100K people: 83.6 (20 shelters in database)
– Emergency shelter capacity per 100K: 11,734,217 people (2,806,238 total capacity)
– Shelters with generators: 0
– Shelters in 100-year floodplain: 0
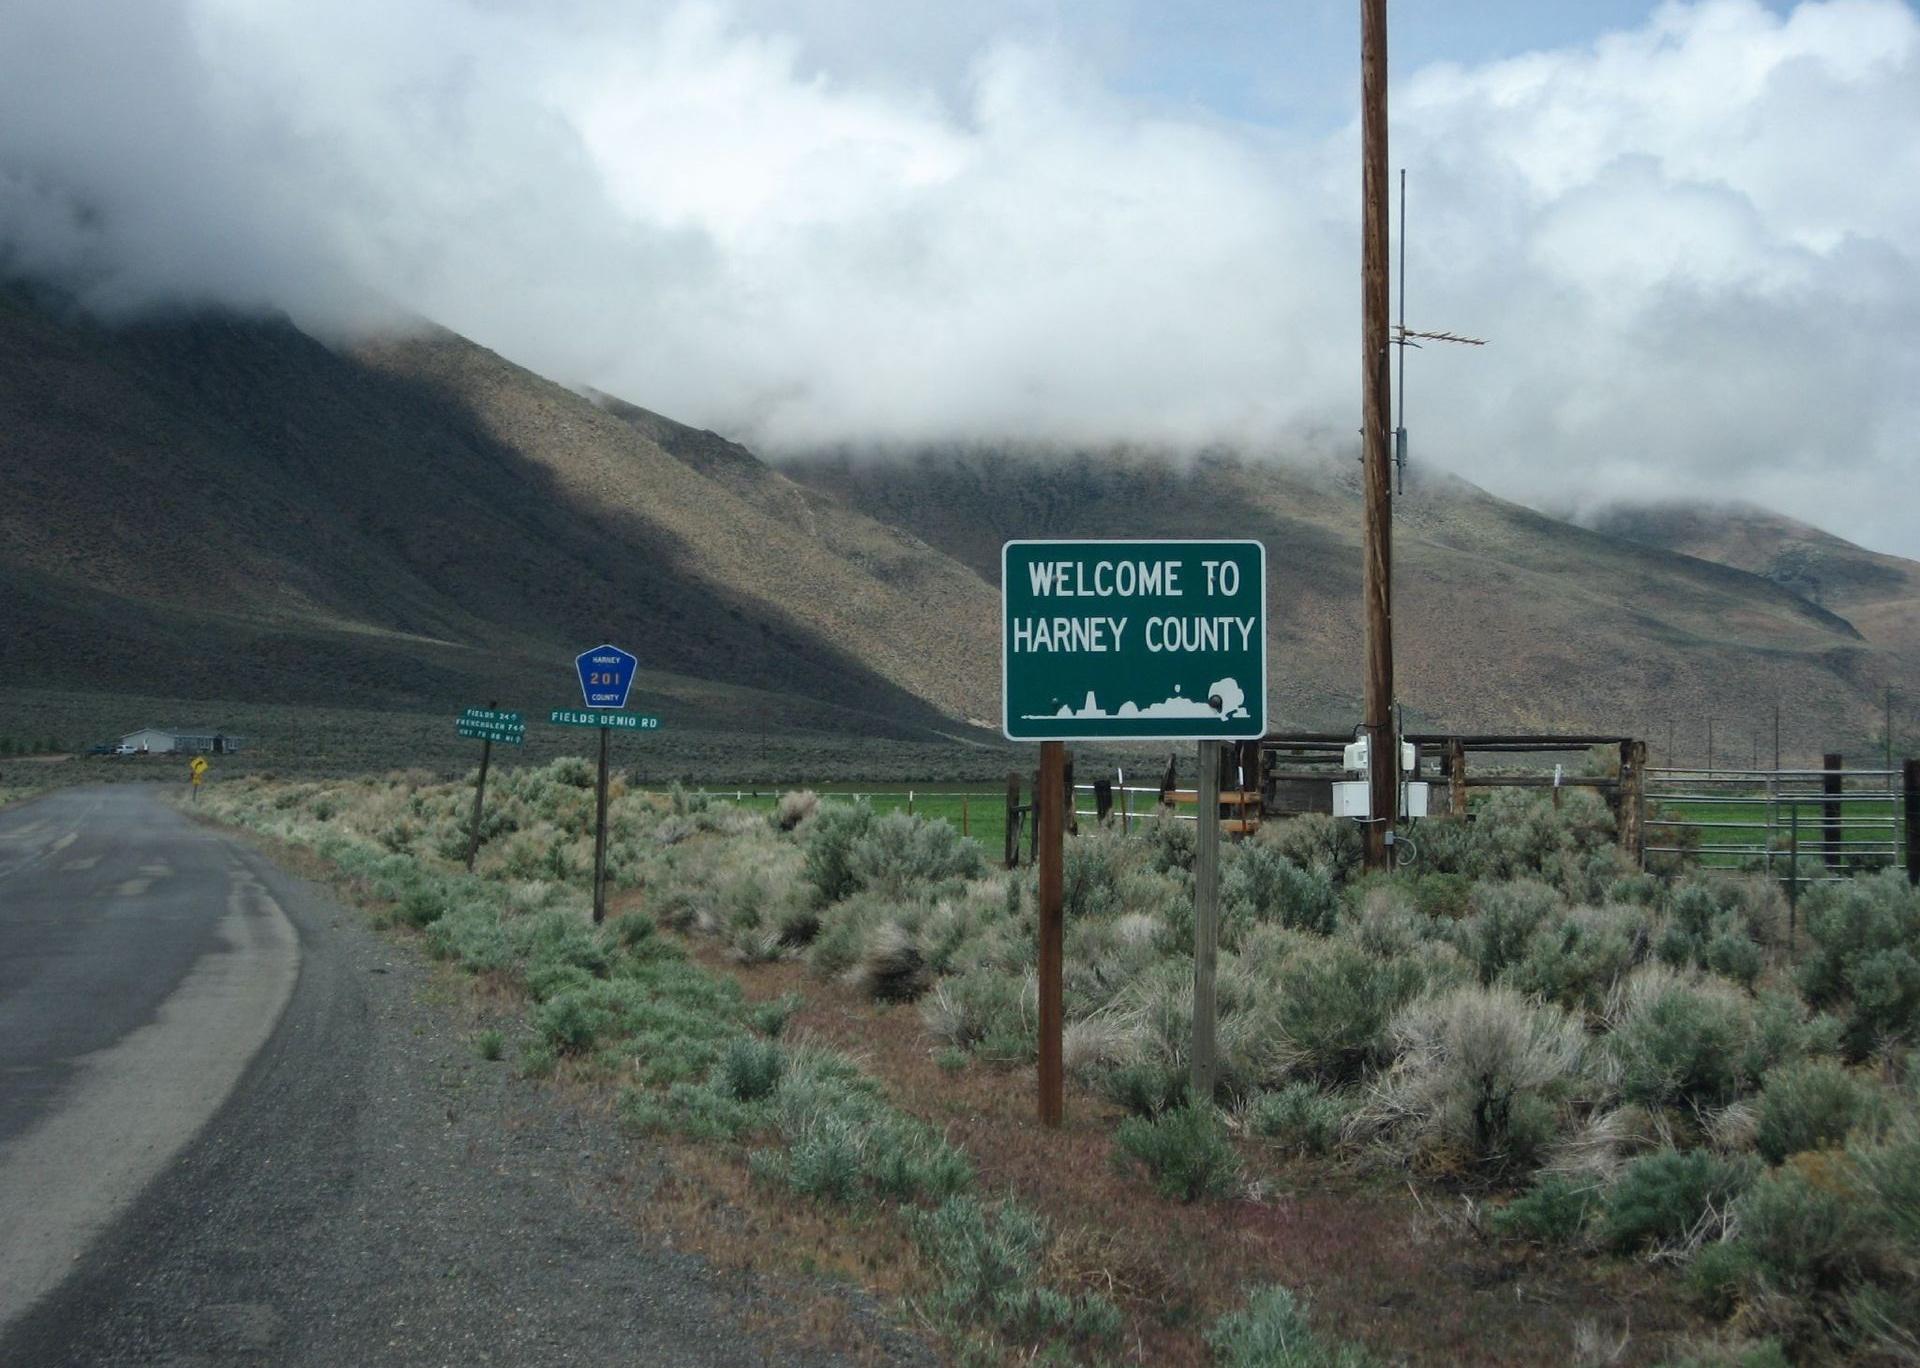
Ken Lund // Wikimedia Commons
#11. Harney County
– Emergency shelters per 100K people: 93.9 (7 shelters in database)
– Emergency shelter capacity per 100K: 24,974,403 people (1,861,592 total capacity)
– Shelters with generators: 1
– Shelters in 100-year floodplain: 1
Williamborg // Wikimedia Commons
#10. Union County
– Emergency shelters per 100K people: 106.6 (28 shelters in database)
– Emergency shelter capacity per 100K: 14,372,817 people (3,773,583 total capacity)
– Shelters with generators: 2
– Shelters in 100-year floodplain: 0

English: Gary Halvorson, Oregon State Archives // Wikimedia Commons
#9. Clatsop County
– Emergency shelters per 100K people: 110.5 (45 shelters in database)
– Emergency shelter capacity per 100K: 15,029,732 people (6,120,107 total capacity)
– Shelters with generators: 3
– Shelters in 100-year floodplain: 2
Debbie Tegtmeier // Wikimedia Commons
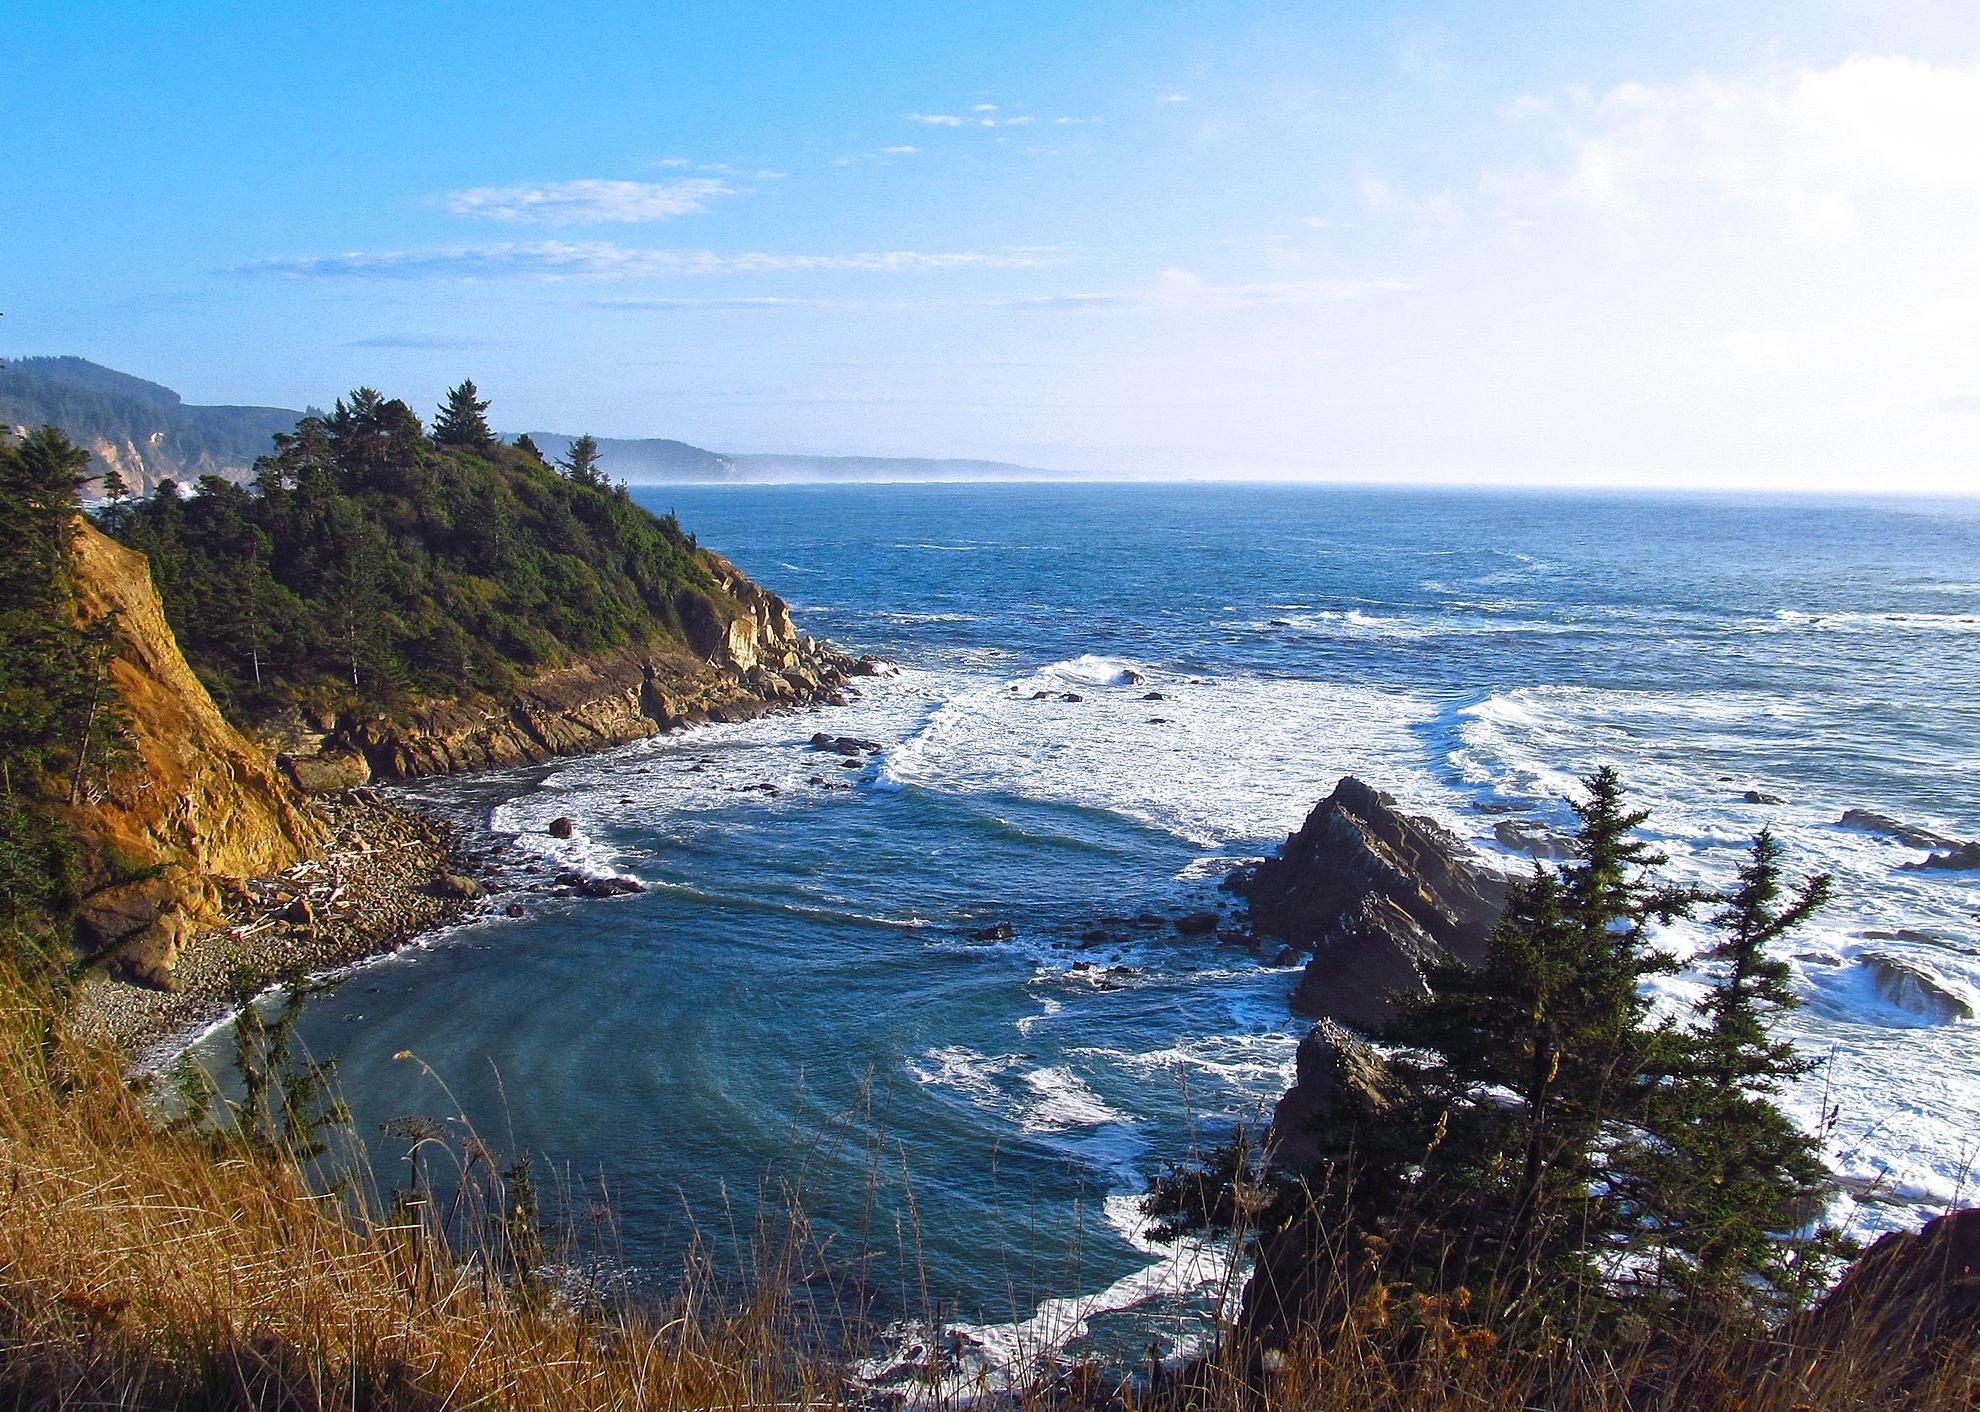
#8. Coos County
– Emergency shelters per 100K people: 119.2 (77 shelters in database)
– Emergency shelter capacity per 100K: 15,678,692 people (10,131,414 total capacity)
– Shelters with generators: 0
– Shelters in 100-year floodplain: 0
USFWS Headquarters’ photostream // Wikimedia Commons
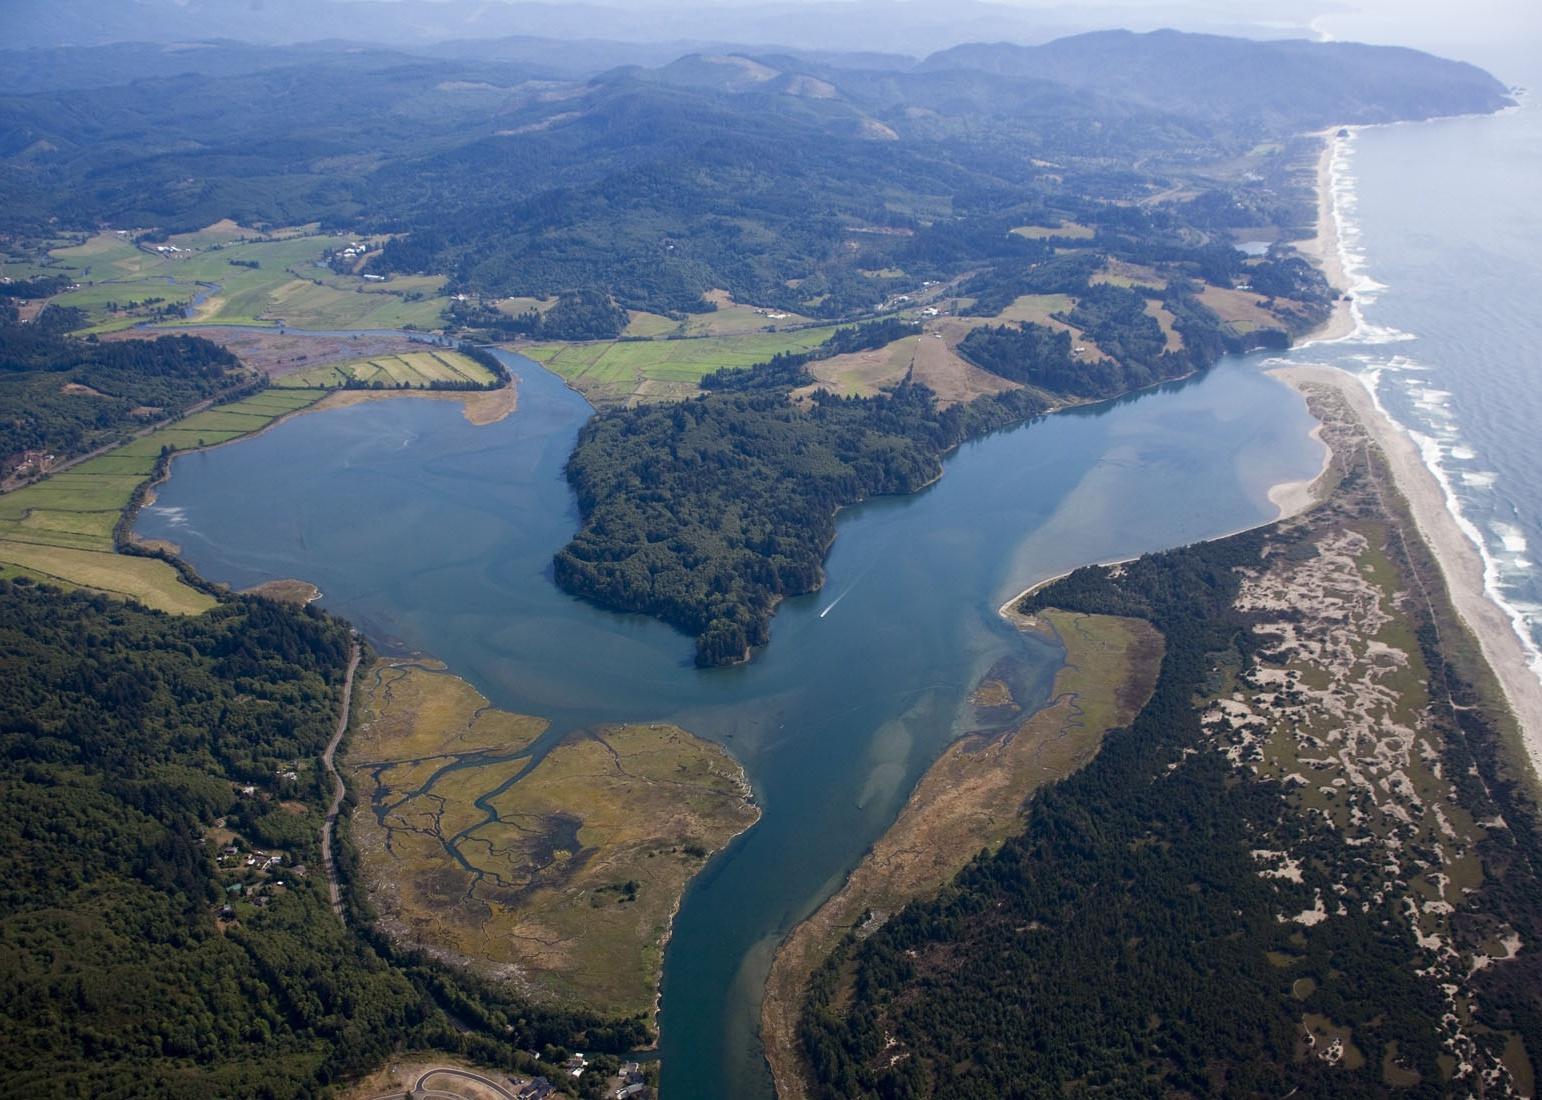
#7. Tillamook County
– Emergency shelters per 100K people: 125.3 (34 shelters in database)
– Emergency shelter capacity per 100K: 17,532,143 people (4,756,295 total capacity)
– Shelters with generators: 8
– Shelters in 100-year floodplain: 2

Manuela Durson // Shutterstock
#6. Curry County
– Emergency shelters per 100K people: 137.7 (32 shelters in database)
– Emergency shelter capacity per 100K: 23,682,061 people (5,502,290 total capacity)
– Shelters with generators: 1
– Shelters in 100-year floodplain: 0
Finetooth // Wikimedia Commons
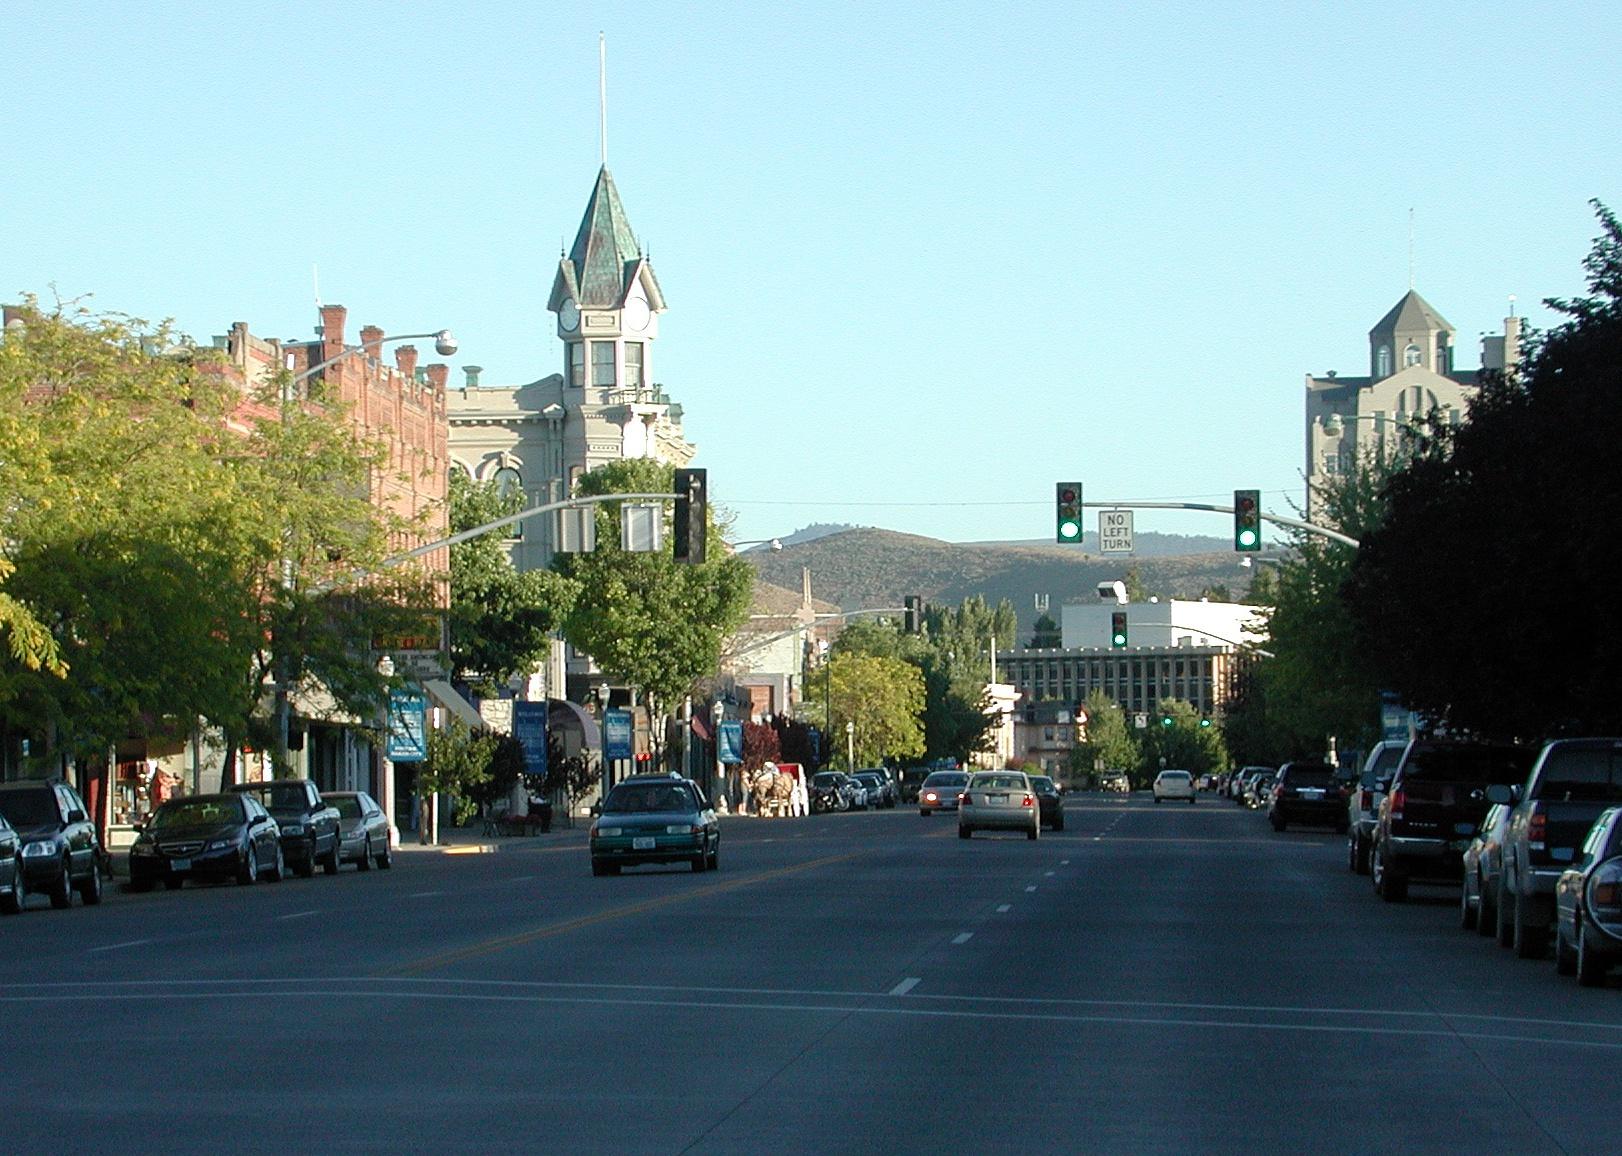
#5. Baker County
– Emergency shelters per 100K people: 151.2 (25 shelters in database)
– Emergency shelter capacity per 100K: 31,499,432 people (5,209,691 total capacity)
– Shelters with generators: 2
– Shelters in 100-year floodplain: 0
Tedder // Wikimedia Commons
#4. Gilliam County
– Emergency shelters per 100K people: 153.5 (3 shelters in database)
– Emergency shelter capacity per 100K: 54,653,838 people (1,067,936 total capacity)
– Shelters with generators: 0
– Shelters in 100-year floodplain: 0

Finetooth // Wikimedia Commons
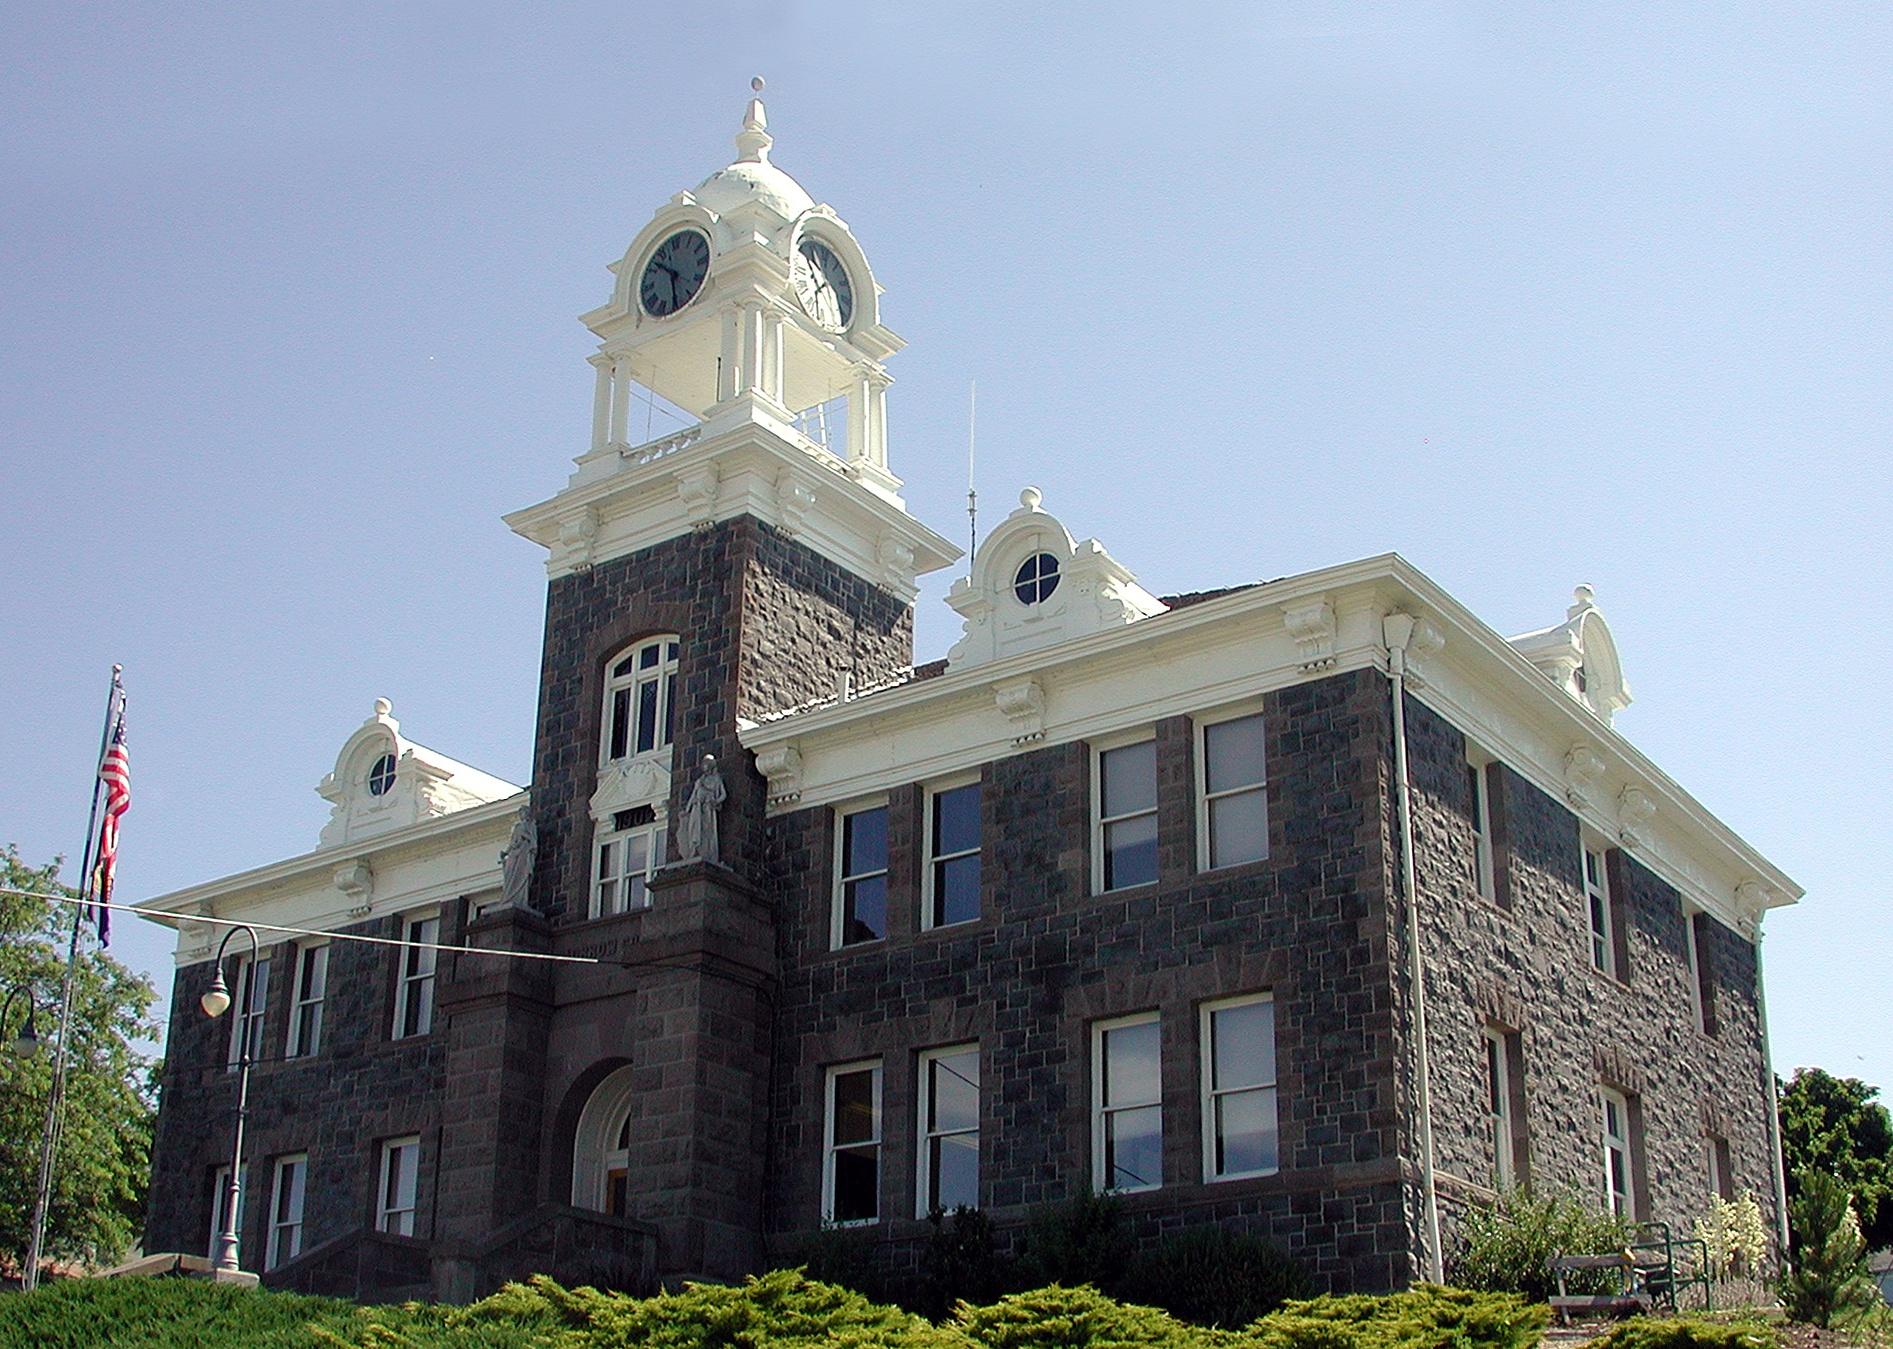
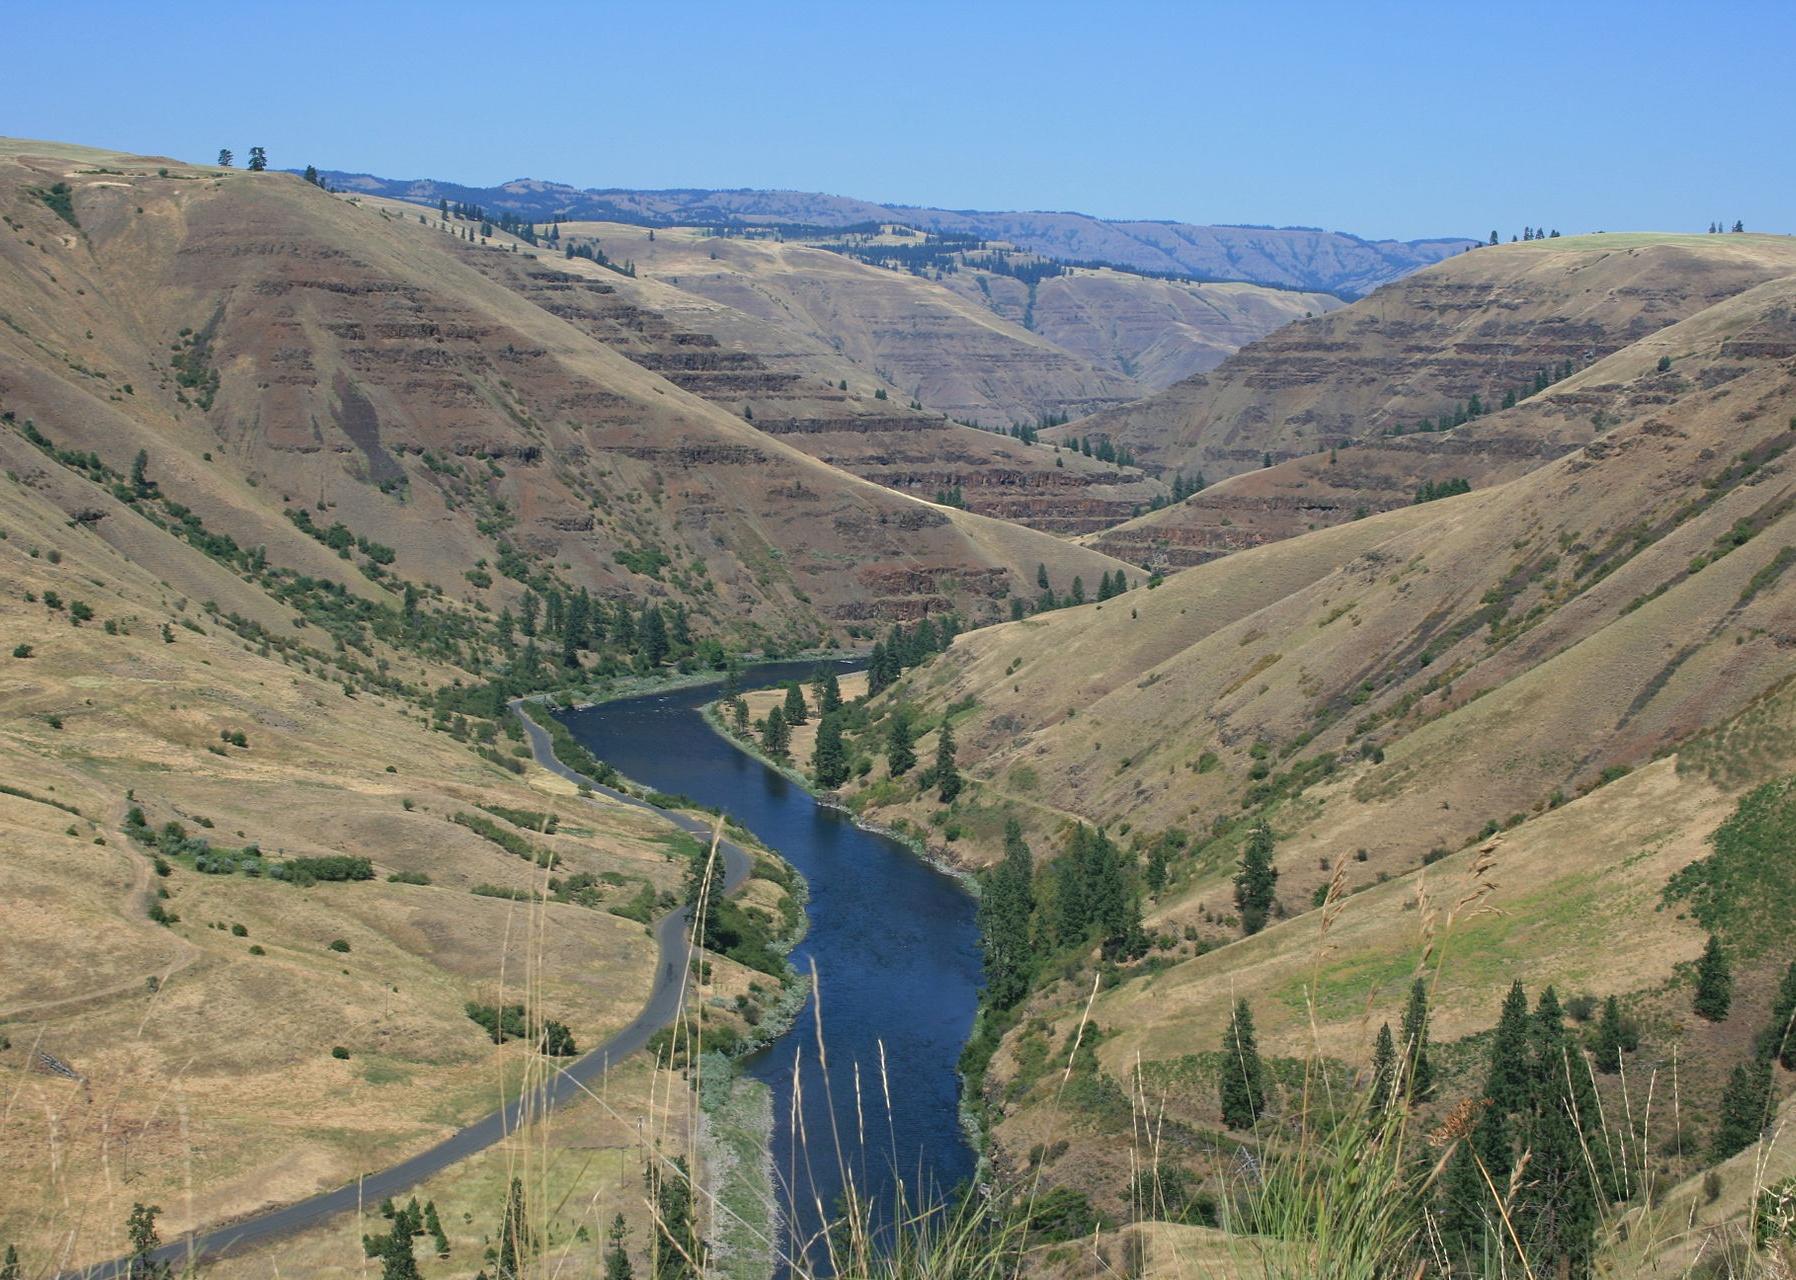
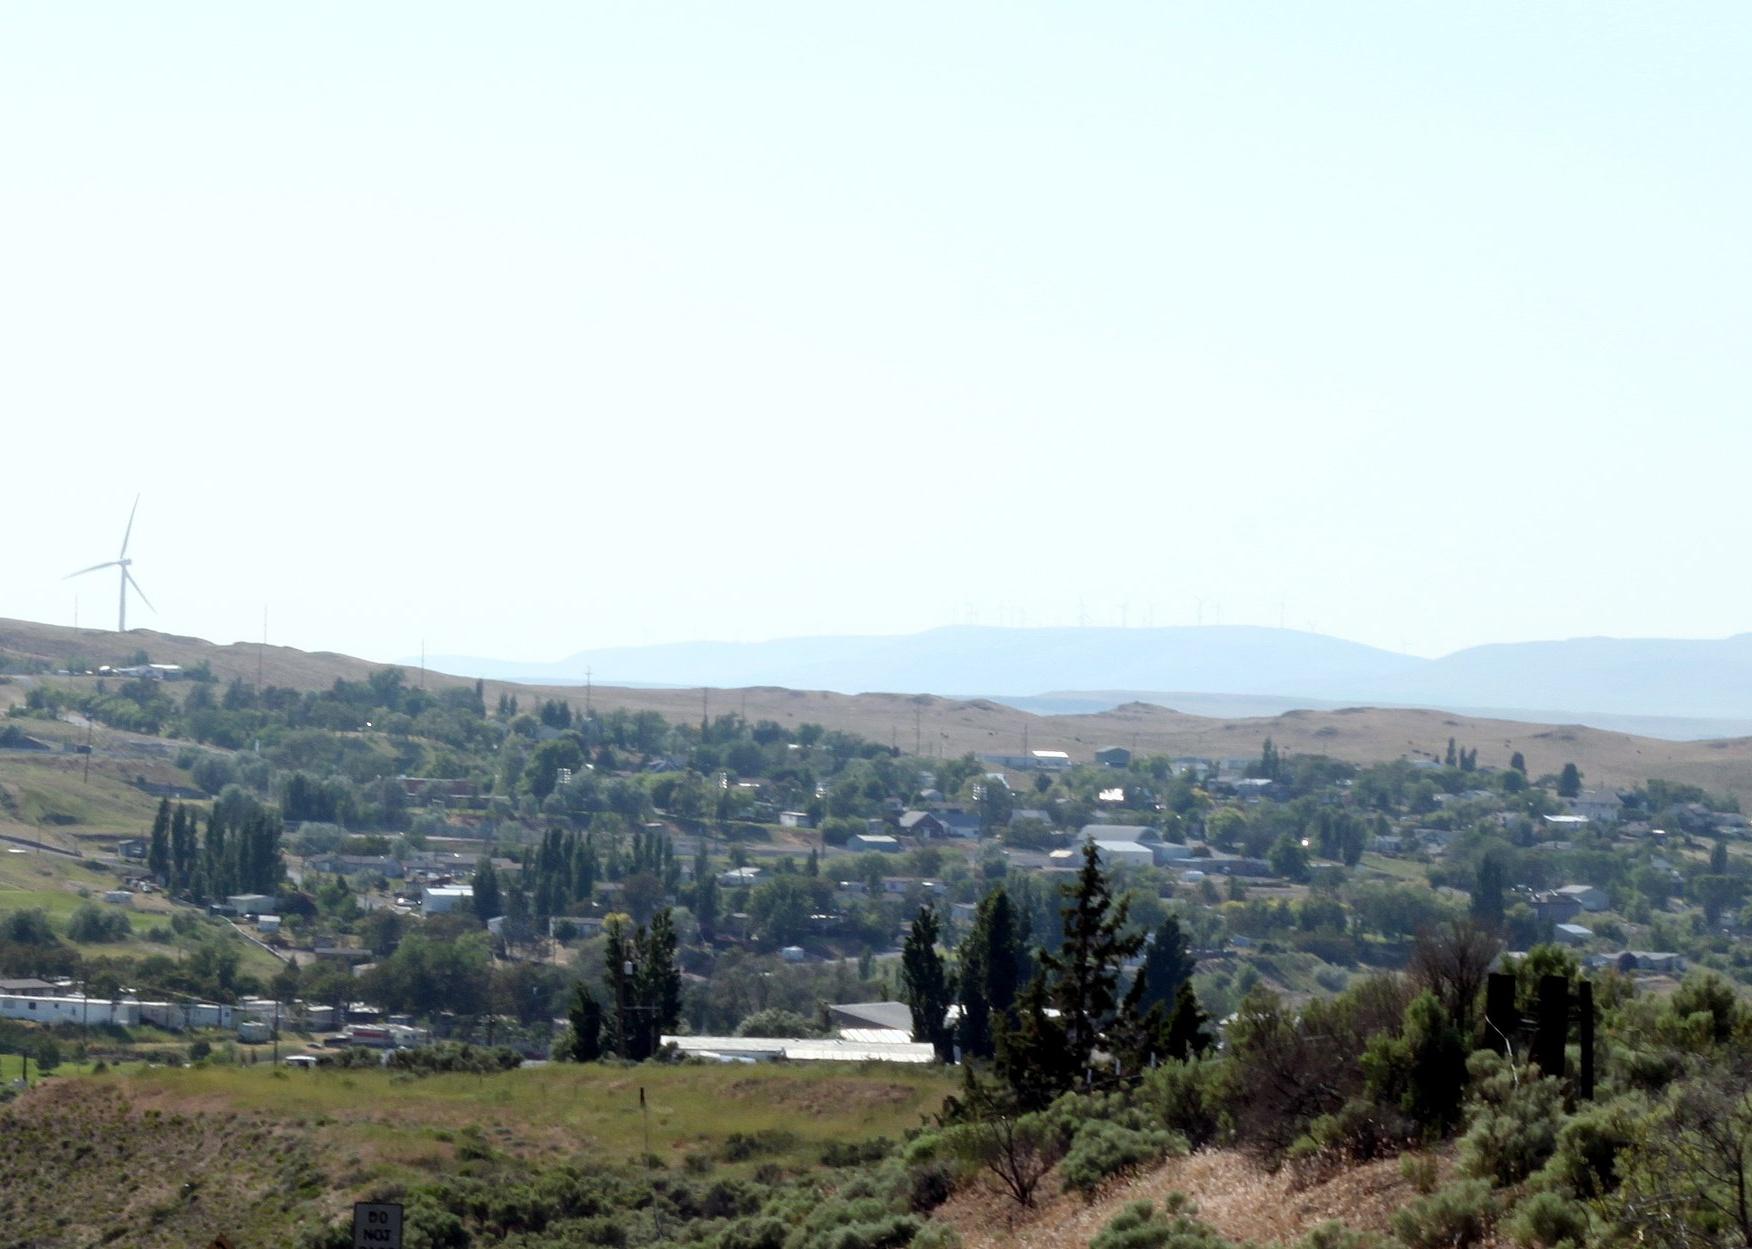
#3. Grant County
– Emergency shelters per 100K people: 235.3 (17 shelters in database)
– Emergency shelter capacity per 100K: 40,472,969 people (2,924,172 total capacity)
– Shelters with generators: 1
– Shelters in 100-year floodplain: 0
Finetooth // Wikimedia Commons
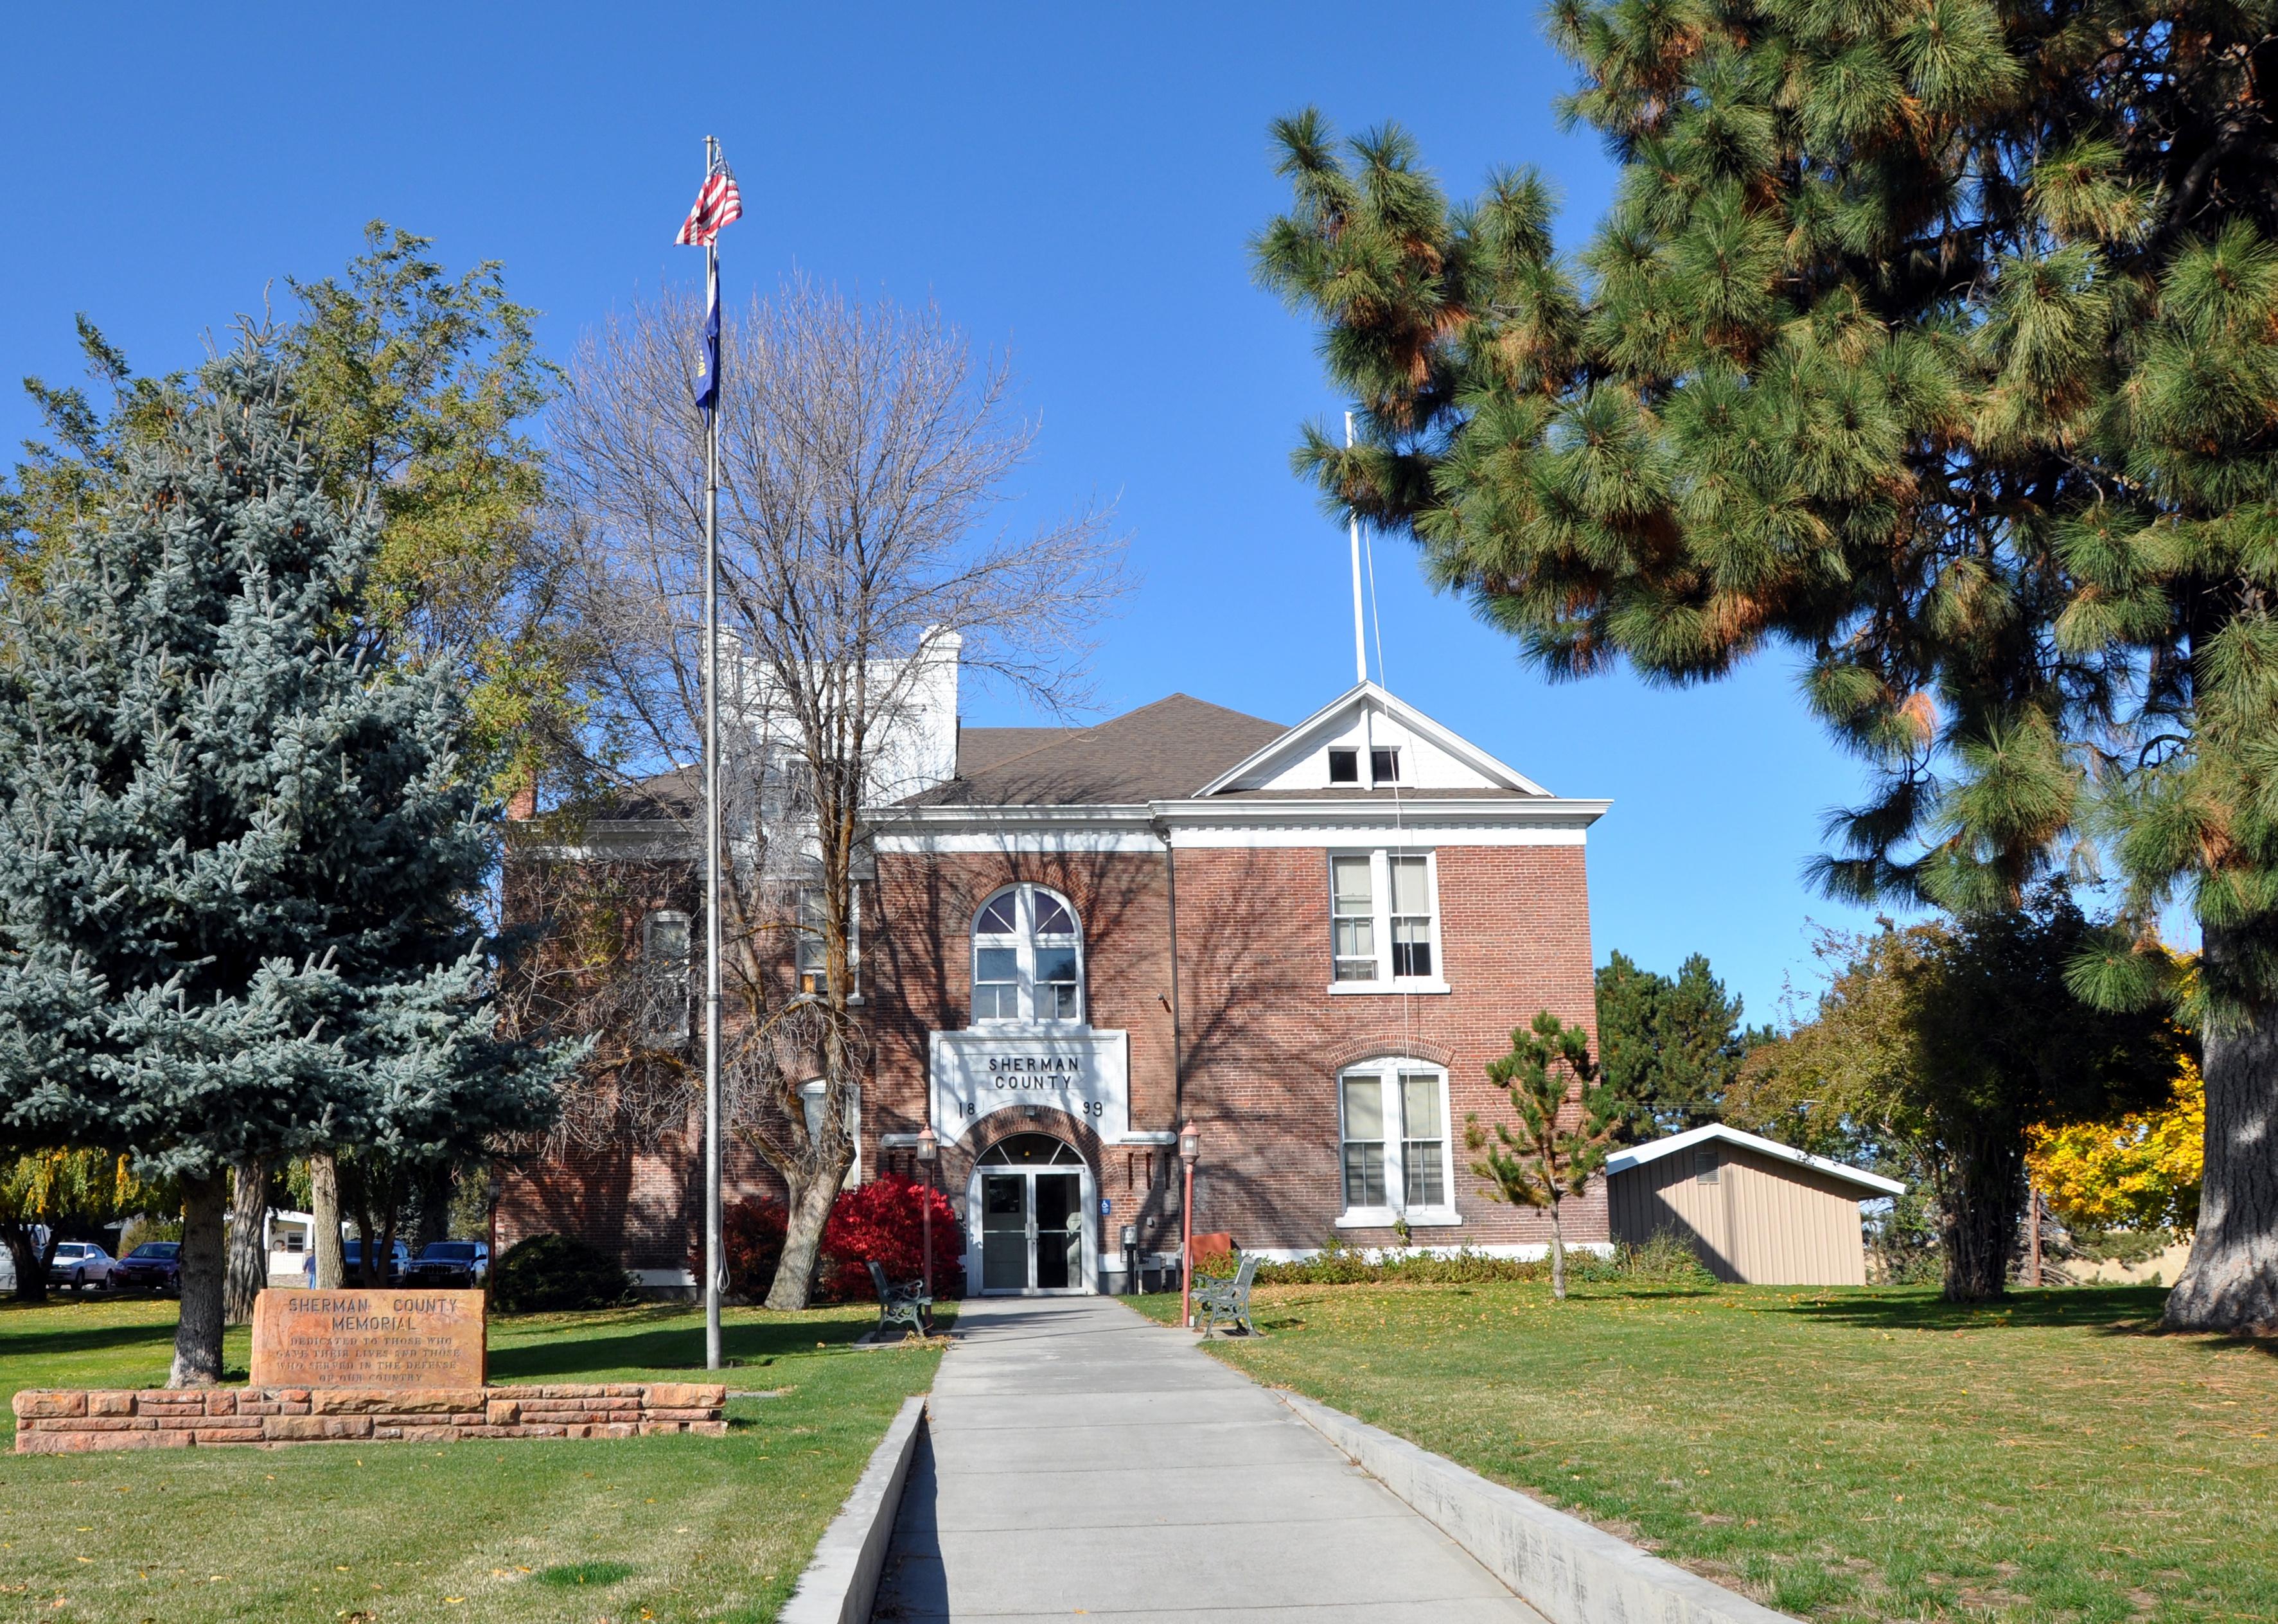
#2. Sherman County
– Emergency shelters per 100K people: 336.3 (6 shelters in database)
– Emergency shelter capacity per 100K: 71,739,182 people (1,279,827 total capacity)
– Shelters with generators: 0
– Shelters in 100-year floodplain: 0

Tomas Nevesely // Shutterstock
#1. Wheeler County
– Emergency shelters per 100K people: 609.3 (9 shelters in database)
– Emergency shelter capacity per 100K: 84,758,971 people (1,251,890 total capacity)
– Shelters with generators: 0
– Shelters in 100-year floodplain: 0
