Counties with the highest unemployment in Oregon

Canva
Counties with the highest unemployment in Oregon
Unemployment rates, while significantly lower than the alarming pandemic peak of 14.7% experienced in April 2020, remain a subject of concern, though experts’ views on a potential recession are mixed. The last economic recession—the Great Recession of 2007-2009—sent rates up to 10% as of October 2009. It was not until the spring of 2019 that unemployment finally went down to the same level it sits at now.
As of April 2023, national unemployment is at 3.4%, with little change from March. Seasonally adjusted unemployment rates by state demonstrate a rather sizable spectrum, ranging from just 1.9% in South Dakota to 5.4% in Nevada.
Stacker compiled a list of counties with the highest unemployment rates in Oregon using data from the Bureau of Labor Statistics. Counties are ranked by their preliminary unemployment rate in March 2023, with initial ties broken by the number of unemployed people within that county, though some ties may remain.
![]()
cpaulfell // Shutterstock
#36. Benton County
– March unemployment rate (preliminary): 2.6%
— 1 month change: Down 0.9 percentage points
— 1 year change: Down 0.6 percentage points
– Total labor force: 49,747 people (1,318 unemployed)

Canva
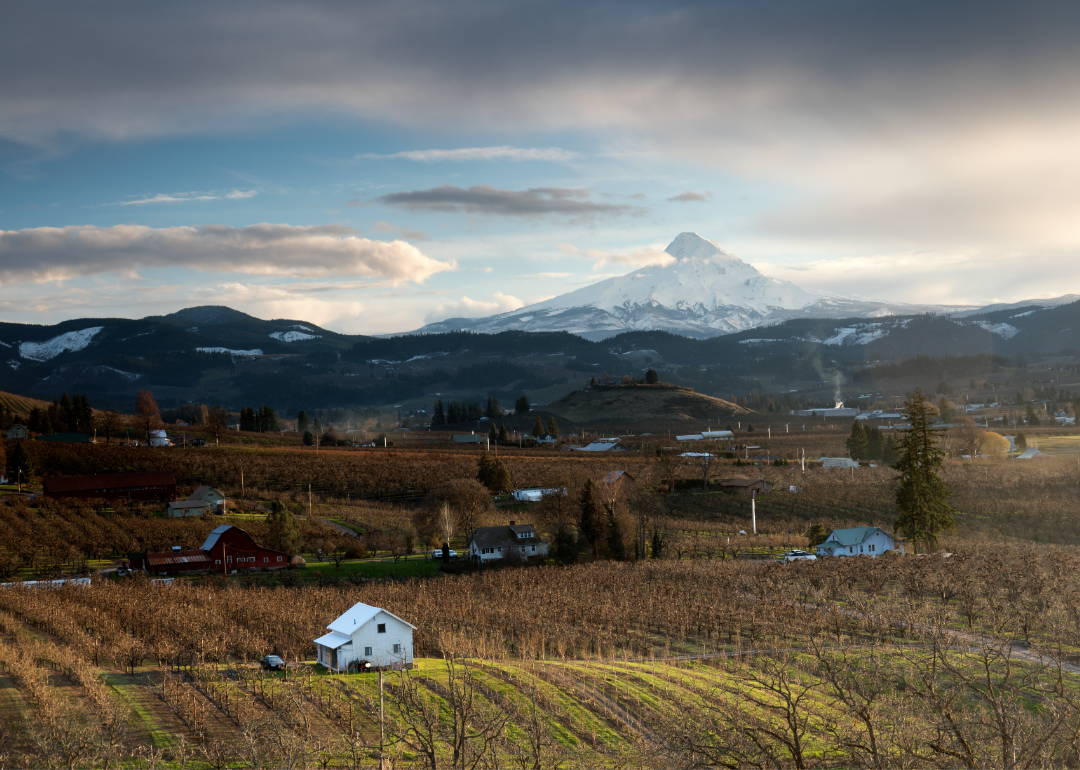
#35. Hood River County
– March unemployment rate (preliminary): 2.9%
— 1 month change: Down 0.9 percentage points
— 1 year change: Down 0.5 percentage points
– Total labor force: 13,920 people (406 unemployed)

Tomas Nevesely // Shutterstock
#34. Wheeler County
– March unemployment rate (preliminary): 3%
— 1 month change: Down 0.6 percentage points
— 1 year change: Down 0.5 percentage points
– Total labor force: 727 people (22 unemployed)

Yanqiang Dai // Shutterstock
#33. Washington County
– March unemployment rate (preliminary): 3%
— 1 month change: Down 0.6 percentage points
— 1 year change: Down 0.2 percentage points
– Total labor force: 333,132 people (10,016 unemployed)
Bob Pool // Shutterstock
#32. Morrow County
– March unemployment rate (preliminary): 3.2%
— 1 month change: Down 1.5 percentage points
— 1 year change: Down 0.5 percentage points
– Total labor force: 5,881 people (187 unemployed)

Canva
#31. Clackamas County
– March unemployment rate (preliminary): 3.2%
— 1 month change: Down 0.7 percentage points
— 1 year change: Down 0.4 percentage points
– Total labor force: 225,159 people (7,241 unemployed)

Canva
#30. Yamhill County
– March unemployment rate (preliminary): 3.4%
— 1 month change: Down 0.8 percentage points
— 1 year change: Down 0.2 percentage points
– Total labor force: 56,018 people (1,880 unemployed)

Josemaria Toscano // Shutterstock
#29. Multnomah County
– March unemployment rate (preliminary): 3.4%
— 1 month change: Down 0.7 percentage points
— 1 year change: Down 0.4 percentage points
– Total labor force: 465,556 people (15,927 unemployed)

Arpad Jasko // Shutterstock
#28. Gilliam County
– March unemployment rate (preliminary): 3.5%
— 1 month change: Down 0.5 percentage points
— 1 year change: Down 0.8 percentage points
– Total labor force: 1,028 people (36 unemployed)
Canva
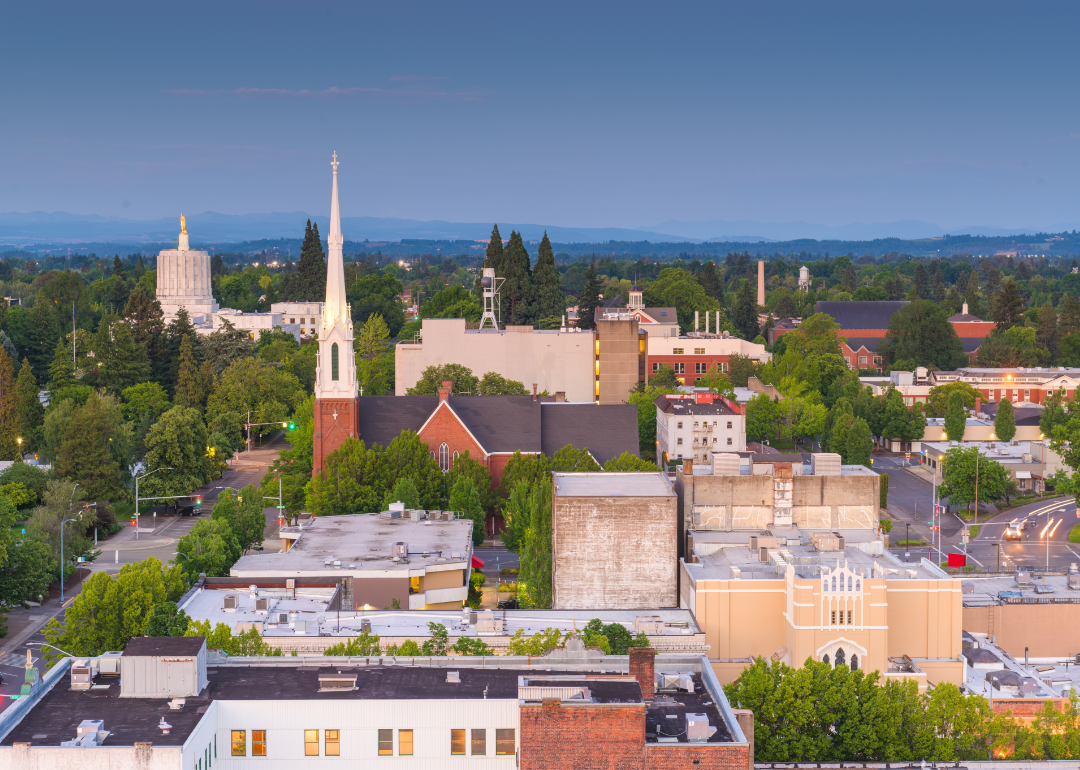
#27. Marion County
– March unemployment rate (preliminary): 3.6%
— 1 month change: Down 1.0 percentage points
— 1 year change: Down 0.4 percentage points
– Total labor force: 168,659 people (6,149 unemployed)
Canva
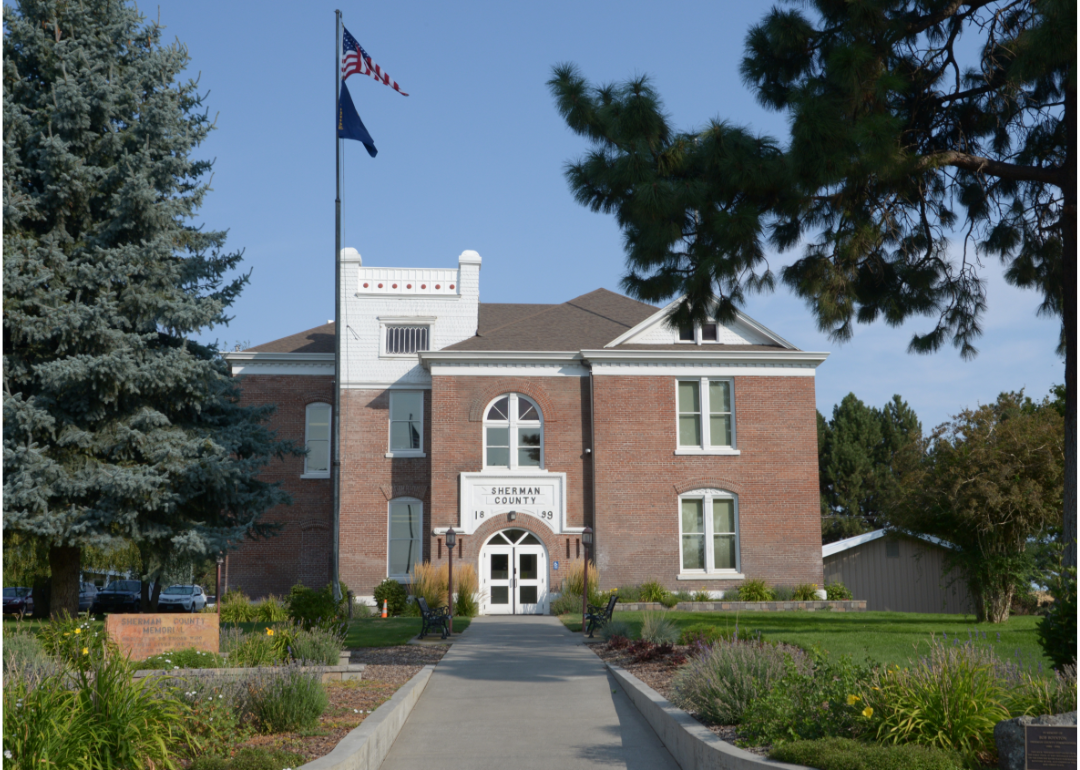
#26. Sherman County
– March unemployment rate (preliminary): 3.7%
— 1 month change: Down 0.6 percentage points
— 1 year change: Up 0.2 percentage points
– Total labor force: 968 people (36 unemployed)
Hugh K Telleria // Shutterstock
#25. Malheur County
– March unemployment rate (preliminary): 3.7%
— 1 month change: Down 1.3 percentage points
— 1 year change: Down 0.2 percentage points
– Total labor force: 12,324 people (451 unemployed)

Bob Pool // Shutterstock
#24. Umatilla County
– March unemployment rate (preliminary): 3.8%
— 1 month change: Down 2.7 percentage points
— 1 year change: Down 0.6 percentage points
– Total labor force: 37,244 people (1,425 unemployed)
Cynthia Liang // Shutterstock
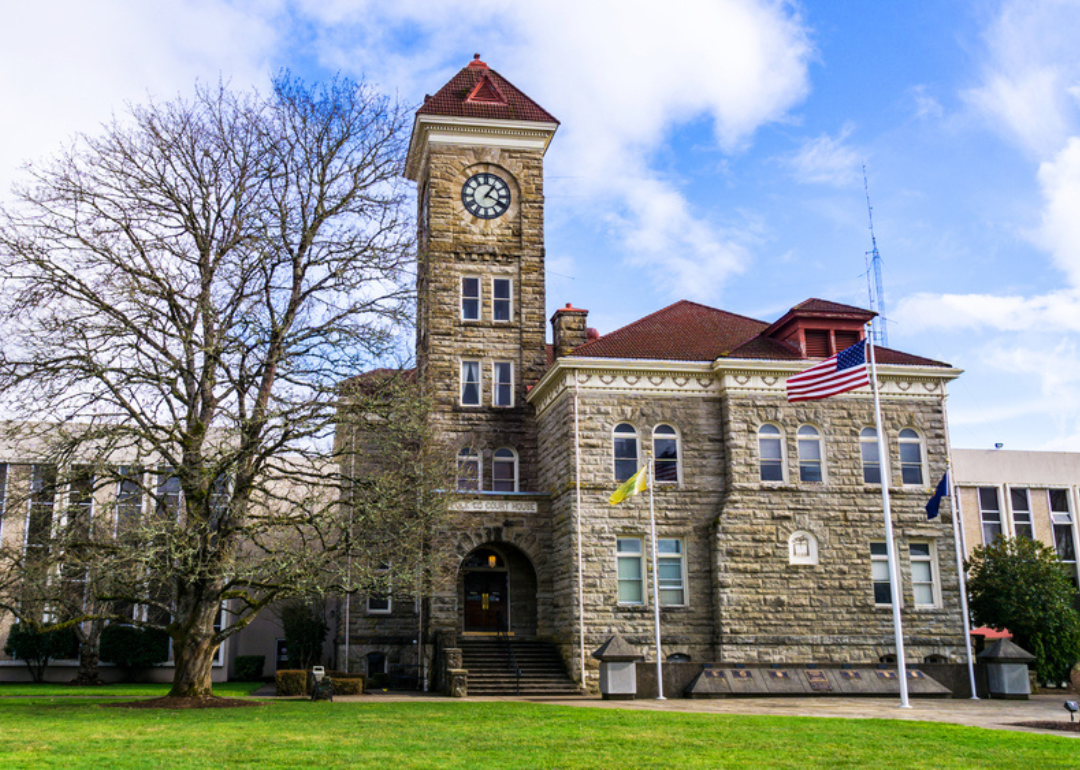
#23. Polk County
– March unemployment rate (preliminary): 3.8%
— 1 month change: Down 0.9 percentage points
— 1 year change: Down 0.2 percentage points
– Total labor force: 42,487 people (1,603 unemployed)
Canva
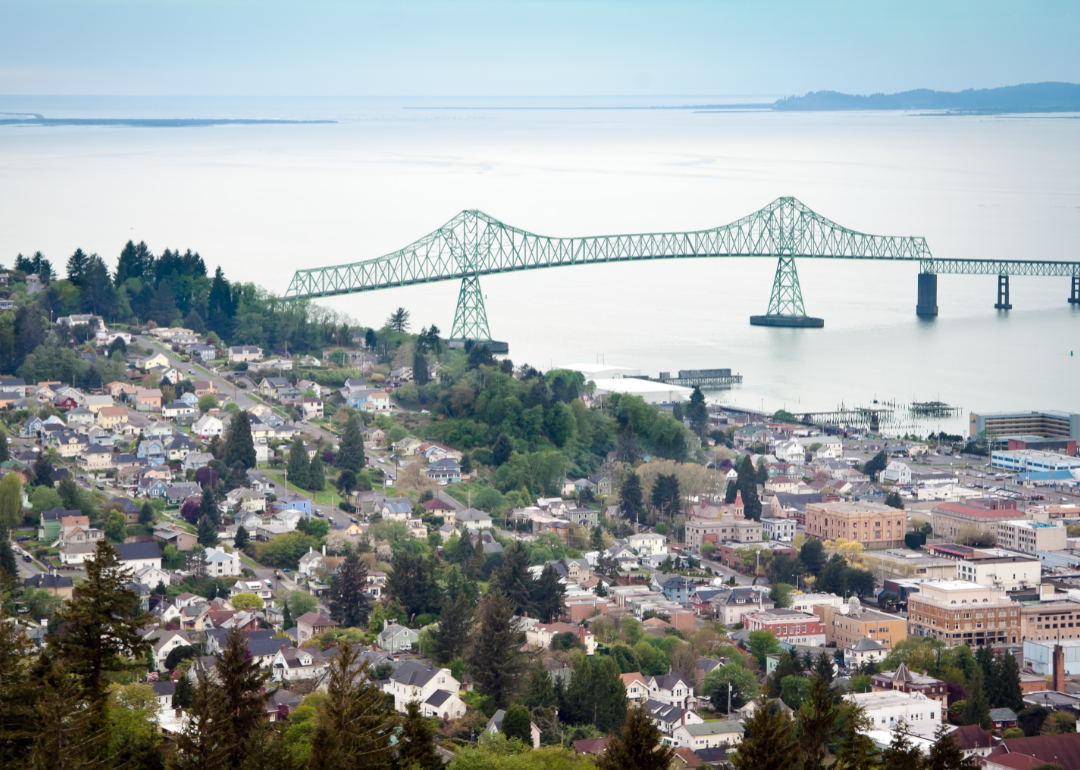
#22. Clatsop County
– March unemployment rate (preliminary): 3.9%
— 1 month change: Down 0.9 percentage points
— 1 year change: Down 0.3 percentage points
– Total labor force: 19,009 people (739 unemployed)
Canva
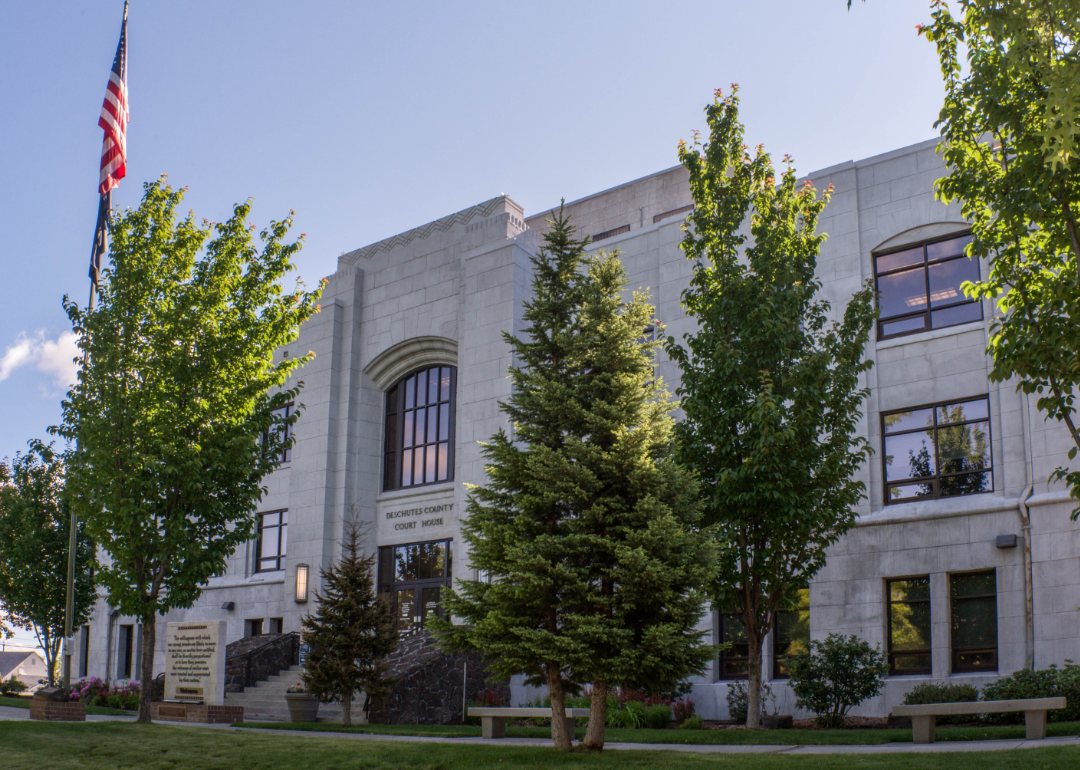
#21. Deschutes County
– March unemployment rate (preliminary): 3.9%
— 1 month change: Down 1.0 percentage points
— 1 year change: Down 0.2 percentage points
– Total labor force: 101,678 people (3,929 unemployed)
Canva
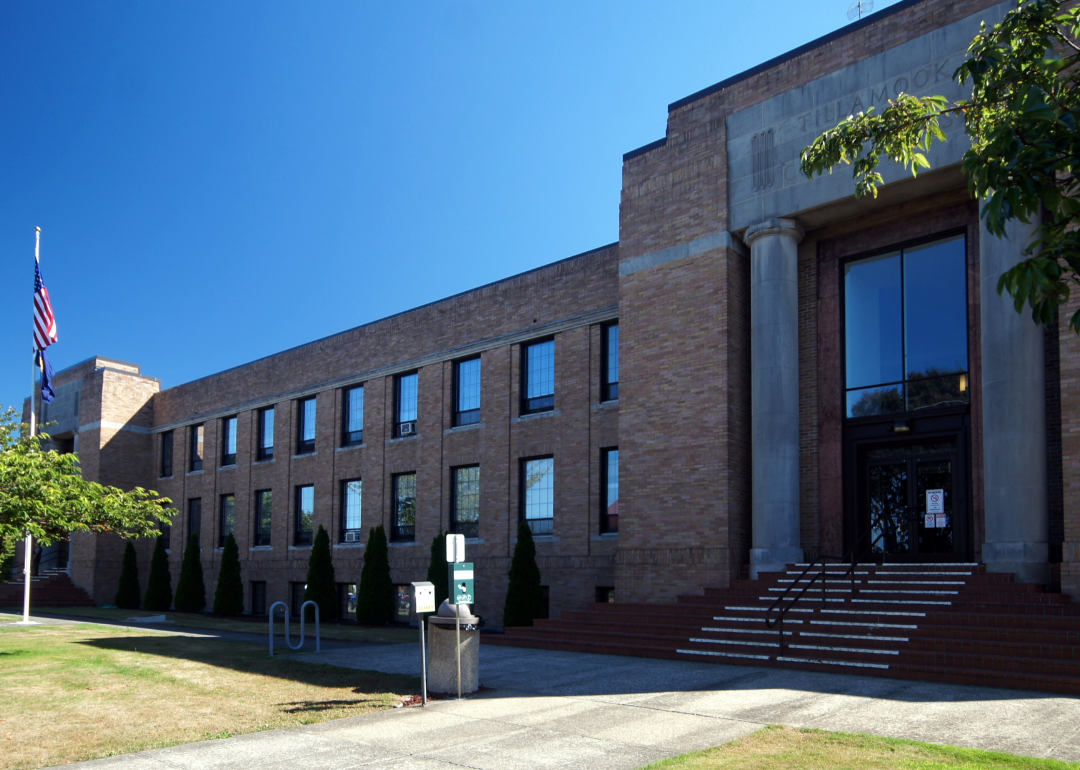
#20. Tillamook County
– March unemployment rate (preliminary): 4%
— 1 month change: Down 1.0 percentage points
— 1 year change: Down 0.3 percentage points
– Total labor force: 11,844 people (478 unemployed)
![]()
Canva
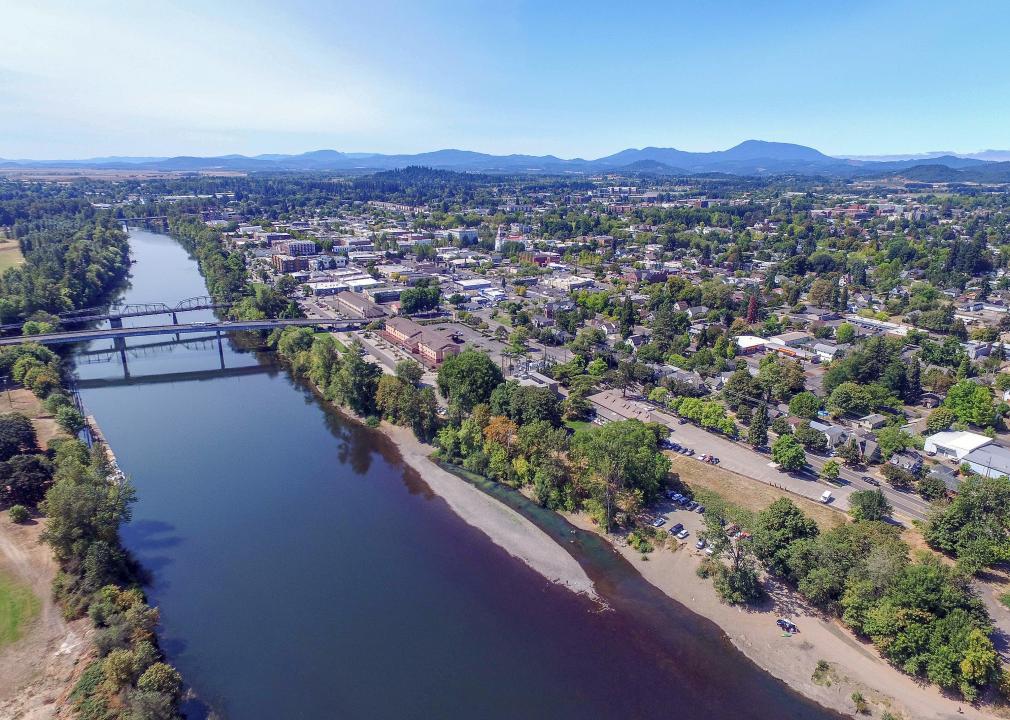
#19. Linn County
– March unemployment rate (preliminary): 4%
— 1 month change: Down 0.9 percentage points
— 1 year change: Down 0.4 percentage points
– Total labor force: 60,636 people (2,423 unemployed)

Canva
#18. Lane County
– March unemployment rate (preliminary): 4%
— 1 month change: Down 0.9 percentage points
— 1 year change: Down 0.2 percentage points
– Total labor force: 179,957 people (7,140 unemployed)
kenneth korb // Shutterstock
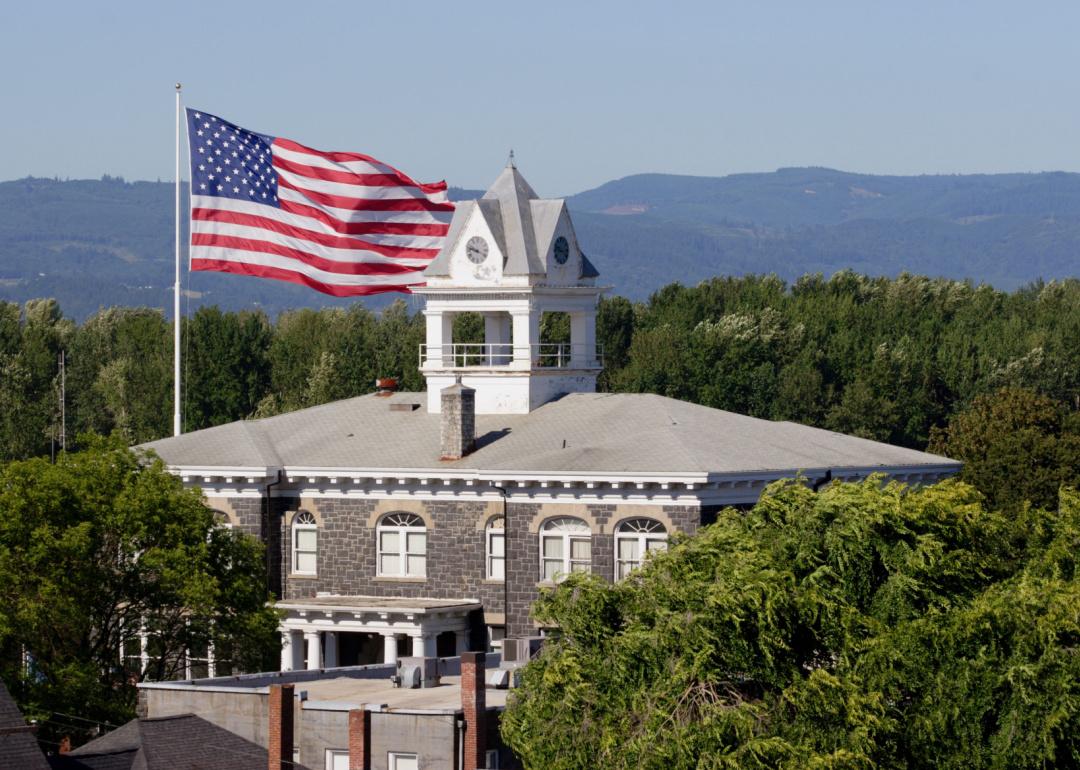
#17. Columbia County
– March unemployment rate (preliminary): 4.2%
— 1 month change: Down 0.9 percentage points
— 1 year change: Down 0.4 percentage points
– Total labor force: 24,989 people (1,049 unemployed)

Canva
#16. Union County
– March unemployment rate (preliminary): 4.4%
— 1 month change: Down 1.2 percentage points
— 1 year change: Down 0.4 percentage points
– Total labor force: 11,882 people (527 unemployed)
Canva
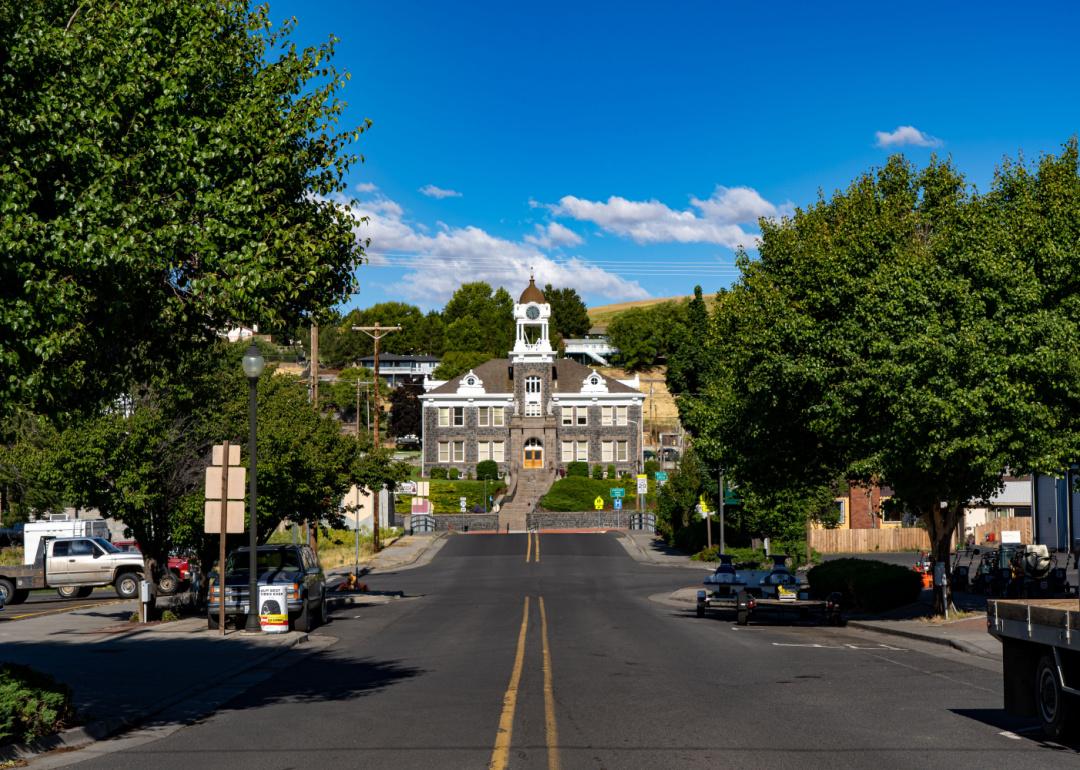
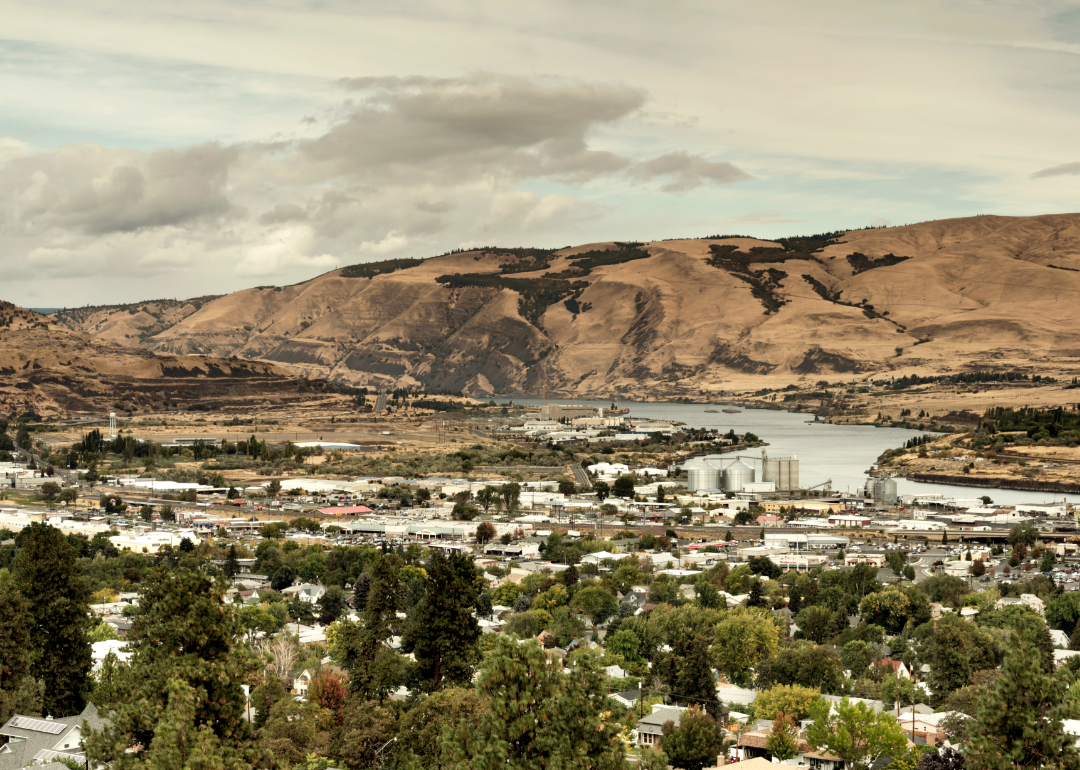
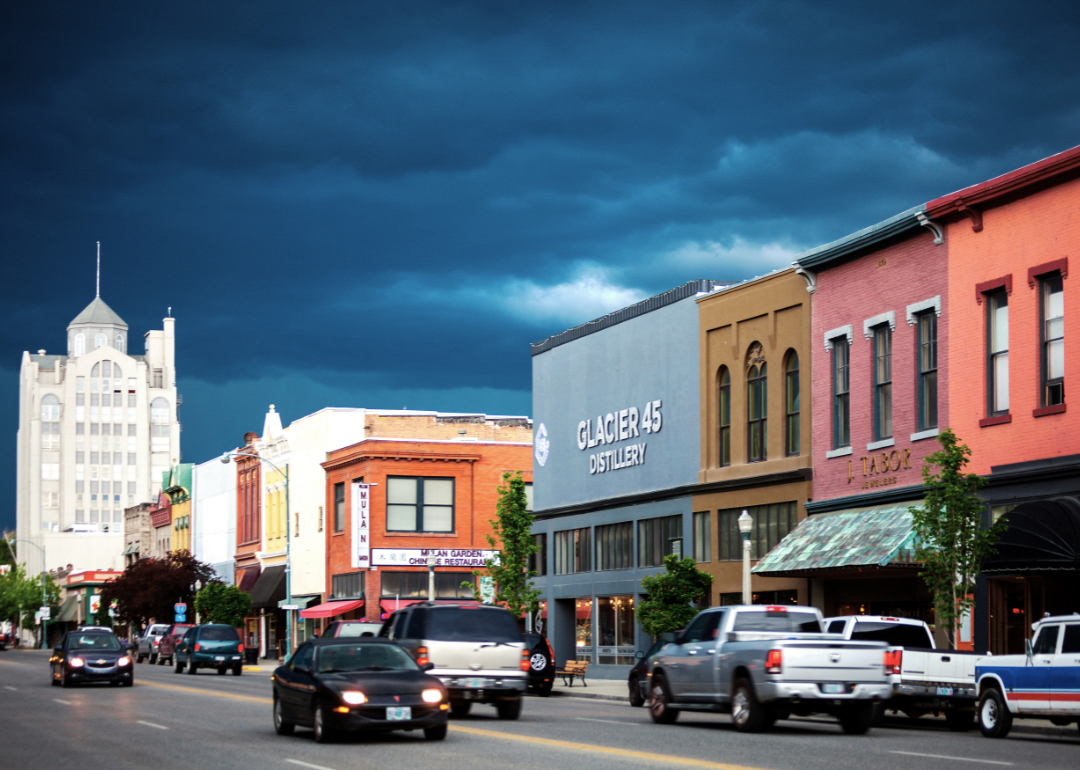
#15. Wasco County
– March unemployment rate (preliminary): 4.4%
— 1 month change: Down 1.3 percentage points
— 1 year change: Up 0.1 percentage points
– Total labor force: 12,784 people (565 unemployed)
Canva
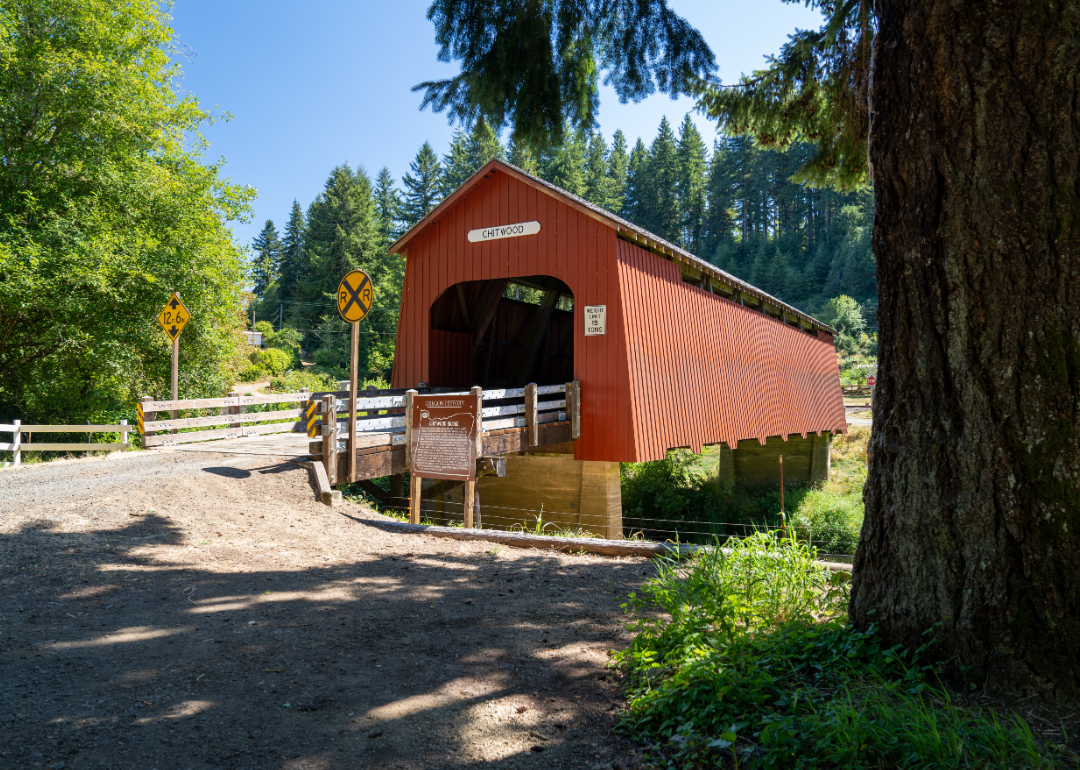
#14. Lincoln County
– March unemployment rate (preliminary): 4.5%
— 1 month change: Down 1.1 percentage points
— 1 year change: Down 0.5 percentage points
– Total labor force: 20,230 people (919 unemployed)
Canva
#13. Jackson County
– March unemployment rate (preliminary): 4.5%
— 1 month change: Down 1.0 percentage points
— 1 year change: Up 0.1 percentage points
– Total labor force: 105,347 people (4,714 unemployed)
Canva
#12. Baker County
– March unemployment rate (preliminary): 4.7%
— 1 month change: Down 1.1 percentage points
— 1 year change: Down 0.2 percentage points
– Total labor force: 7,217 people (339 unemployed)
Canva
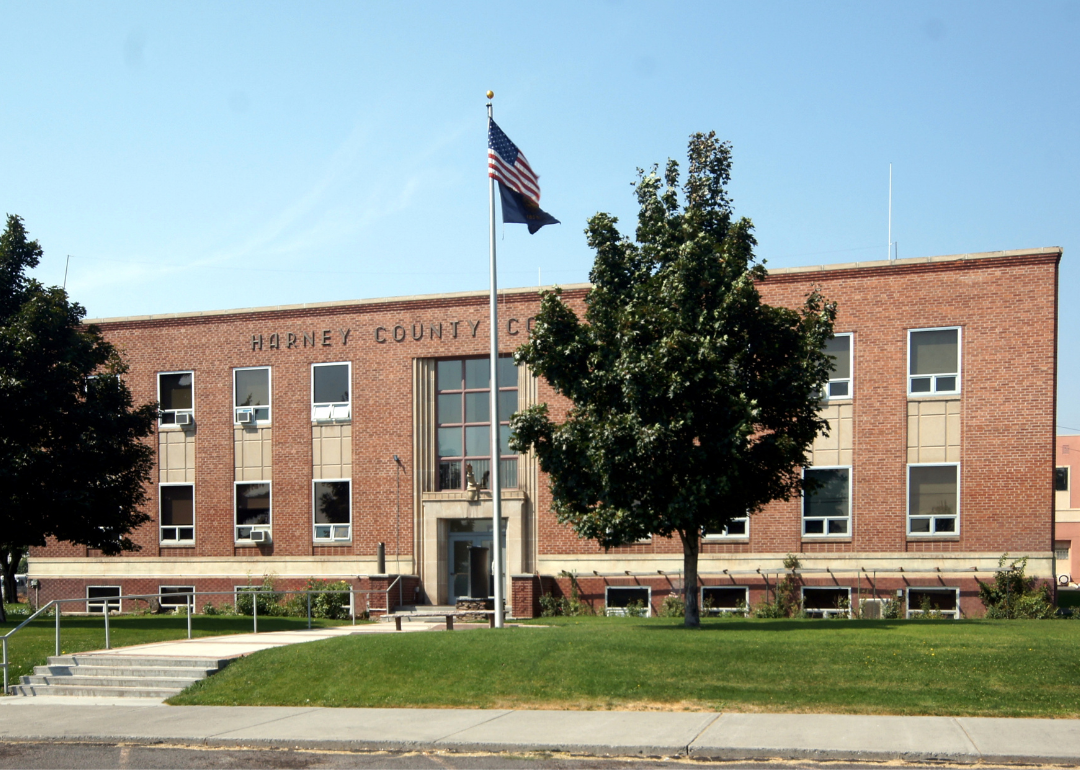
#11. Harney County
– March unemployment rate (preliminary): 4.8%
— 1 month change: Down 1.7 percentage points
— 1 year change: Down 0.3 percentage points
– Total labor force: 3,688 people (177 unemployed)

Manuela Durson // Shutterstock
#10. Curry County
– March unemployment rate (preliminary): 4.8%
— 1 month change: Down 1.2 percentage points
— 1 year change: Down 0.5 percentage points
– Total labor force: 8,781 people (424 unemployed)

Canva
#9. Jefferson County
– March unemployment rate (preliminary): 5%
— 1 month change: Down 1.2 percentage points
— 1 year change: Down 0.6 percentage points
– Total labor force: 10,267 people (514 unemployed)

Canva
#8. Douglas County
– March unemployment rate (preliminary): 5%
— 1 month change: Down 1.0 percentage points
— 1 year change: Up 0.1 percentage points
– Total labor force: 46,408 people (2,300 unemployed)
Canva
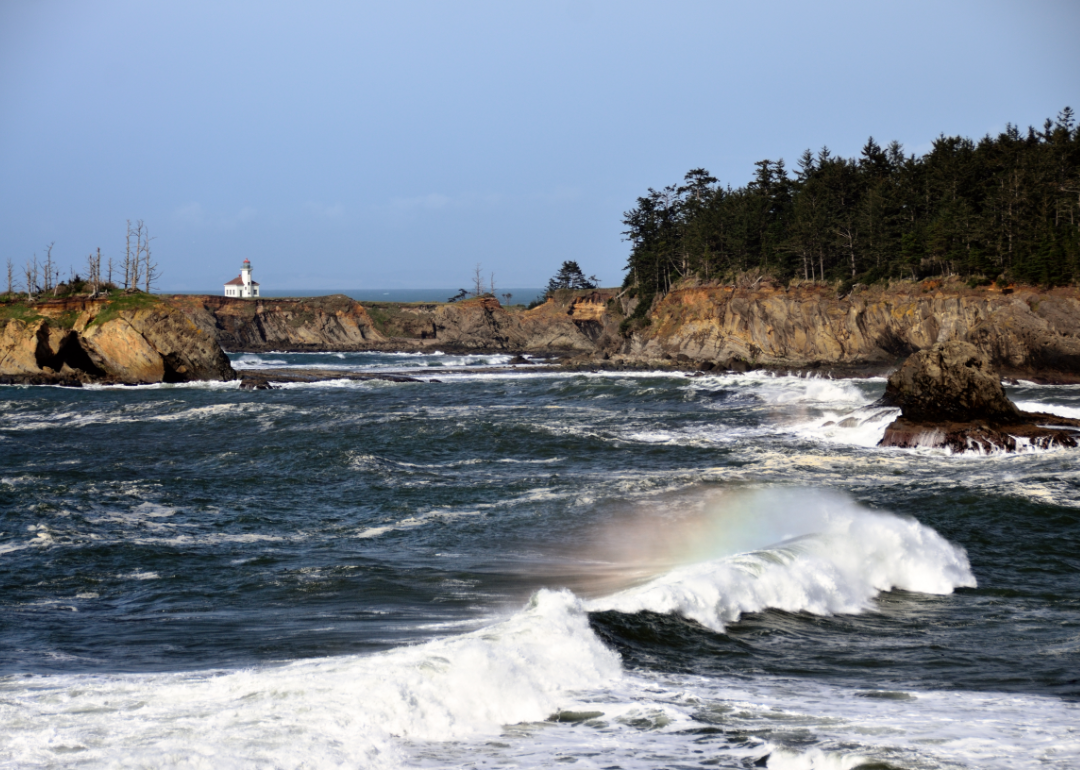
#7. Coos County
– March unemployment rate (preliminary): 5.1%
— 1 month change: Down 0.4 percentage points
— 1 year change: Up 0.3 percentage points
– Total labor force: 26,309 people (1,331 unemployed)
Bob Pool // Shutterstock
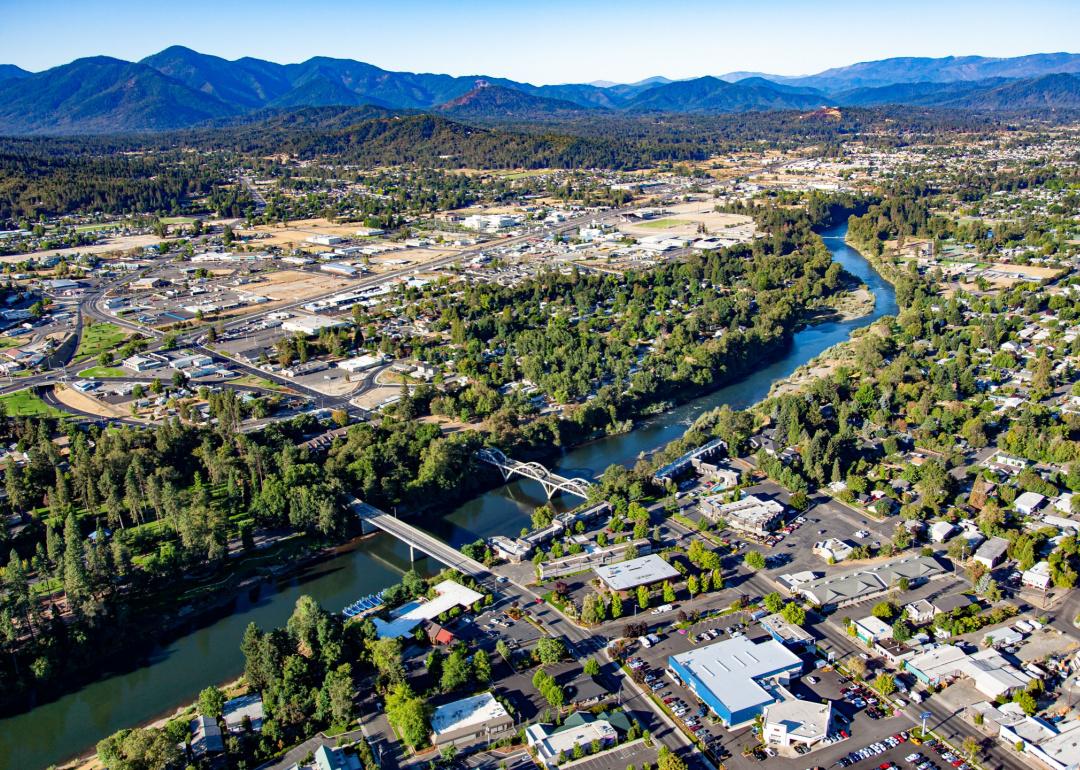
#6. Josephine County
– March unemployment rate (preliminary): 5.1%
— 1 month change: Down 1.3 percentage points
— 1 year change: Down 0.2 percentage points
– Total labor force: 36,249 people (1,866 unemployed)

Dominic Gentilcore PhD // Shutterstock
#5. Lake County
– March unemployment rate (preliminary): 5.4%
— 1 month change: Down 1.3 percentage points
— 1 year change: Down 0.7 percentage points
– Total labor force: 3,586 people (192 unemployed)
Canva
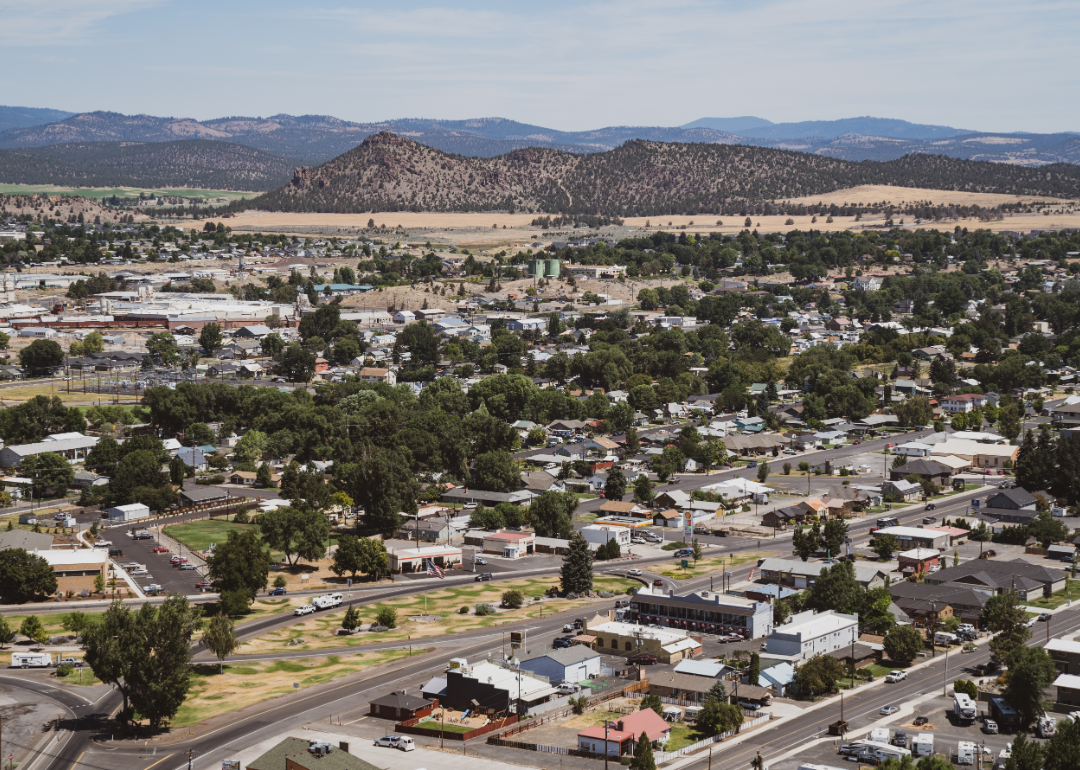
#4. Crook County
– March unemployment rate (preliminary): 5.6%
— 1 month change: Down 1.5 percentage points
— 1 year change: Up 0.3 percentage points
– Total labor force: 11,151 people (625 unemployed)
Canva
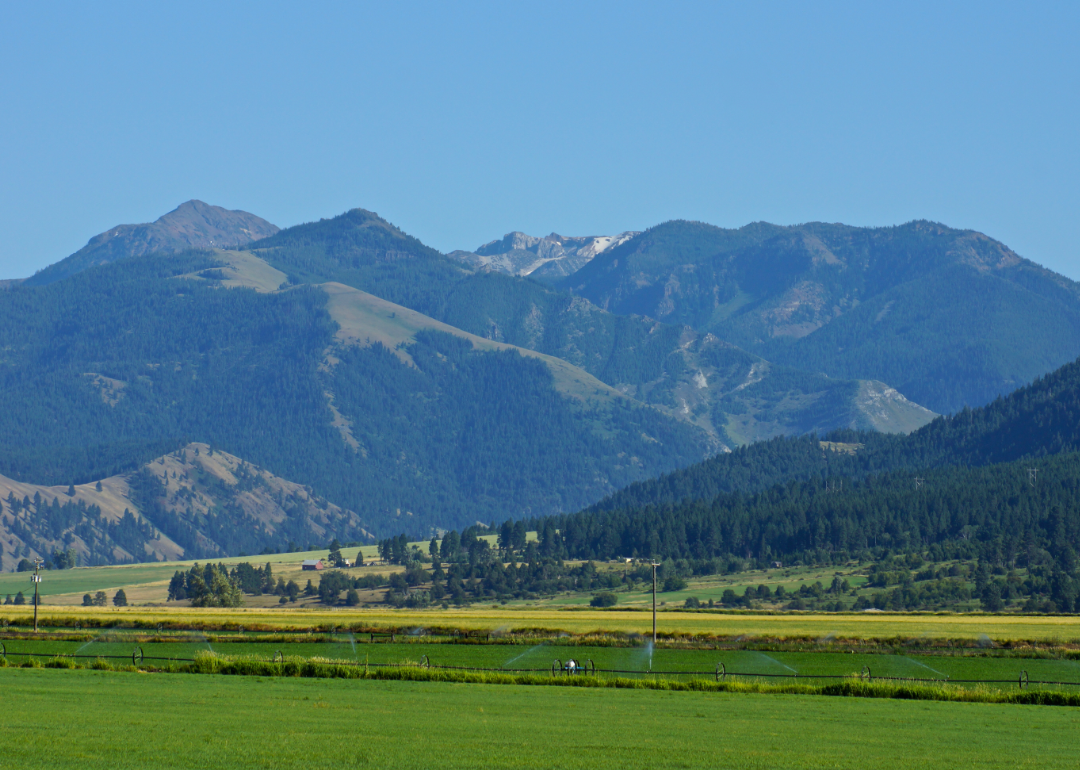
#3. Wallowa County
– March unemployment rate (preliminary): 5.7%
— 1 month change: Down 2.2 percentage points
— 1 year change: Down 0.8 percentage points
– Total labor force: 3,385 people (193 unemployed)
Canva
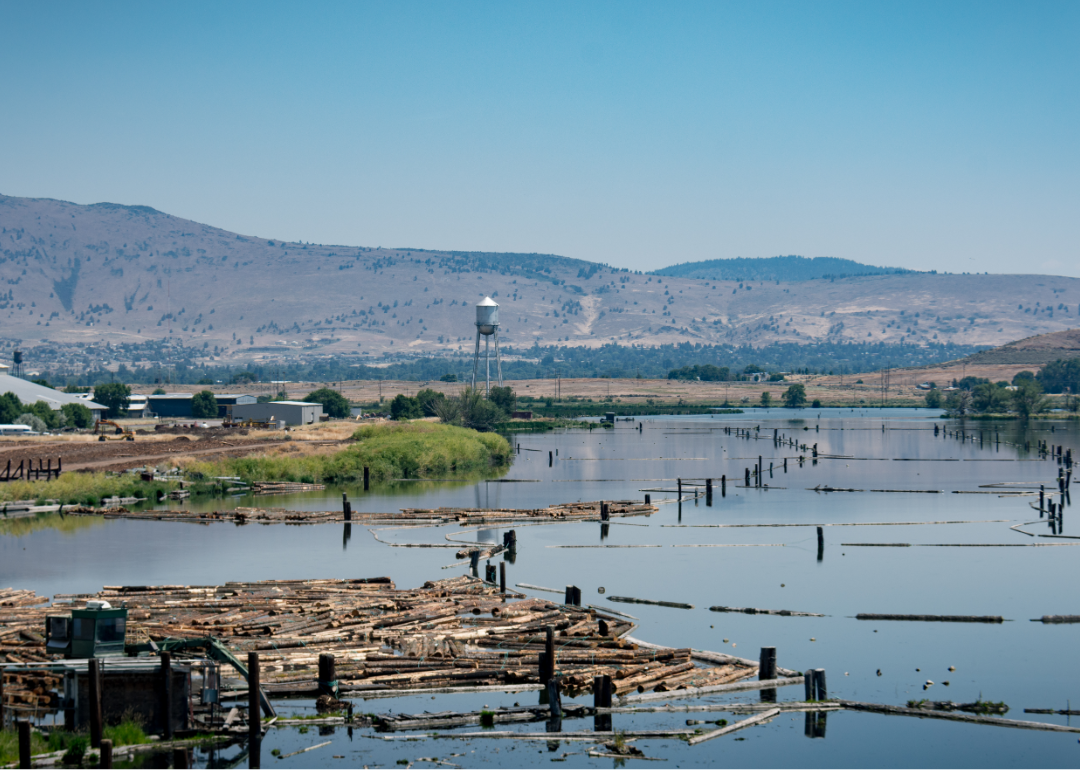
#2. Klamath County
– March unemployment rate (preliminary): 5.8%
— 1 month change: Down 1.7 percentage points
— 1 year change: Down 0.1 percentage points
– Total labor force: 29,528 people (1,722 unemployed)

Dee Browning // Shutterstock
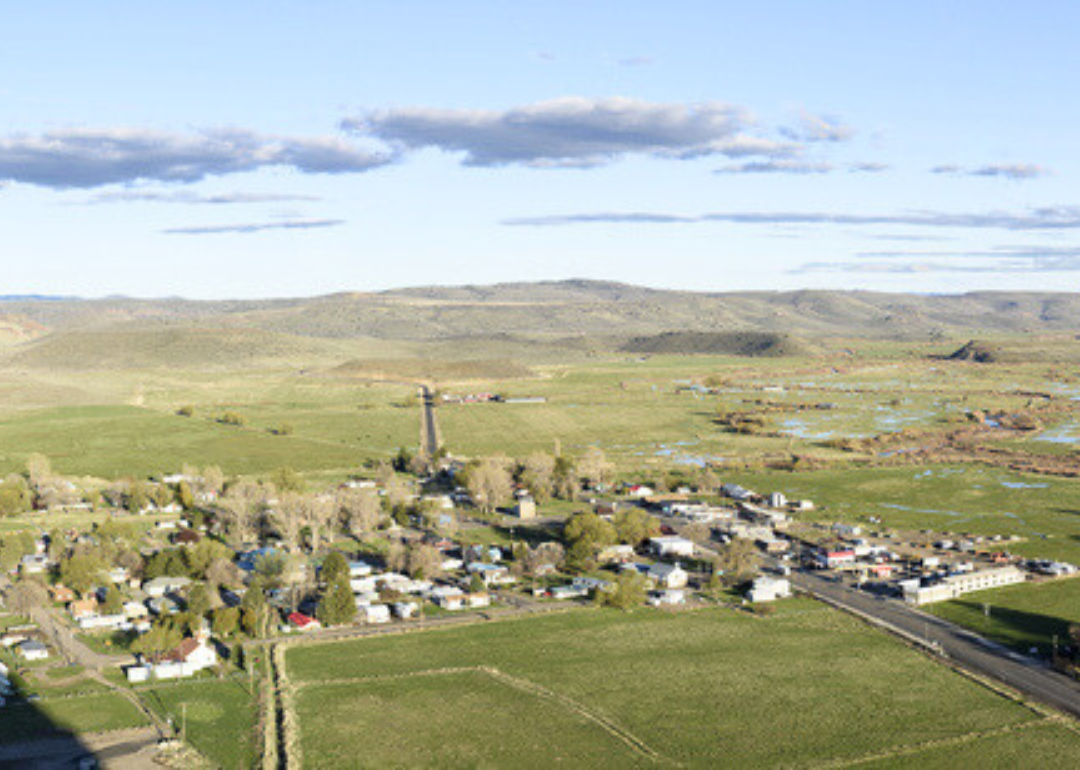
#1. Grant County
– March unemployment rate (preliminary): 6.5%
— 1 month change: Down 1.0 percentage points
— 1 year change: Down 0.9 percentage points
– Total labor force: 3,060 people (199 unemployed)
