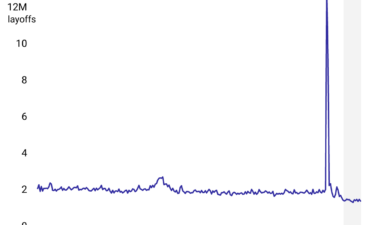
Layoffs in these industries may be down to record lows
Stacker asked an economist why layoffs are at record lows, according to data from the Bureau of Labor Statistics’ Job Openings and Labor Turnover Survey.
Continue Reading
Stacker asked an economist why layoffs are at record lows, according to data from the Bureau of Labor Statistics’ Job Openings and Labor Turnover Survey.
Continue Reading

Pyn compiled a list of icebreaker games that can be done virtually—along with instructions on how to play them—from sources across the web.
Continue Reading
New Jersey Real Estate Network collected U.S. Census Bureau data to understand which metro regions have the most old homes, which include houses built in 1949 or earlier.
Continue Reading
This Giving Assistant analysis of U.S. Census data shows which industries have experienced the highest growth in online sales.
Continue Reading

Not everyone learns the same. The VARK model identifies four types of learners: visual, auditory, read and write, and kinesthetic. Citing the VARK model, Tovuti LMS outlined the VARK model’s four core types of learning styles.
Continue Reading
Best Universities compiled a list of the most evenly matched, long-running college football rivalries in the U.S., using data from Stathead.
Continue Reading
Using data from the U.S. Department of Education, EDsmart examined how much the Ivy League endowments have grown over 20 years.
Continue Reading

Stacker outlined 30 consequential milestones unions achieved and the circumstances that made those victories worth fighting for.
Continue Reading
Stacker examined foreclosure filing activity compiled by ATTOM Data for July 2022, the latest month for which the data was available.
Continue Reading

To find out where Americans bought the most vehicles over the last five years, Experian looked at the number of auto loans nationwide.
Continue Reading
Americans owed an astounding $1.58 trillion in student loan debt at the end of 2021. Stacker looks at the situation state-by-state.
Continue Reading
Stacker used data from the Office of Federal Financial Aid and other sources to show what $10,000 of loan forgiveness could mean for 45 million borrowers.
Continue Reading
Routific compiled data from company and market reports to tell the story of how COVID-19 spurred growth across the food delivery market.
Continue Reading

America faces a housing deficit but builders are pessimistic. Stacker examined data from the Census Bureau and the Bureau of Labor Statistics to find out why.
Continue Reading
Ironplane compiled a list of five technologies that have improved e-commerce outcomes for businesses and consumers.
Continue Reading
Sound Dollar assembled a list of the most common types of debt in the U.S.
Continue Reading
How do auto insurers calculate rates? Cheap Insurance found seven factors that impact car insurance using research from across the internet.
Continue Reading

Using Realtor.com data, Stacker explored the least expensive metros across the U.S. to purchase a home in July 2022.
Continue Reading
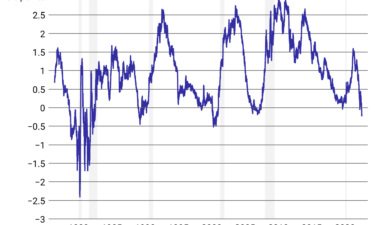
Is a recession ahead for the United States? Stacker examines government and historical data to shed light on where the American economy might be headed.
Continue Reading
Portland Real Estate analyzed data from the Consumer Financial Protection Bureau to see which states took out the highest rate of home improvement loans in 2021.
Continue Reading