‘It’s ridiculous and getting out of hand:’ Central Oregonians express frustration at big hikes in grocery prices
(Update: adding comment from residents, Bureau of Labor Statistics economist)
BEND, Ore. (KTVZ) -- The U.S. Bureau of Labor Statistics released their monthly Consumer Price Index for the Western region of the United States Wednesday morning.
With increasing food prices pinching wallets both at the grocery store and in restaurants, Central Oregon residents are feeling the strain.
According to the Bureau of Labor Statistics, the Western region of the U.S. saw a 2.7% increase in food prices, compared to May of 2023. The figure rose .3% from April.
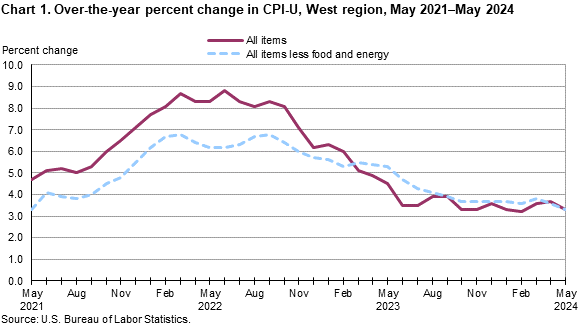
Overall, U.S. consumer prices rose 3.3% in May from a year ago, a bit lower than April's 3.4% figure, helped by lower gas prices.
"It's ridiculous and getting out of hand," Bend resident Haley Mohr said Wednesday.
Another resident, Kat Kent, said, "I think everybody's mad about it, I don't care if you're rich or poor."
Shoppers responded to our sign, saying they are fed up with grocery prices.
"I'm eating not as well, because I can't afford the food that I used to be able to buy," said Harper Gossard, another local resident.
Mohr added, "It definitely makes it hard, especially being a student at OSU-Cascades, when you're on a budget, but you've still got to eat,.
In downtown Bend, residents were anxious to respond to our sign, asking to talk about food prices.
Matthew Insco, an economist with the Bureau of Labor Statistics, told us, “In general, in the West region, overall food expenditures account for approximately 13% of the total consumer expenditures.”
Insco says despite the very evidence rise in costs, the rate of increase is slower than in 2022.
"In August 2022 13.4% over the year," he said. "So while prices are still rising, they are rising at a much slower rate than they were back in 2022."
Prices on meats, poultry fish and eggs increased the most, 3.7% in the past.
Bend resident Herbert Lewis Foret said, "I notice that the prices go up weekly or monthly, but as an observation, they never go back down."
Folks are frustrated that groceries prices have risen while income has felt relatively stagnant by locals, forcing them to pick and choose certain necessities.
Foret said, "I'm on a fixed income, so higher prices will cause me to select another priority and focus on the cost of living."
Mohr said, "I spend at least $60, $70 on five to six items, and that money is taken away from me. And it should really be used for my rent, my car payment, my education and my bills."
According to the Bureau of Labor Statistics, it's still cheaper to eat at home than to eat out. Prices at restaurants rose 4.2% in the past year.
Kent said, "I just don't really think it's fair to the general public. I don't really think it's us doing anybody a favor by allowing grocery prices to increase like this, when we need food to stay sustainable.“
Despite increases across the board, consumers can breathe a little easier when it comes to dairy products. Those prices dropped 0.4% from a year ago and 0.2% from April.
The rest of the information from the release:
Area prices were up 0.1 percent over the past month, up 3.3 percent from a year ago
Prices in the West Region, as measured by the Consumer Price Index for All Urban Consumers (CPI-U), advanced 0.1 percent in May, the U.S. Bureau of Labor Statistics reported today. (See table A.) The May increase was influenced by higher prices for shelter. (Data in this report are not seasonally adjusted. Accordingly, month-to-month changes may reflect seasonal influences.)
Over the last 12 months, the CPI-U increased 3.3 percent. (See chart 1 and table A.) Food prices rose 2.7 percent. Energy prices advanced 5.4 percent, largely the result of an increase in the price of electricity. The index for all items less food and energy advanced 3.3 percent over the year. (See table 1.)
Food
Food prices rose 0.3 percent for the month of May. (See table 1.) Prices for food at home increased 0.3 percent, with higher prices in three of the six grocery categories. Prices for food away from home increased 0.3 percent for the same period.
Over the year, food prices rose 2.7 percent. Prices for food at home increased 1.9 percent since a year ago, led by higher prices for meats, poultry, fish, and eggs (3.7 percent). Overall, prices rose in five of the six grocery categories. Prices for food away from home increased 4.2 percent.
Energy
The energy index fell 0.6 percent over the month. The decrease was mainly due to lower prices for gasoline (-2.2 percent). Prices for natural gas service increased 4.2 percent, and prices for electricity advanced 1.0 percent for the same period.
Energy prices advanced 5.4 percent over the year, largely due to higher prices for electricity (10.0 percent). Prices paid for natural gas service increased 5.1 percent, and prices for gasoline advanced 3.1 percent during the past year.
All items less food and energy
The index for all items less food and energy rose 0.1 percent in May. Higher prices for medical care (0.6 percent) and shelter (0.2 percent) were partially offset by lower prices for apparel (-1.2 percent) and recreation (-0.6 percent).
Over the year, the index for all items less food and energy advanced 3.3 percent. Components contributing to the increase included shelter (4.6 percent) and medical care (4.4 percent). Partly offsetting the increases were price decreases in new and used motor vehicles (-3.3 percent) and apparel (-2.0 percent).
| Month | 2020 | 2021 | 2022 | 2023 | 2024 | |||||
|---|---|---|---|---|---|---|---|---|---|---|
| 1-month | 12-month | 1-month | 12-month | 1-month | 12-month | 1-month | 12-month | 1-month | 12-month | |
| January | 0.3 | 2.9 | 0.2 | 1.4 | 0.9 | 7.7 | 0.9 | 6.3 | 0.7 | 3.3 |
| February | 0.4 | 3.1 | 0.5 | 1.6 | 0.8 | 8.1 | 0.5 | 6.0 | 0.4 | 3.2 |
| March | -0.2 | 2.5 | 0.7 | 2.4 | 1.3 | 8.7 | 0.5 | 5.1 | 0.9 | 3.6 |
| April | -0.4 | 1.3 | 1.0 | 3.9 | 0.7 | 8.3 | 0.5 | 4.9 | 0.6 | 3.7 |
| May | 0.1 | 0.8 | 0.8 | 4.7 | 0.8 | 8.3 | 0.4 | 4.5 | 0.1 | 3.3 |
| June | 0.4 | 1.2 | 0.9 | 5.1 | 1.2 | 8.8 | 0.3 | 3.5 | ||
| July | 0.5 | 1.7 | 0.6 | 5.2 | 0.1 | 8.3 | 0.1 | 3.5 | ||
| August | 0.3 | 1.9 | 0.2 | 5.0 | 0.0 | 8.1 | 0.4 | 3.9 | ||
| September | 0.0 | 1.6 | 0.2 | 5.3 | 0.3 | 8.3 | 0.4 | 3.9 | ||
| October | 0.2 | 1.2 | 0.8 | 6.0 | 0.7 | 8.1 | 0.1 | 3.3 | ||
| November | 0.0 | 1.4 | 0.5 | 6.5 | -0.4 | 7.1 | -0.4 | 3.3 | ||
| December | -0.1 | 1.5 | 0.4 | 7.1 | -0.4 | 6.2 | -0.1 | 3.6 | ||
The June 2024 Consumer Price Index for the West Region is scheduled to be released on July 11, 2024.
Technical Note
The Consumer Price Index for the West Region is published monthly. The Consumer Price Index (CPI) is a measure of the average change in prices over time in a fixed market basket of goods and services. The Bureau of Labor Statistics publishes CPIs for two population groups: (1) a CPI for All Urban Consumers (CPI-U) which covers approximately 93 percent of the total U.S. population and (2) a CPI for Urban Wage Earners and Clerical Workers (CPI-W) which covers approximately 29 percent of the total U.S. population. The CPI-U includes, in addition to wage earners and clerical workers, groups such as professional, managerial, and technical workers, the self-employed, short-term workers, the unemployed, and retirees and others not in the labor force.
The CPI is based on prices of food, clothing, shelter, fuels, transportation fares, charges for doctors' and dentists' services, drugs, and the other goods and services that people buy for day-to-day living. Each month, prices are collected in 75 urban areas across the country from about 6,000 housing units and approximately 22,000 retail establishments—department stores, supermarkets, hospitals, filling stations, and other types of stores and service establishments. All taxes directly associated with the purchase and use of items are included in the index.
The index measures price changes from a designated reference date; for most of the CPI-U the reference base is 1982-84 equals 100. An increase of 7 percent from the reference base, for example, is shown as 107.000. Alternatively, that relationship can also be expressed as the price of a base period market basket of goods and services rising from $100 to $107. For further details see the CPI home page on the internet at www.bls.gov/cpi and the CPI section of the BLS Handbook of Methods available on the internet at www.bls.gov/opub/hom/cpi/.
In calculating the index, price changes for the various items in each location are averaged together with weights that represent their importance in the spending of the appropriate population group. Local data are then combined to obtain a U.S. city average. Because the sample size of a local area is smaller, the local area index is subject to substantially more sampling and other measurement error than the national index. In addition, local indexes are not adjusted for seasonal influences. As a result, local area indexes show greater volatility than the national index, although their long-term trends are quite similar. NOTE: Area indexes do not measure differences in the level of prices between cities; they only measure the average change in prices for each area since the base period.
The West Region covered in this release is comprised of the following thirteen states: Alaska, Arizona, California, Colorado, Hawaii, Idaho, Montana, Nevada, New Mexico, Oregon, Utah, Washington, and Wyoming.
Information in this release will be made available to sensory impaired individuals upon request. Voice phone: 202-691-5200; Telecommunications Relay Service: 7-1-1.