Richest and poorest states in America

Travellaggio // Getty Images
Richest and poorest states in America
Boston skyline in sunny summer day, view of downtown from harbor.
America’s recovery from the COVID-19 pandemic has been complicated by inflation and climbing interest rates. Emergency federal aid helped ordinary citizens, businesses, and government agencies alike make it through the economic slowdown.
But as that dries up, a darker picture is emerging. The poverty rate climbed in 2021, while income inequality grew from 2020 to 2021. And workers actually earned less, and watched the buying power of what they did earn drop.
Stacker looked at the economies of the states and Washington D.C, with statistics from the Census Bureau’s most recent 1-Year American Community Survey, released in September 2022, to rank them according to 2021 median household income. The review also includes statistics on median earnings, unemployment rate, health insurance coverage, and poverty level.
Note: The data point on median earnings is broken down to highlight the discrepancies between women and men. However, the Census collects data with a binary understanding of sex and gender, not considering other gender identities and potentially conflating sex and gender.
You may also like: Marijuana violations are taking truck drivers off the road, adding more supply chain disruptions
![]()

Canva
#51. Mississippi
A wide view of the state capitol.
– Median household income: $48,716 (30.1% less than U.S. median income)
– Households earning less than $10,000: 105,133 (9.30%)
– Households earning over $200,000: 40,061 (3.50%)
– Median earnings for workers: $32,242 (men: $47,546; women: $37,056)
– Unemployment rate: 6.40%
– Families with income below poverty level: 14.40%
– Households with health insurance: 88.10%
Sean Pavone // Getty Images
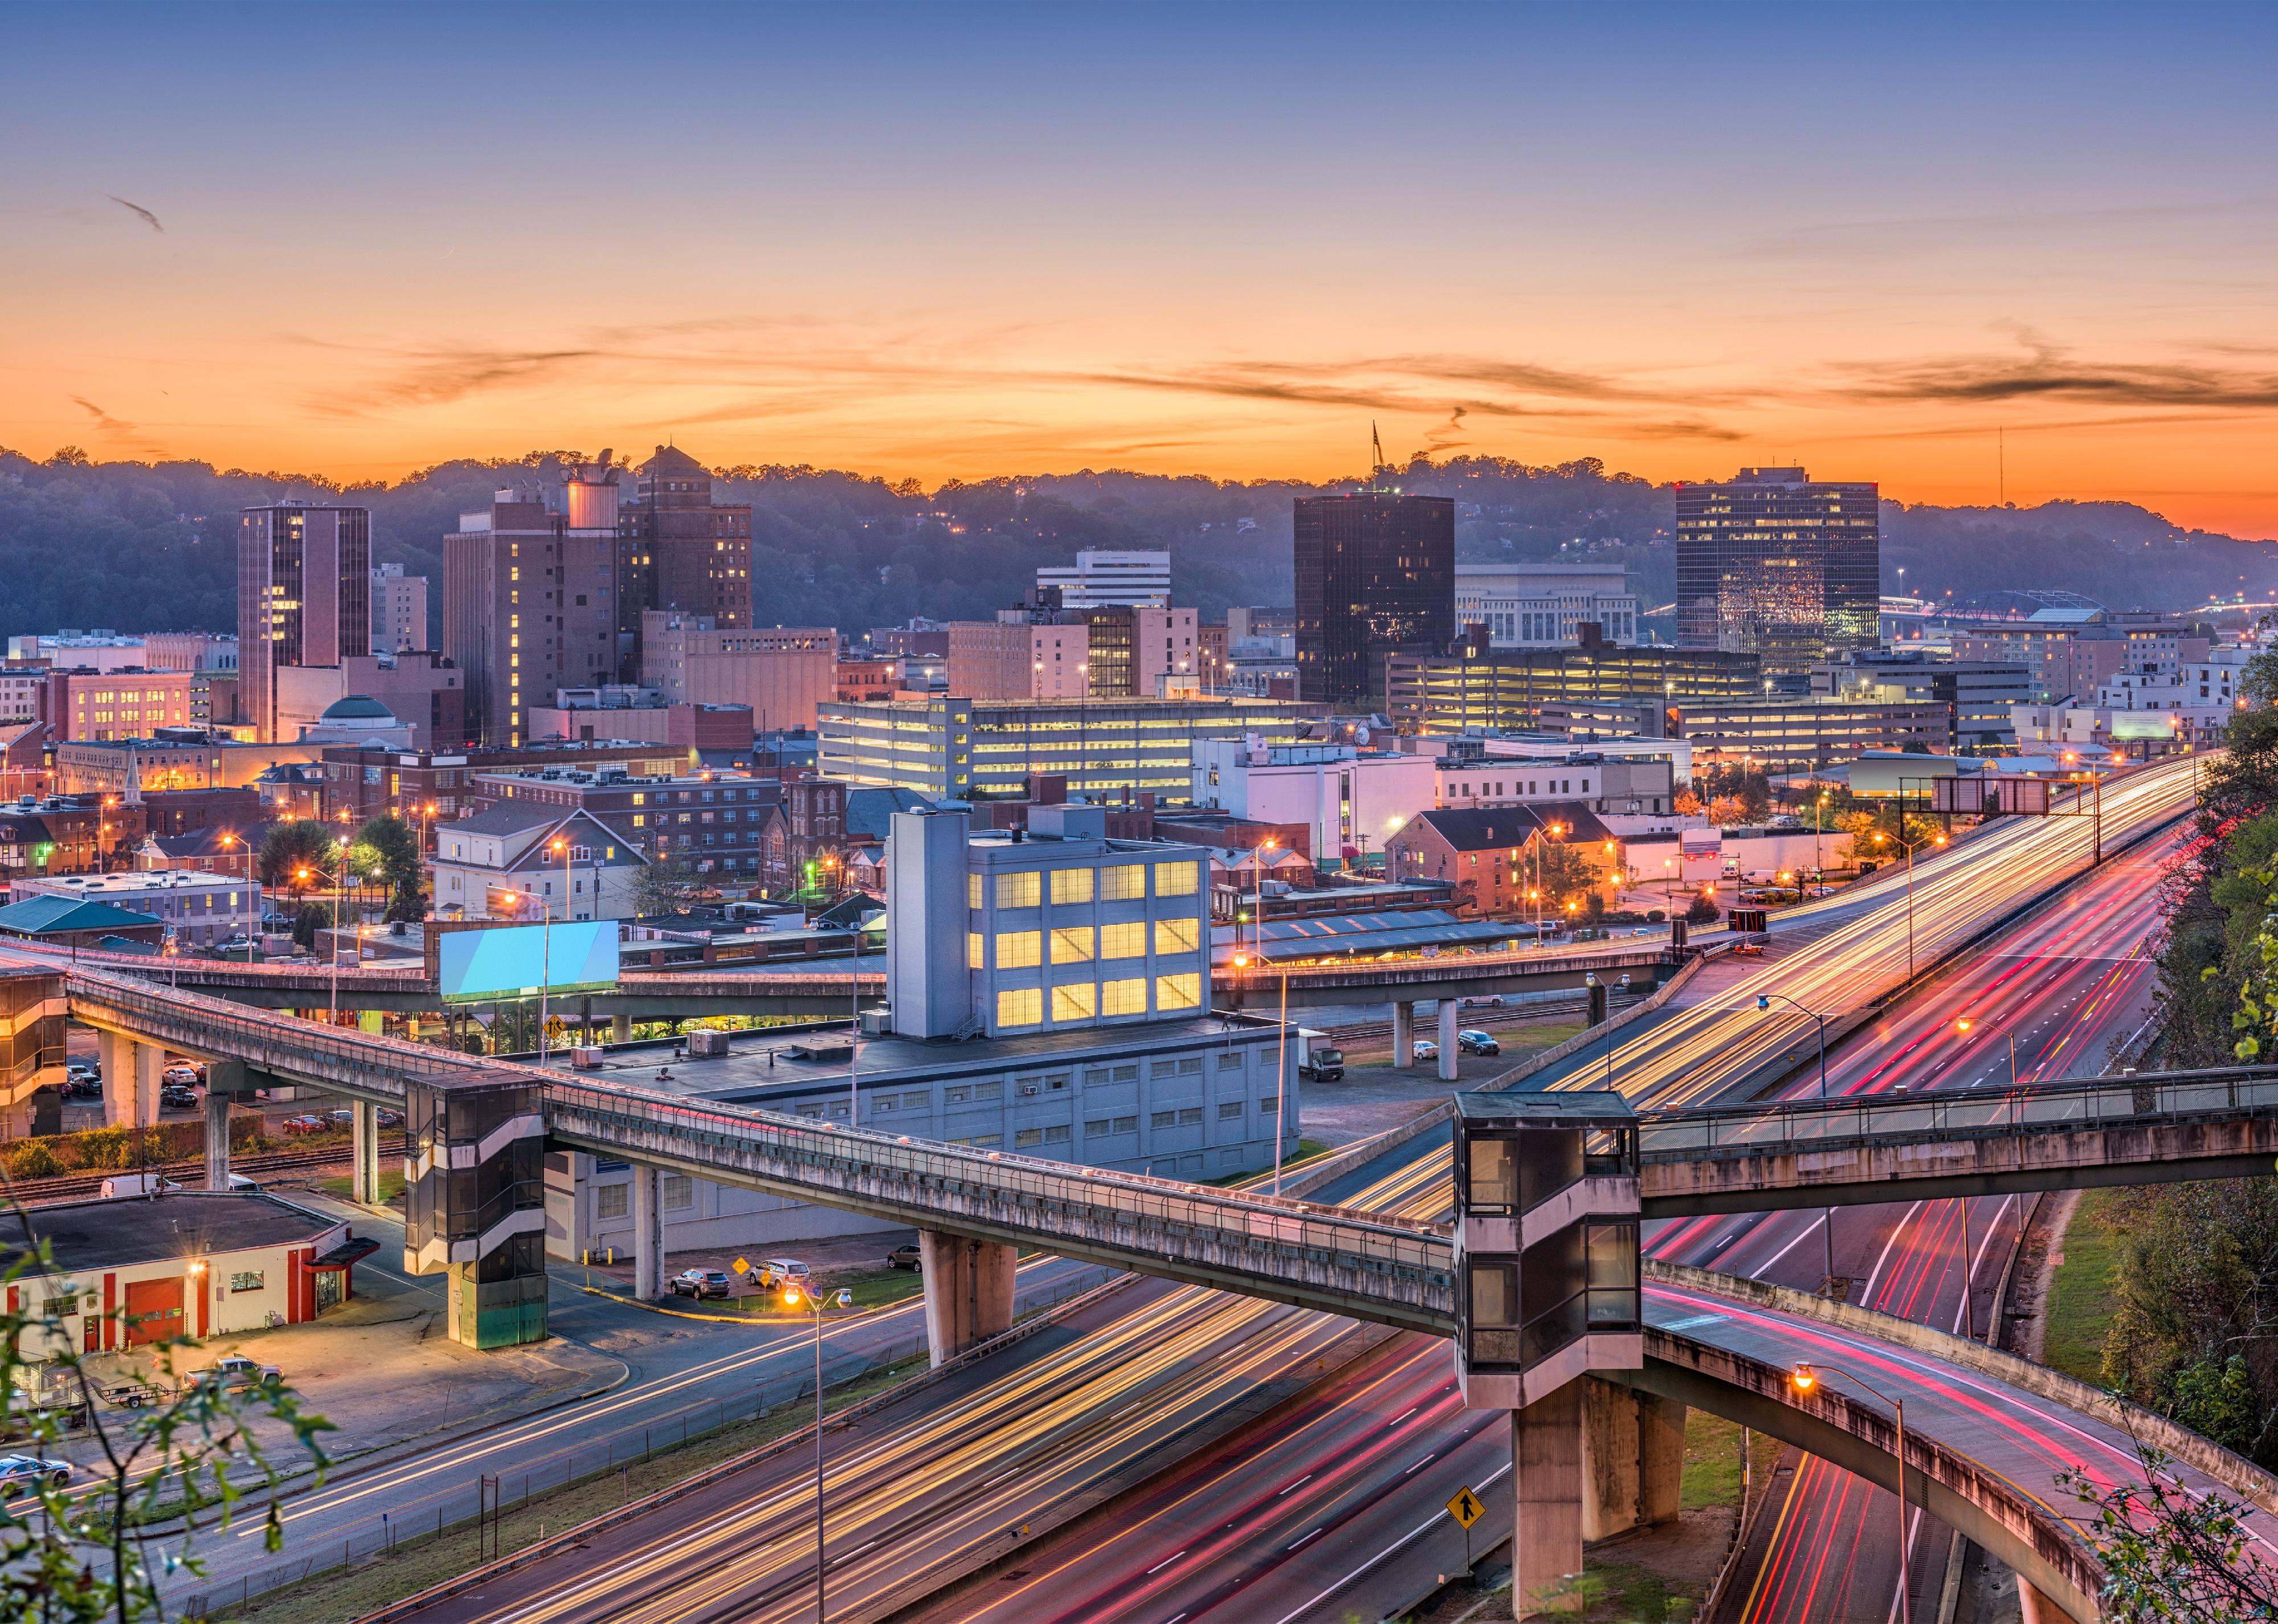
#50. West Virginia
Charleston skyline at twilight.
– Median household income: $51,248 (26.5% less than U.S. median income)
– Households earning less than $10,000: 60,933 (8.40%)
– Households earning over $200,000: 31,442 (4.40%)
– Median earnings for workers: $33,739 (men: $51,981; women: $39,897)
– Unemployment rate: 6.20%
– Families with income below poverty level: 12.30%
– Households with health insurance: 93.90%

Pierre Jean Durieu // Getty Images
#49. Louisiana
Spanish moss in the Louisiana Bayou.
– Median household income: $52,087 (25.3% less than U.S. median income)
– Households earning less than $10,000: 164,981 (9.20%)
– Households earning over $200,000: 101,388 (5.70%)
– Median earnings for workers: $34,896 (men: $55,078; women: $40,136)
– Unemployment rate: 7.60%
– Families with income below poverty level: 15.20%
– Households with health insurance: 92.40%
Eduardo Medrano // Getty Images
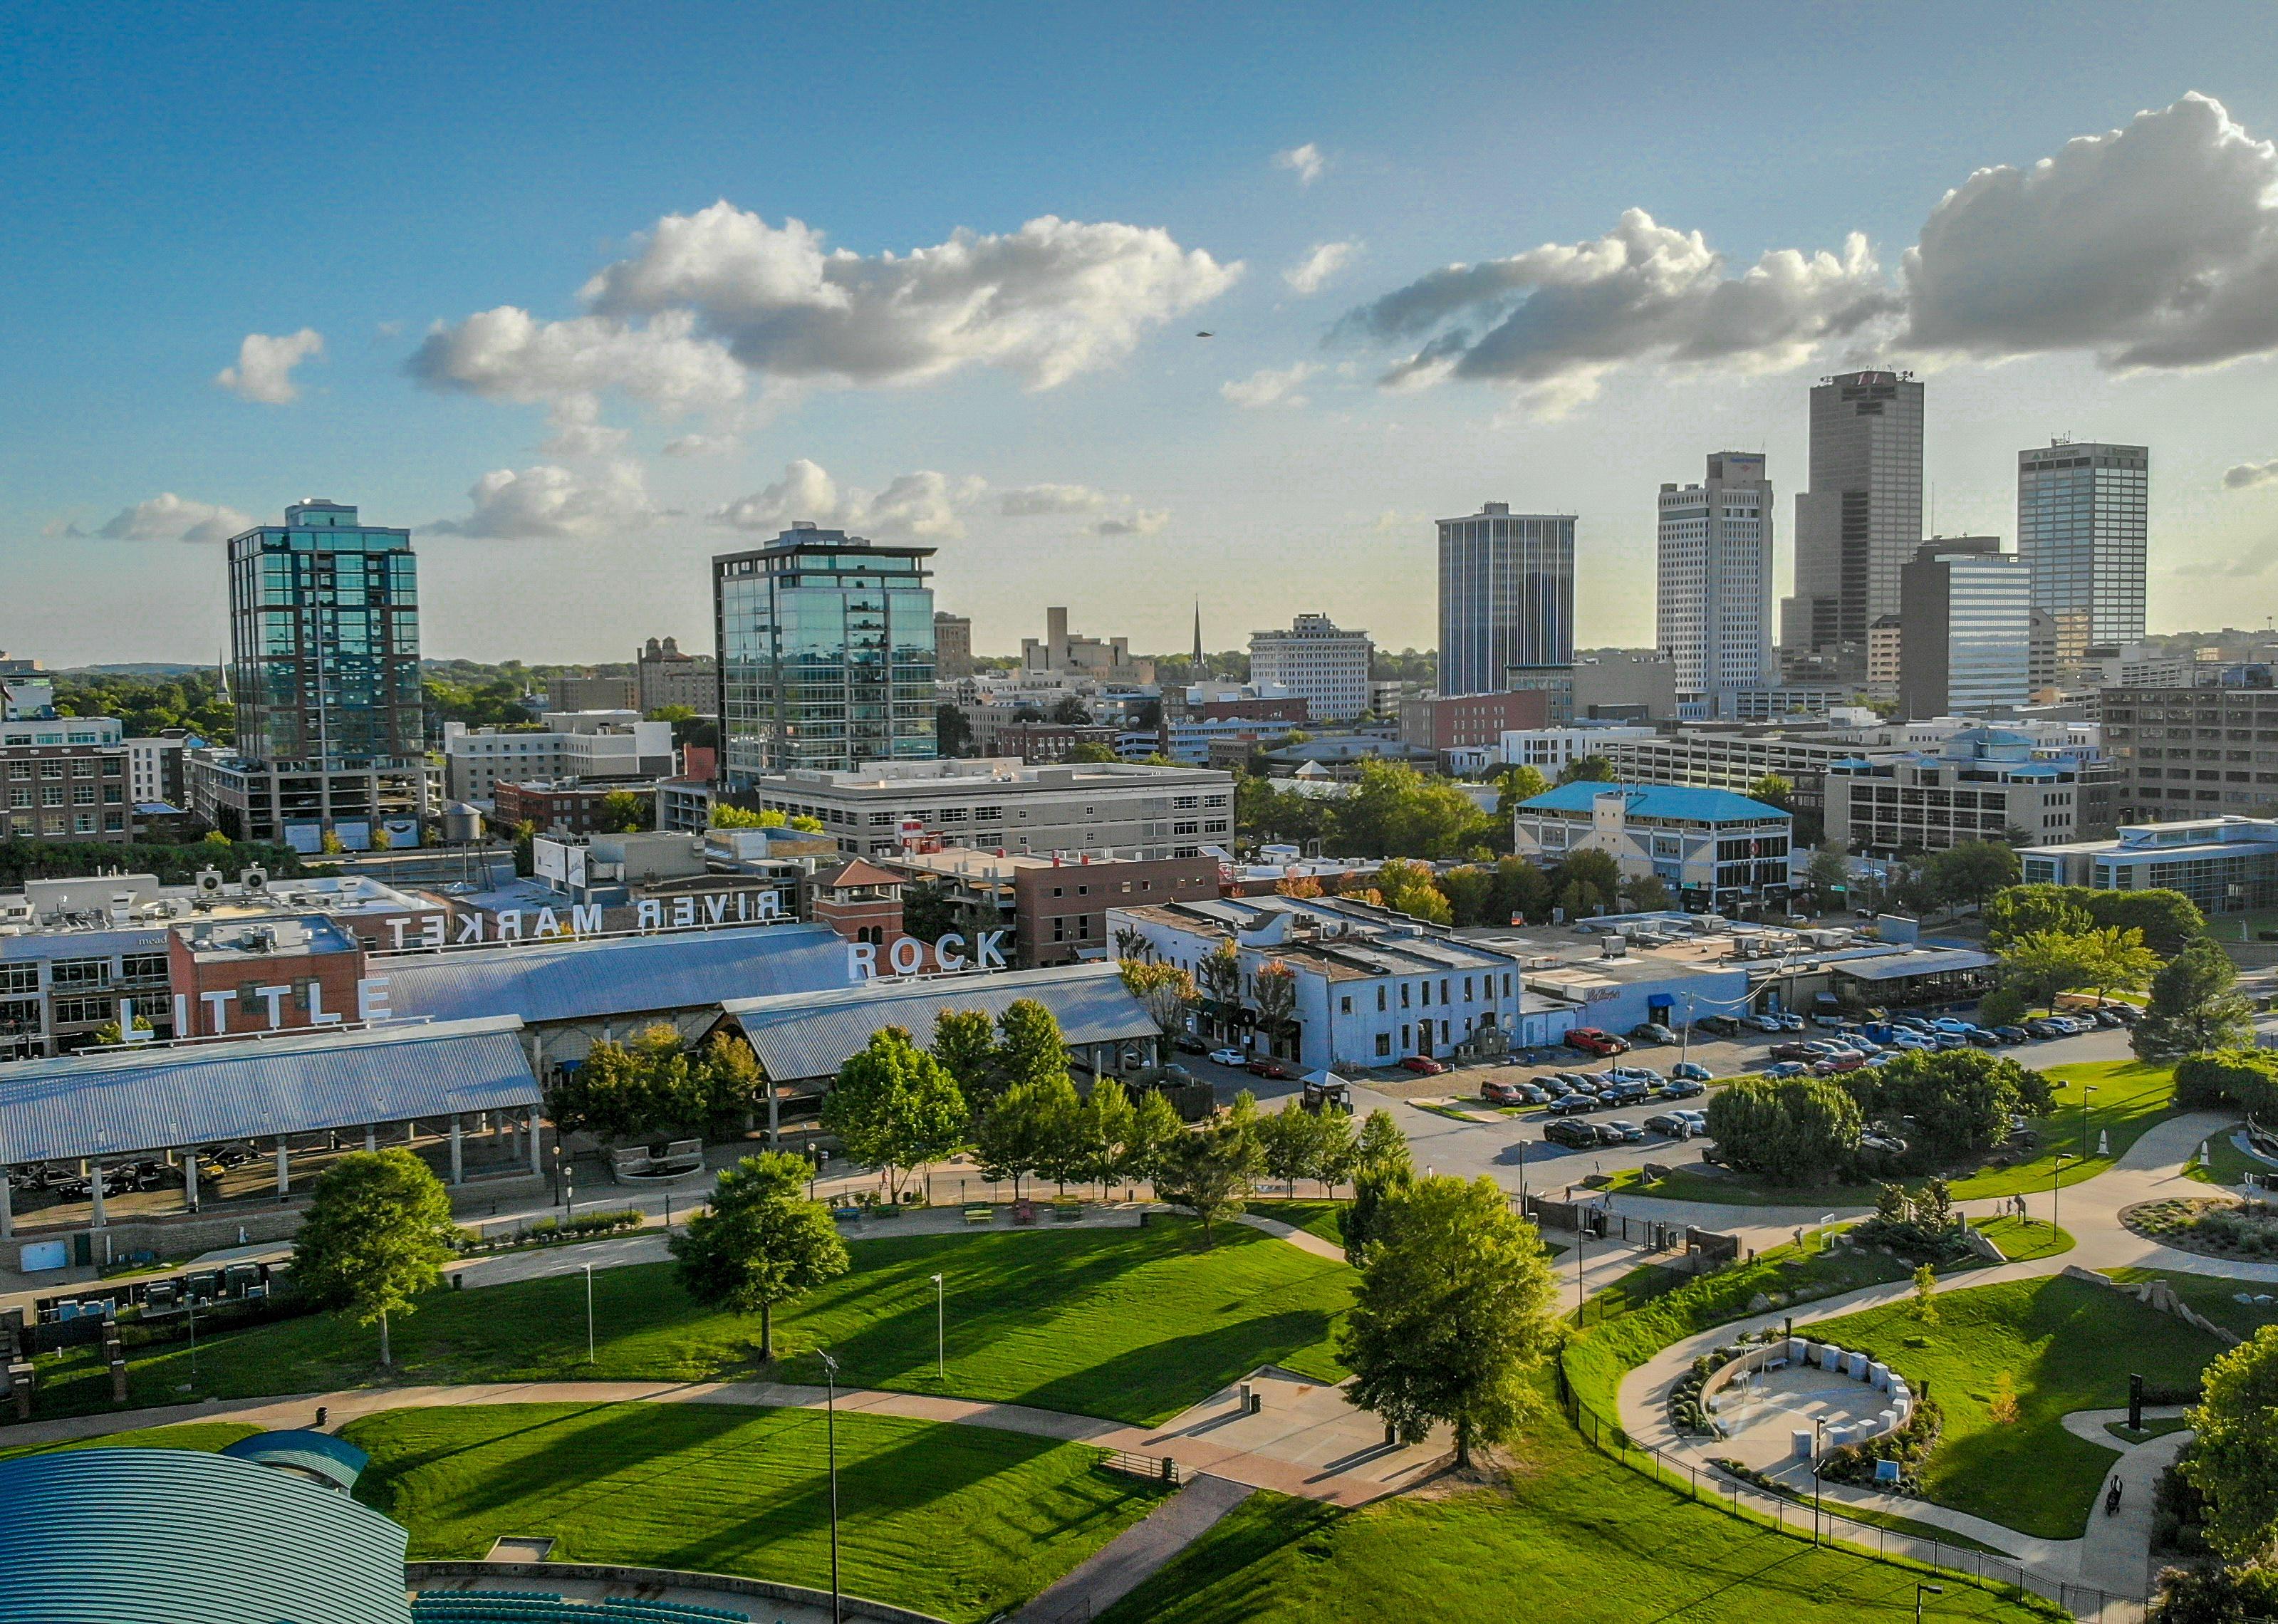
#48. Arkansas
Skyline afternoon in downtown Little Rock.
– Median household income: $52,528 (24.7% less than U.S. median income)
– Households earning less than $10,000: 89,818 (7.60%)
– Households earning over $200,000: 55,972 (4.70%)
– Median earnings for workers: $33,869 (men: $47,329; women: $39,526)
– Unemployment rate: 5.50%
– Families with income below poverty level: 11.60%
– Households with health insurance: 90.80%
Kevin Ruck // Getty Images
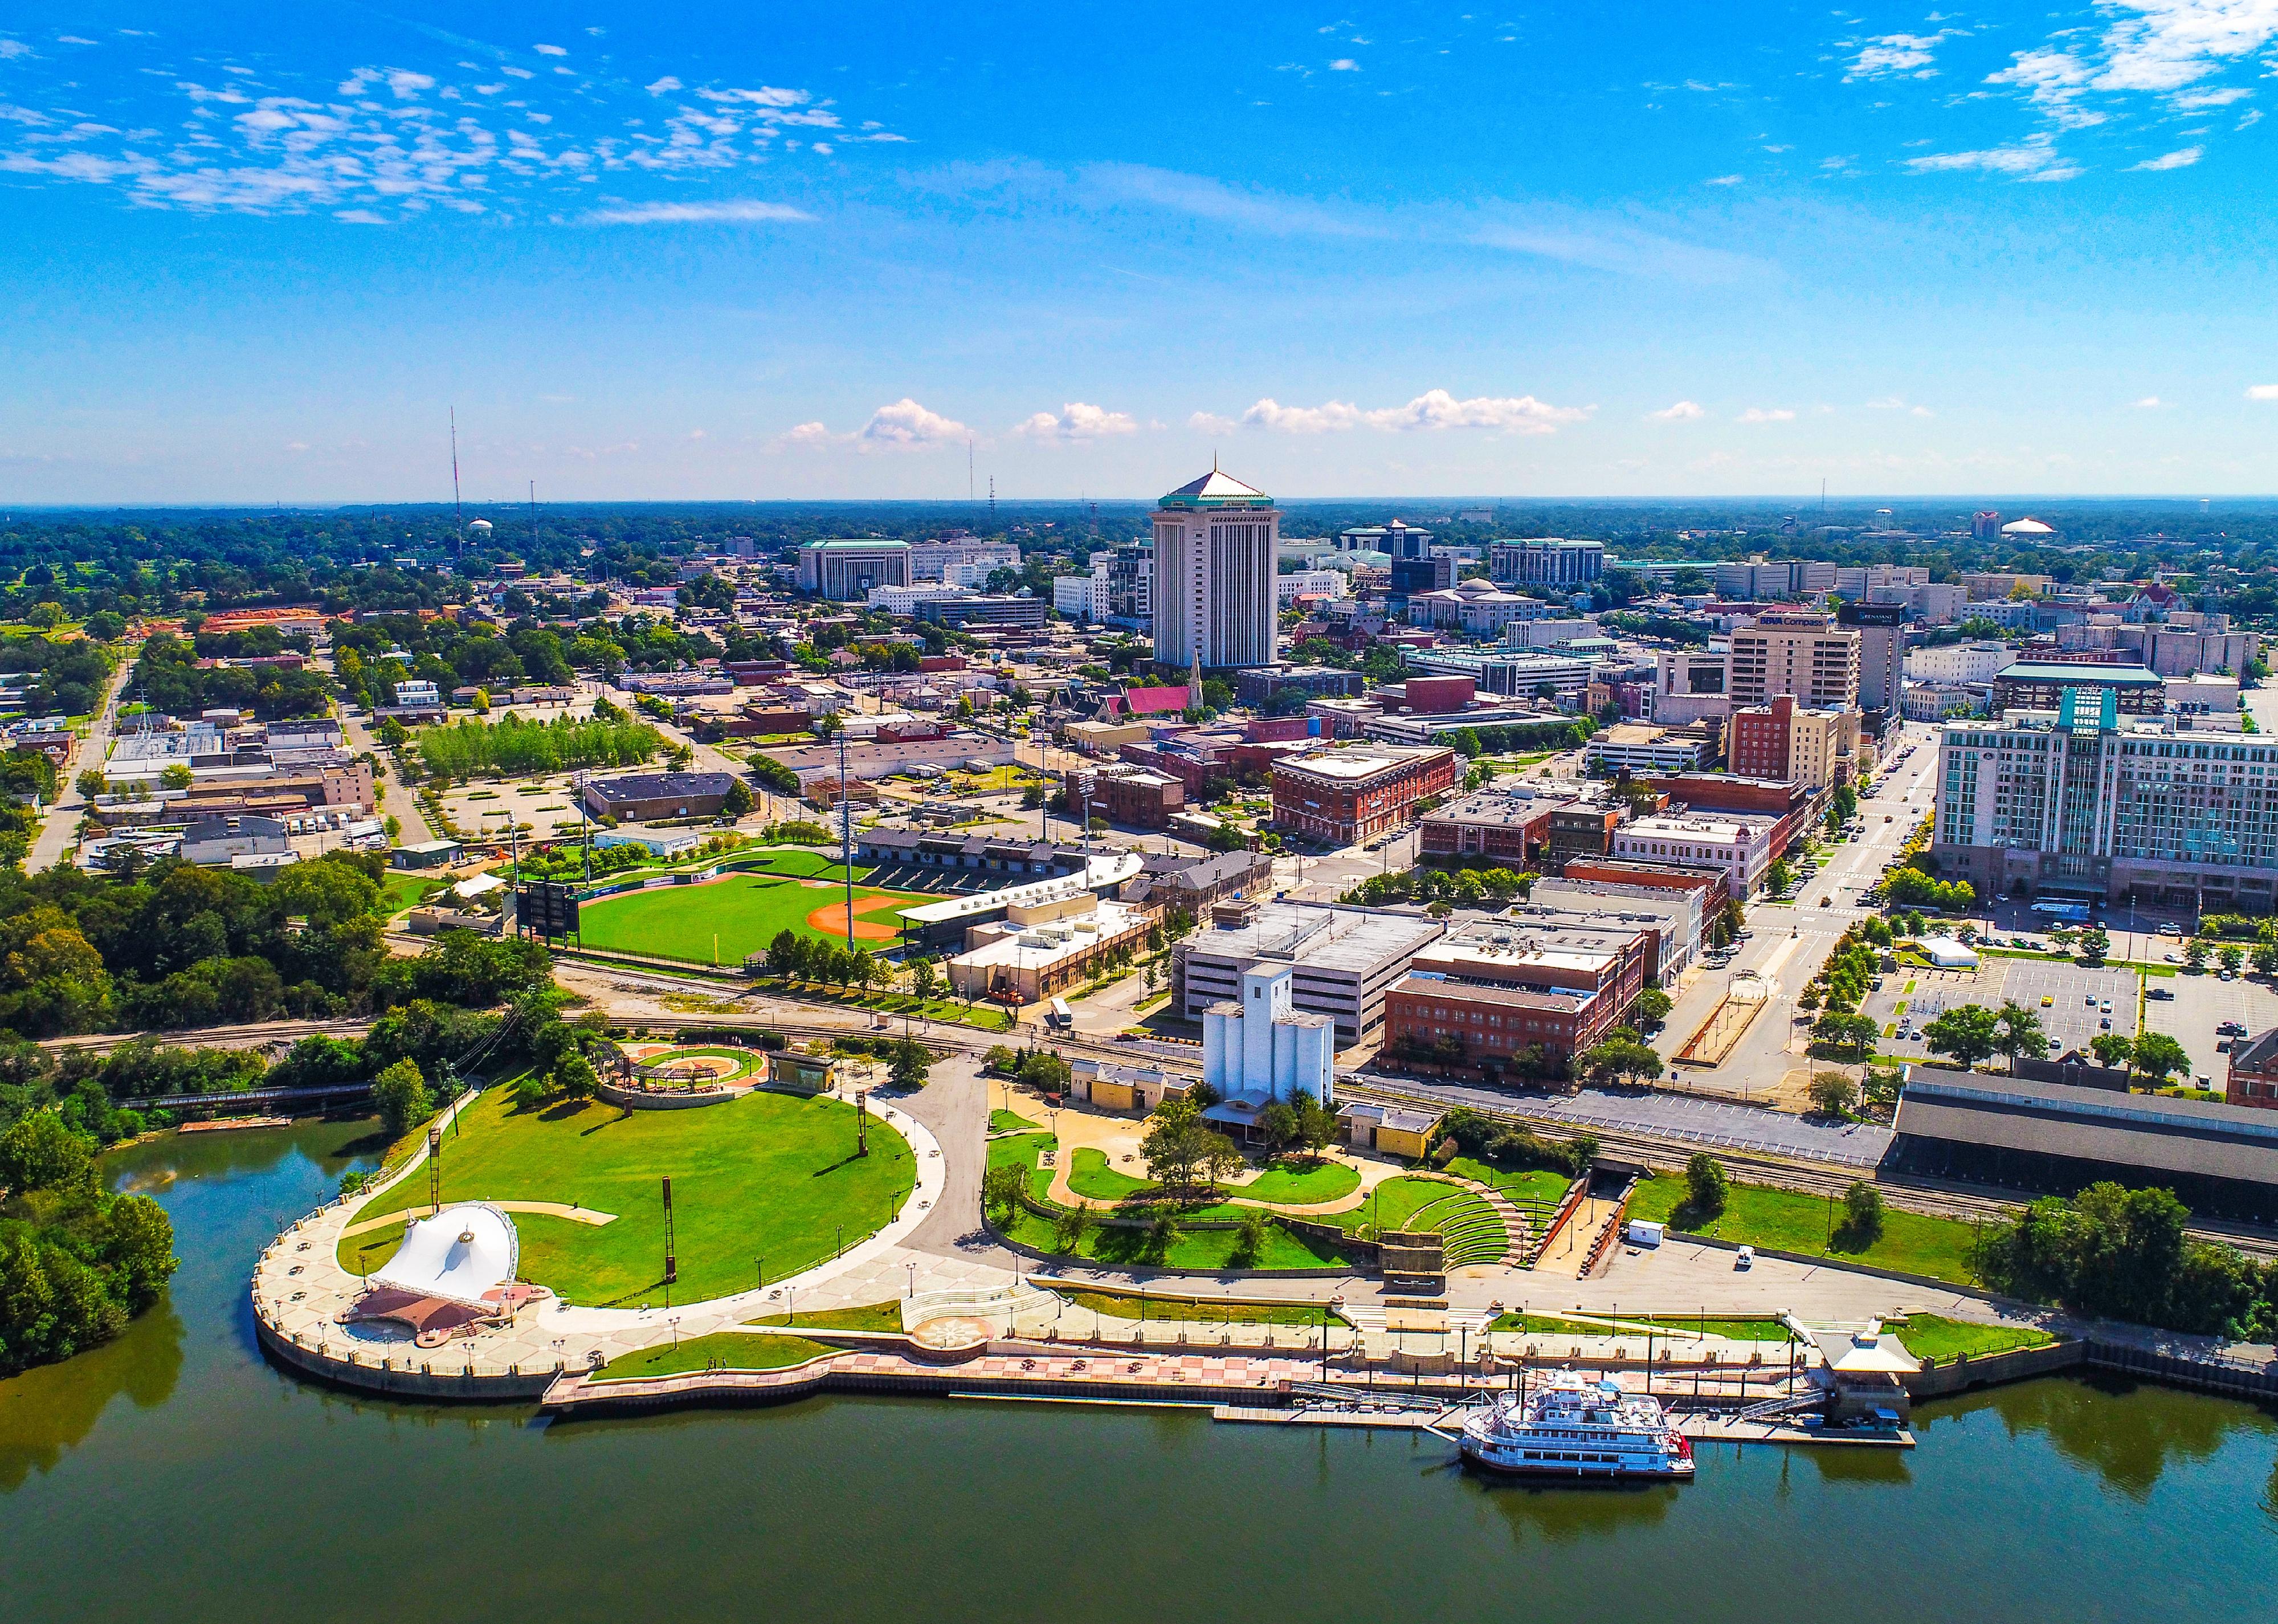
#47. Alabama
Aerial view of downtown Montgomery.
– Median household income: $53,913 (22.7% less than U.S. median income)
– Households earning less than $10,000: 152,450 (7.70%)
– Households earning over $200,000: 101,831 (5.20%)
– Median earnings for workers: $34,925 (men: $52,177; women: $39,338)
– Unemployment rate: 5.30%
– Families with income below poverty level: 11.70%
– Households with health insurance: 90.10%
You may also like: 50 car companies that no longer exist

gmeland // Getty Images
#46. New Mexico
Balloons over the Rio Grande.
– Median household income: $53,992 (22.6% less than U.S. median income)
– Households earning less than $10,000: 75,083 (9.00%)
– Households earning over $200,000: 48,458 (5.80%)
– Median earnings for workers: $34,133 (men: $51,149; women: $43,227)
– Unemployment rate: 7.80%
– Families with income below poverty level: 14.30%
– Households with health insurance: 90.00%

Alexey Stiop // Getty Images
#45. Kentucky
Kentucky country evening.
– Median household income: $55,573 (20.3% less than U.S. median income)
– Households earning less than $10,000: 144,592 (8.10%)
– Households earning over $200,000: 92,250 (5.20%)
– Median earnings for workers: $34,928 (men: $51,842; women: $40,991)
– Unemployment rate: 5.40%
– Families with income below poverty level: 12.20%
– Households with health insurance: 94.30%

Paul Brady Photography // Getty Images
#44. Oklahoma
Skyline of Oklahoma City with OKC sign and ferris wheel.
– Median household income: $55,826 (19.9% less than U.S. median income)
– Households earning less than $10,000: 105,917 (6.80%)
– Households earning over $200,000: 77,228 (5.00%)
– Median earnings for workers: $34,460 (men: $51,289; women: $39,781)
– Unemployment rate: 5.90%
– Families with income below poverty level: 11.50%
– Households with health insurance: 86.20%

Sean Pavone // Getty Images
#43. South Carolina
Charleston in the French Quarter.
– Median household income: $59,318 (14.9% less than U.S. median income)
– Households earning less than $10,000: 144,668 (7.10%)
– Households earning over $200,000: 122,320 (6.00%)
– Median earnings for workers: $35,987 (men: $52,296; women: $40,739)
– Unemployment rate: 5.60%
– Families with income below poverty level: 10.80%
– Households with health insurance: 90.00%
Kevin Ruck // Getty Images
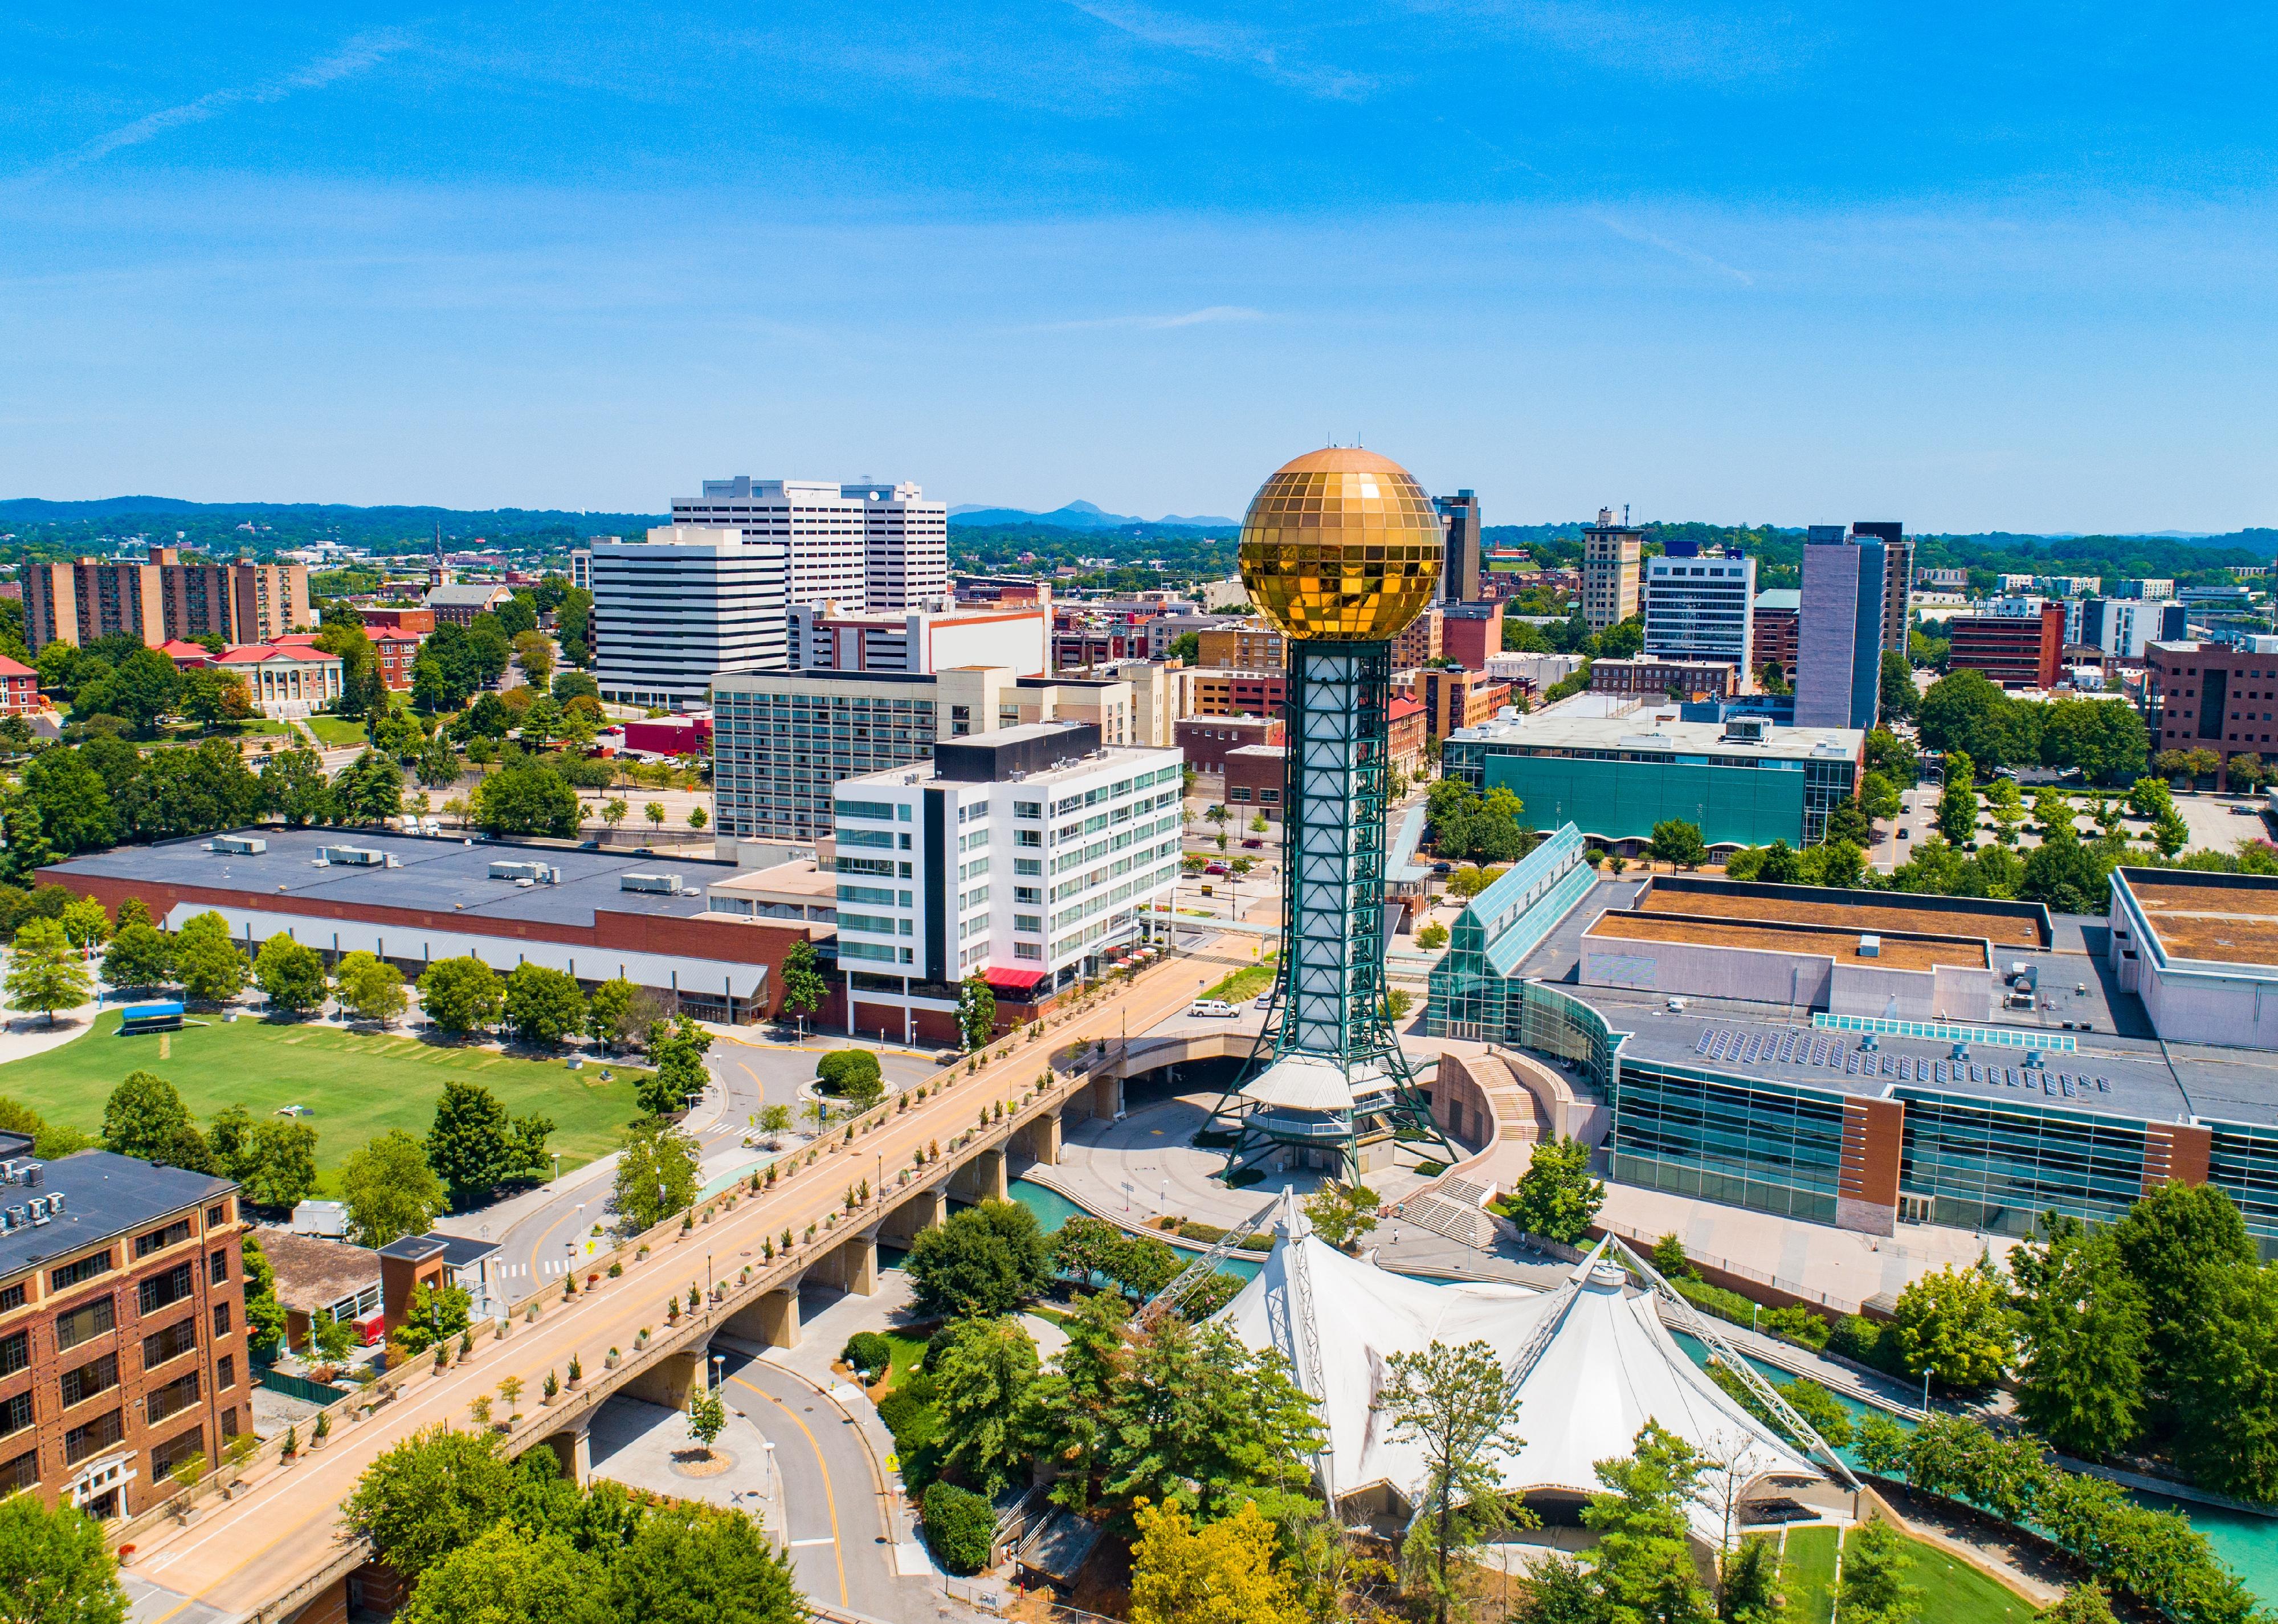
#42. Tennessee
Downtown Knoxville aerial view of skyline.
– Median household income: $59,695 (14.4% less than U.S. median income)
– Households earning less than $10,000: 181,576 (6.60%)
– Households earning over $200,000: 175,898 (6.30%)
– Median earnings for workers: $36,663 (men: $51,538; women: $41,863)
– Unemployment rate: 5.30%
– Families with income below poverty level: 9.70%
– Households with health insurance: 90.00%
You may also like: States with the largest unionized workforces
Sean Pavone // Getty Images
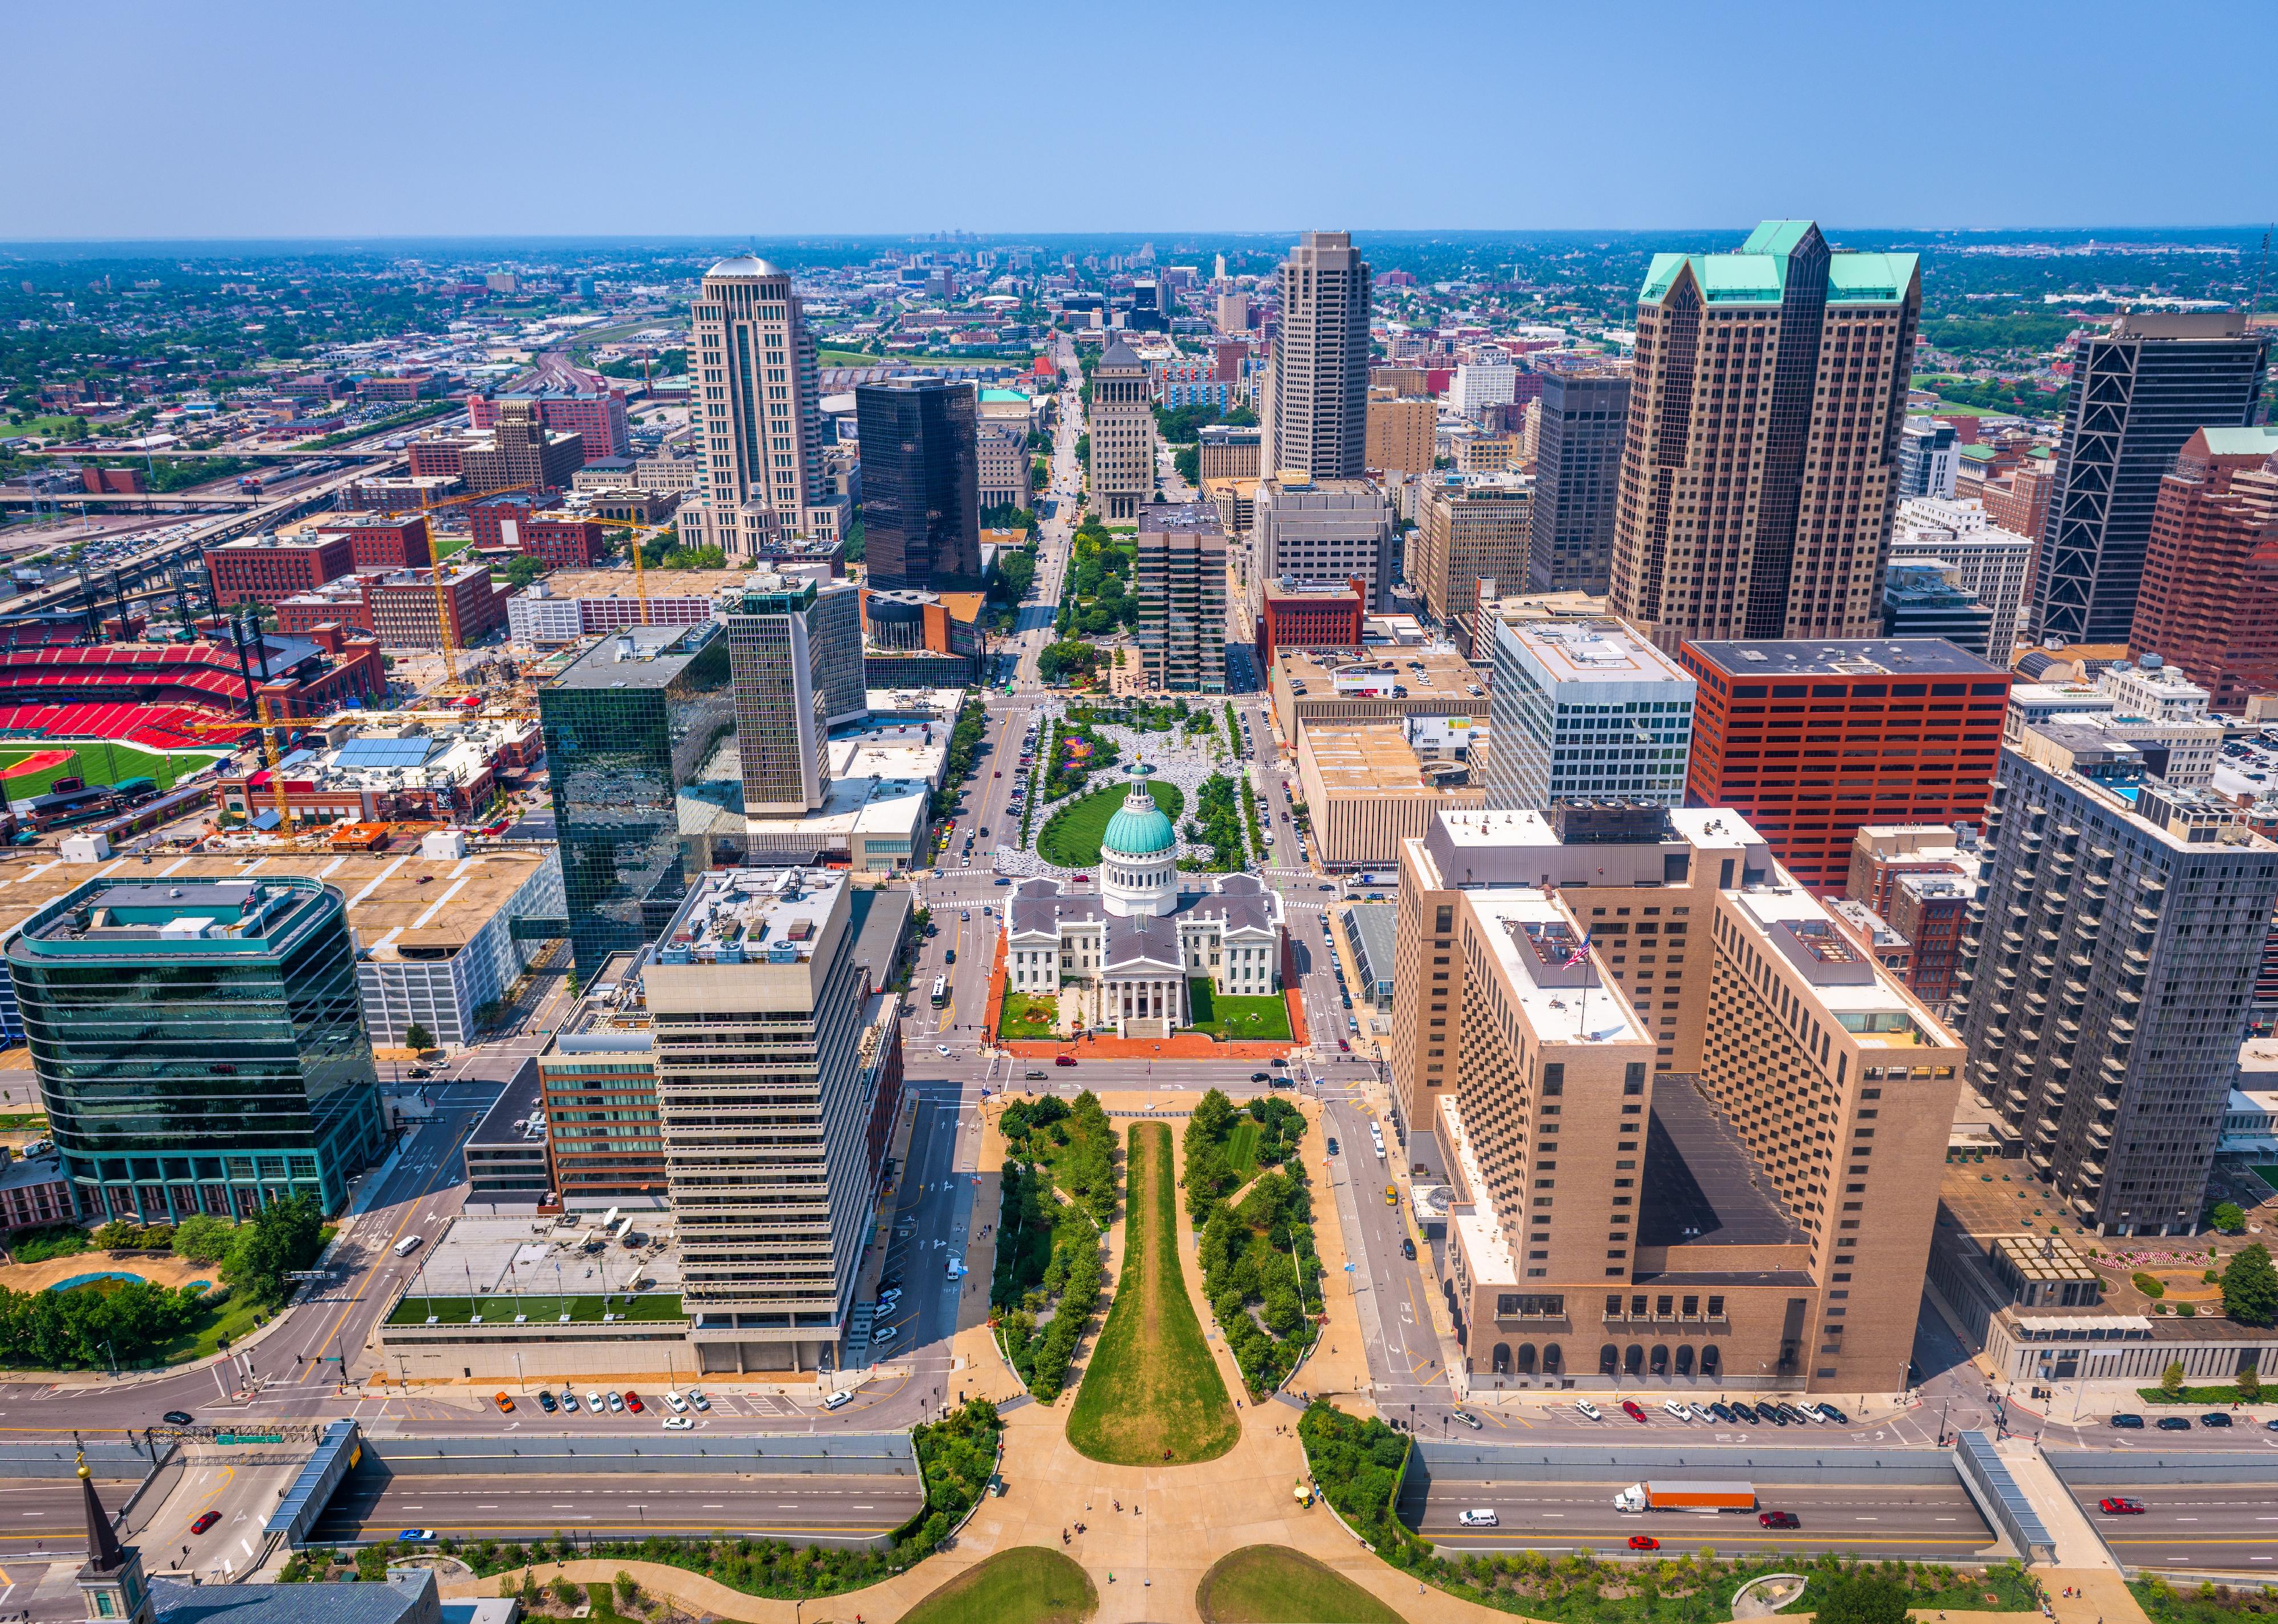
#41. Missouri
Downtown St. Louis skyline from above.
– Median household income: $61,847 (11.3% less than U.S. median income)
– Households earning less than $10,000: 146,475 (5.90%)
– Households earning over $200,000: 157,589 (6.40%)
– Median earnings for workers: $37,083 (men: $54,140; women: $43,065)
– Unemployment rate: 4.60%
– Families with income below poverty level: 8.40%
– Households with health insurance: 90.60%
Canva
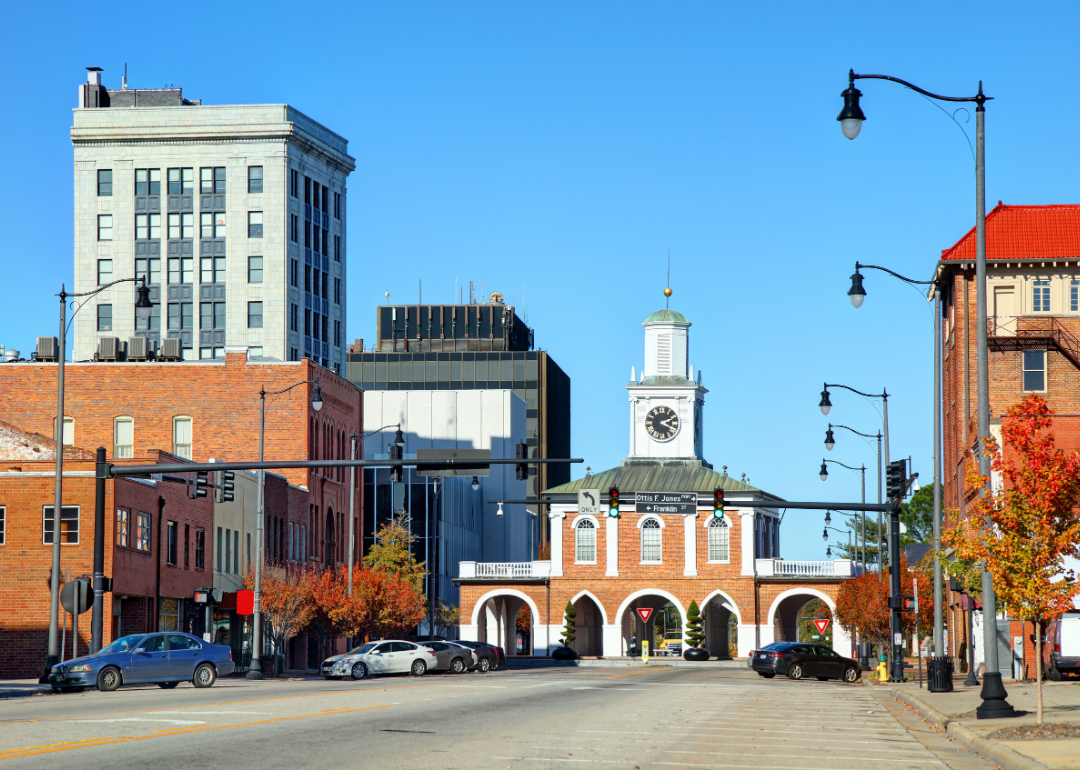
#40. North Carolina
A clock tower in the middle of a small town.
– Median household income: $61,972 (11.1% less than U.S. median income)
– Households earning less than $10,000: 265,655 (6.40%)
– Households earning over $200,000: 308,936 (7.40%)
– Median earnings for workers: $37,218 (men: $52,421; women: $44,297)
– Unemployment rate: 5.80%
– Families with income below poverty level: 9.40%
– Households with health insurance: 89.60%
Sean Pavone // Getty Images
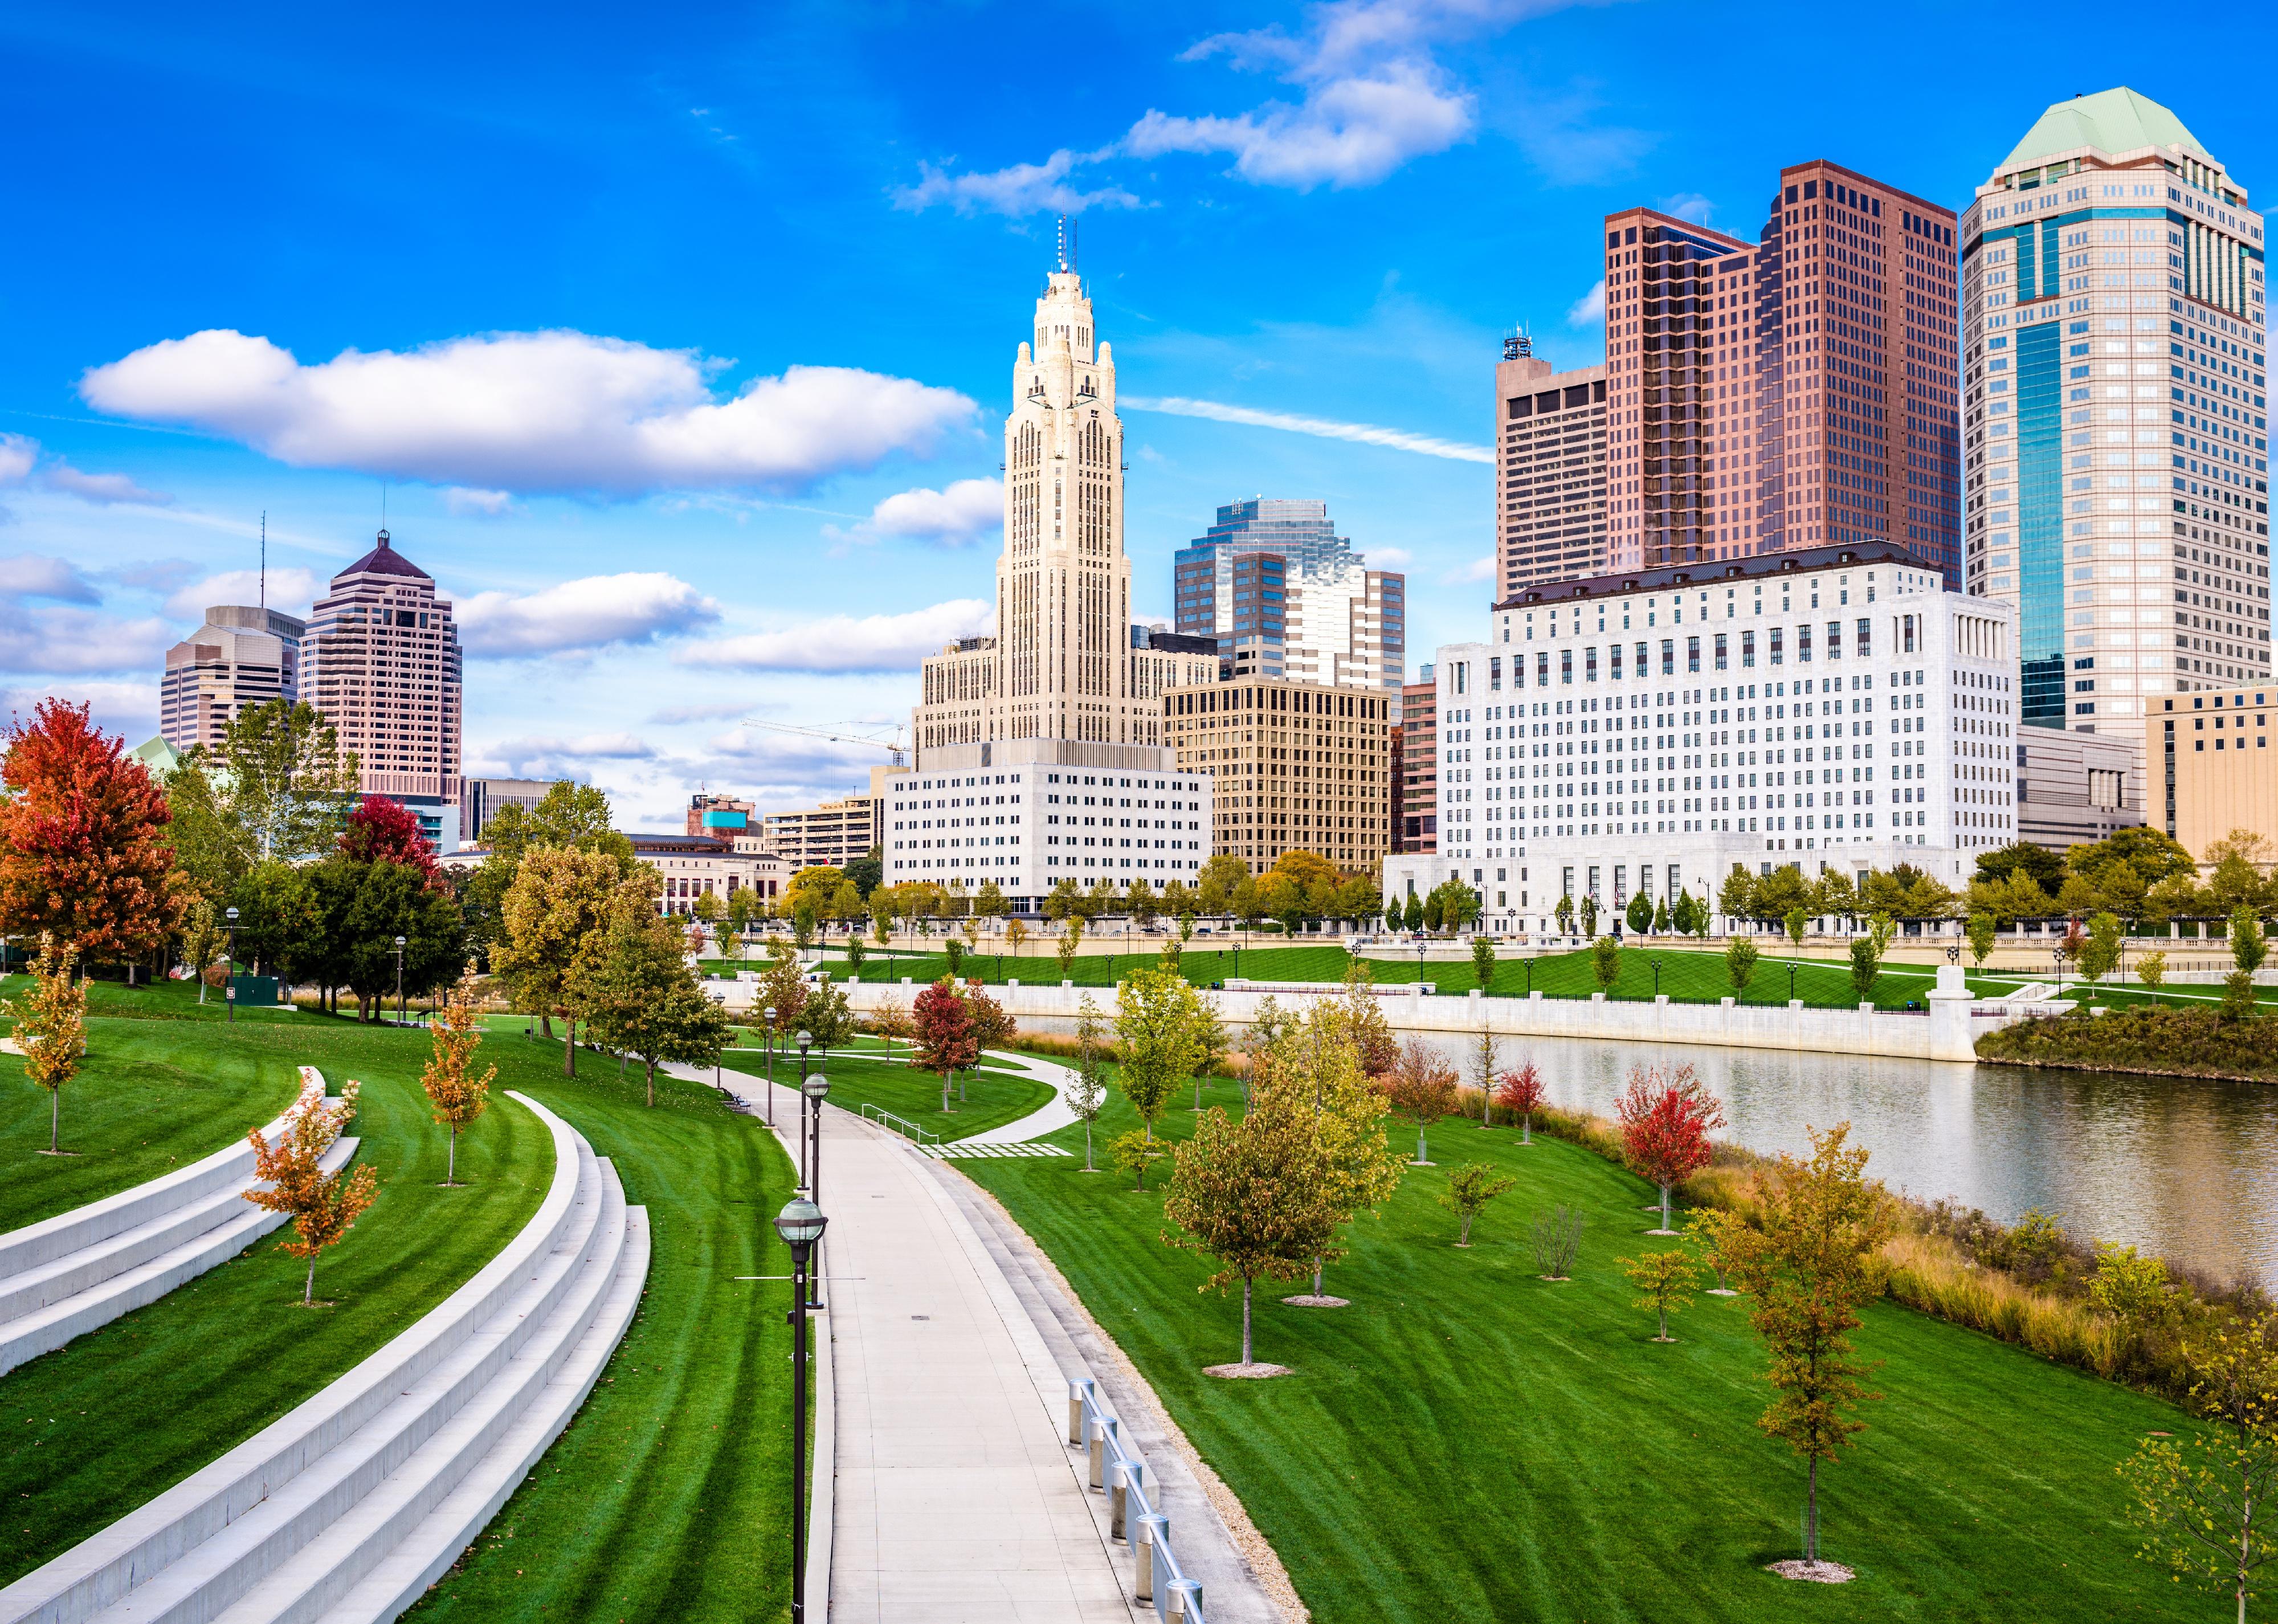
#39. Ohio
Columbus skyline on the Scioto River.
– Median household income: $62,262 (10.7% less than U.S. median income)
– Households earning less than $10,000: 317,928 (6.60%)
– Households earning over $200,000: 312,314 (6.50%)
– Median earnings for workers: $38,214 (men: $57,177; women: $46,068)
– Unemployment rate: 5.40%
– Families with income below poverty level: 9.40%
– Households with health insurance: 93.50%

Sean Pavone // Getty Images
#38. Indiana
Indiana State Capitol Building in Indianapolis.
– Median household income: $62,743 (10.0% less than U.S. median income)
– Households earning less than $10,000: 151,979 (5.70%)
– Households earning over $200,000: 152,761 (5.70%)
– Median earnings for workers: $37,998 (men: $55,191; women: $43,215)
– Unemployment rate: 4.70%
– Families with income below poverty level: 8.30%
– Households with health insurance: 92.50%
Noah Densmore // Getty Images
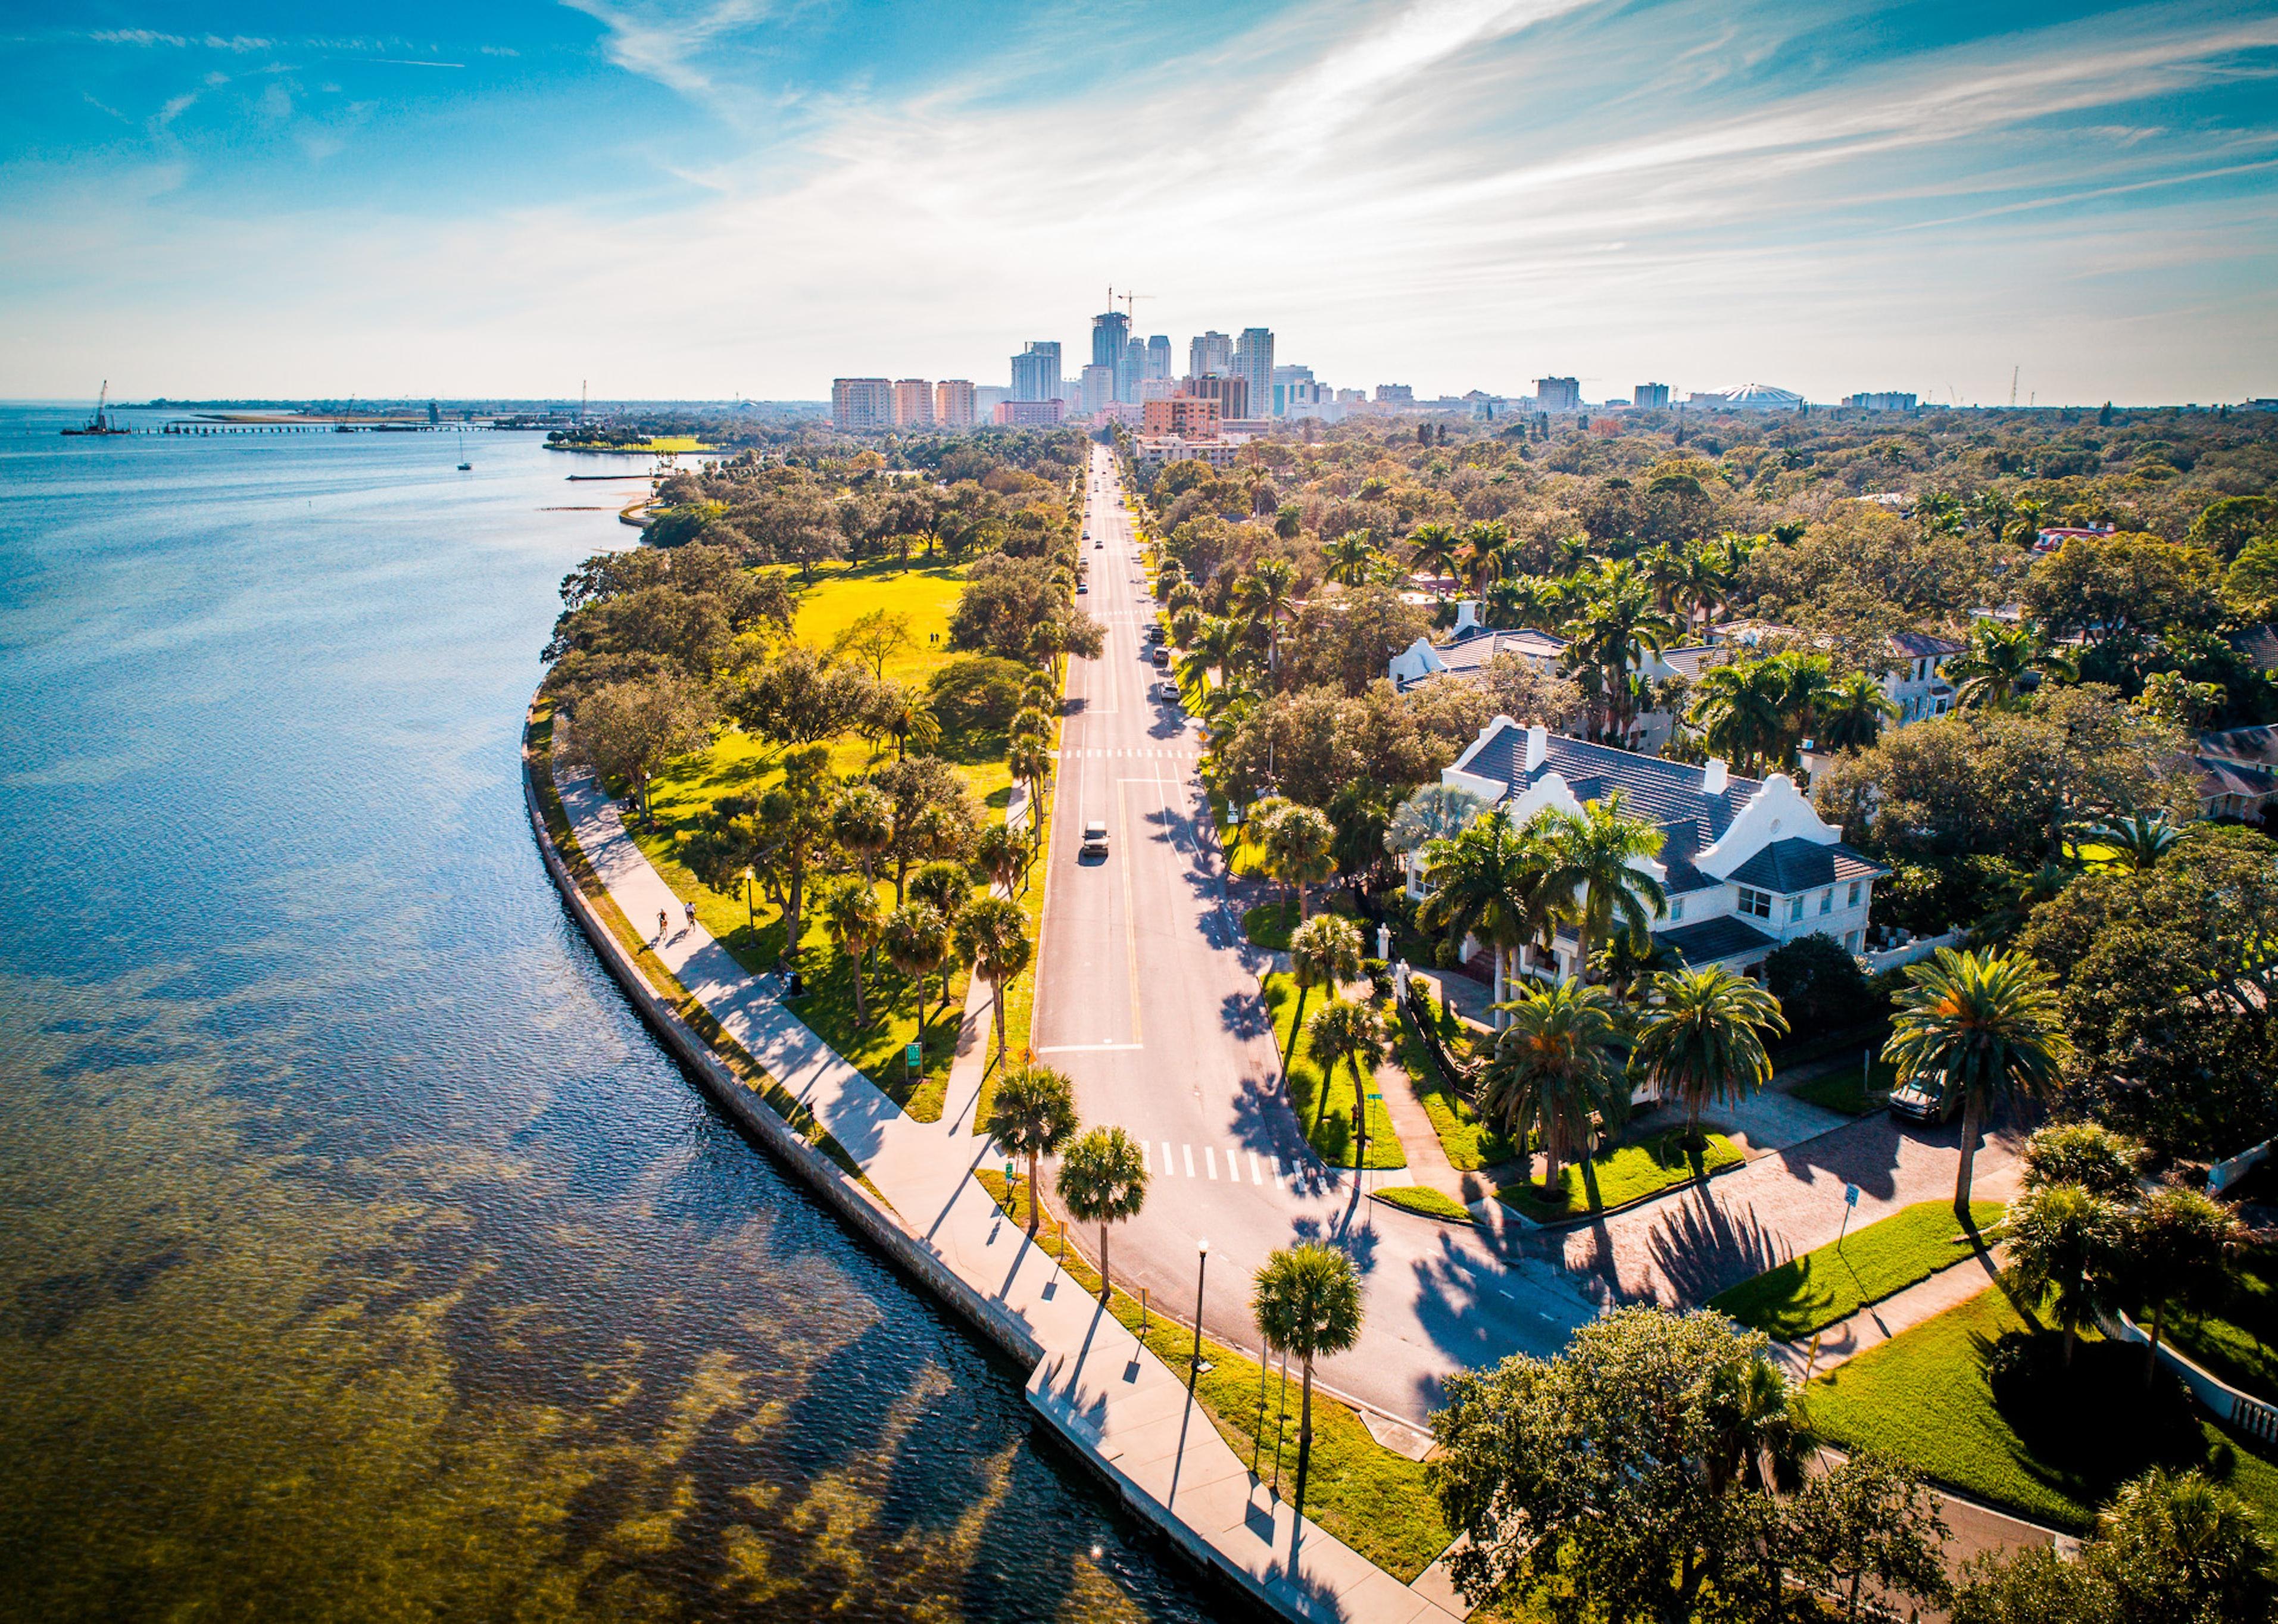
#37. Florida
The scenic road to downtown Saint Petersburg.
– Median household income: $63,062 (9.5% less than U.S. median income)
– Households earning less than $10,000: 542,819 (6.30%)
– Households earning over $200,000: 663,997 (7.80%)
– Median earnings for workers: $35,997 (men: $51,151; women: $42,228)
– Unemployment rate: 5.60%
– Families with income below poverty level: 9.40%
– Households with health insurance: 87.90%
You may also like: The industries where workers are quitting their jobs in droves
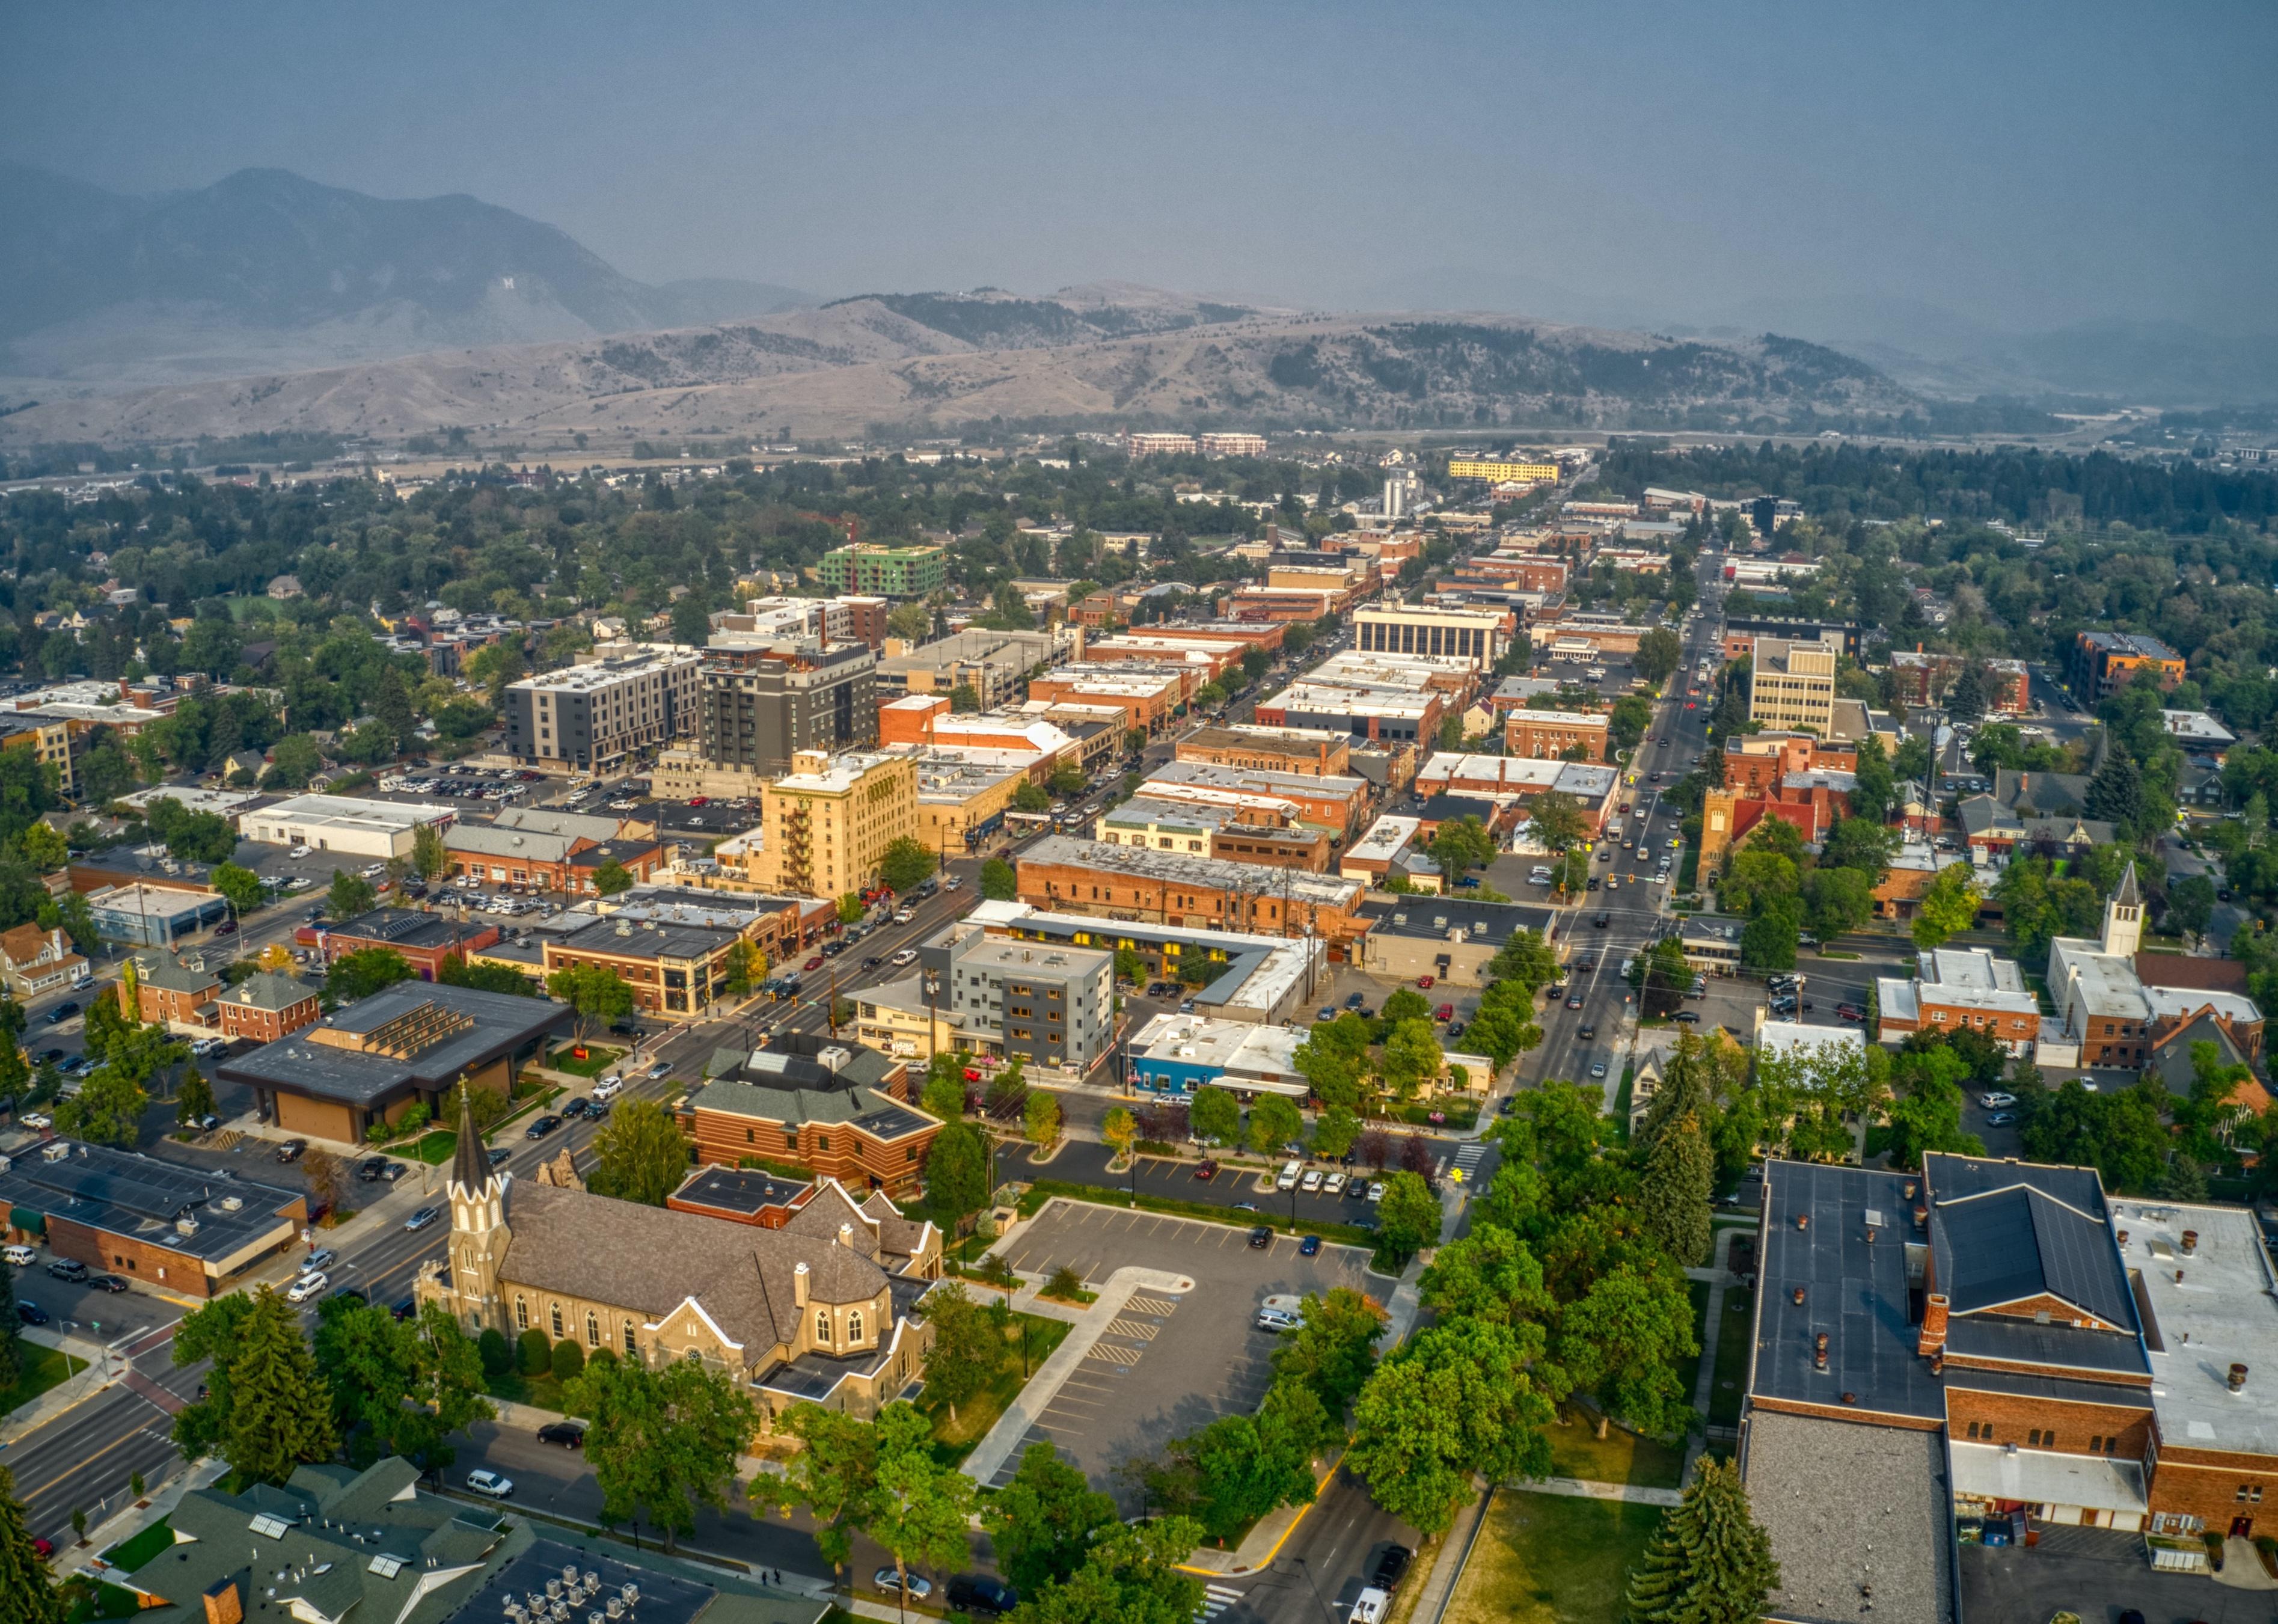
Jacob Boomsma // Getty Images
#36. Montana
Aerial view of downtown Bozeman in summer.
– Median household income: $63,249 (9.3% less than U.S. median income)
– Households earning less than $10,000: 23,195 (5.20%)
– Households earning over $200,000: 30,784 (6.90%)
– Median earnings for workers: $35,272 (men: $55,496; women: $41,725)
– Unemployment rate: 4.00%
– Families with income below poverty level: 7.20%
– Households with health insurance: 91.80%

Hanson L // Getty Images
#35. Michigan
Michigan Theater in Ann Arbor.
– Median household income: $63,498 (8.9% less than U.S. median income)
– Households earning less than $10,000: 256,830 (6.30%)
– Households earning over $200,000: 273,320 (6.70%)
– Median earnings for workers: $37,258 (men: $60,293; women: $46,914)
– Unemployment rate: 6.90%
– Families with income below poverty level: 9.00%
– Households with health insurance: 95.00%
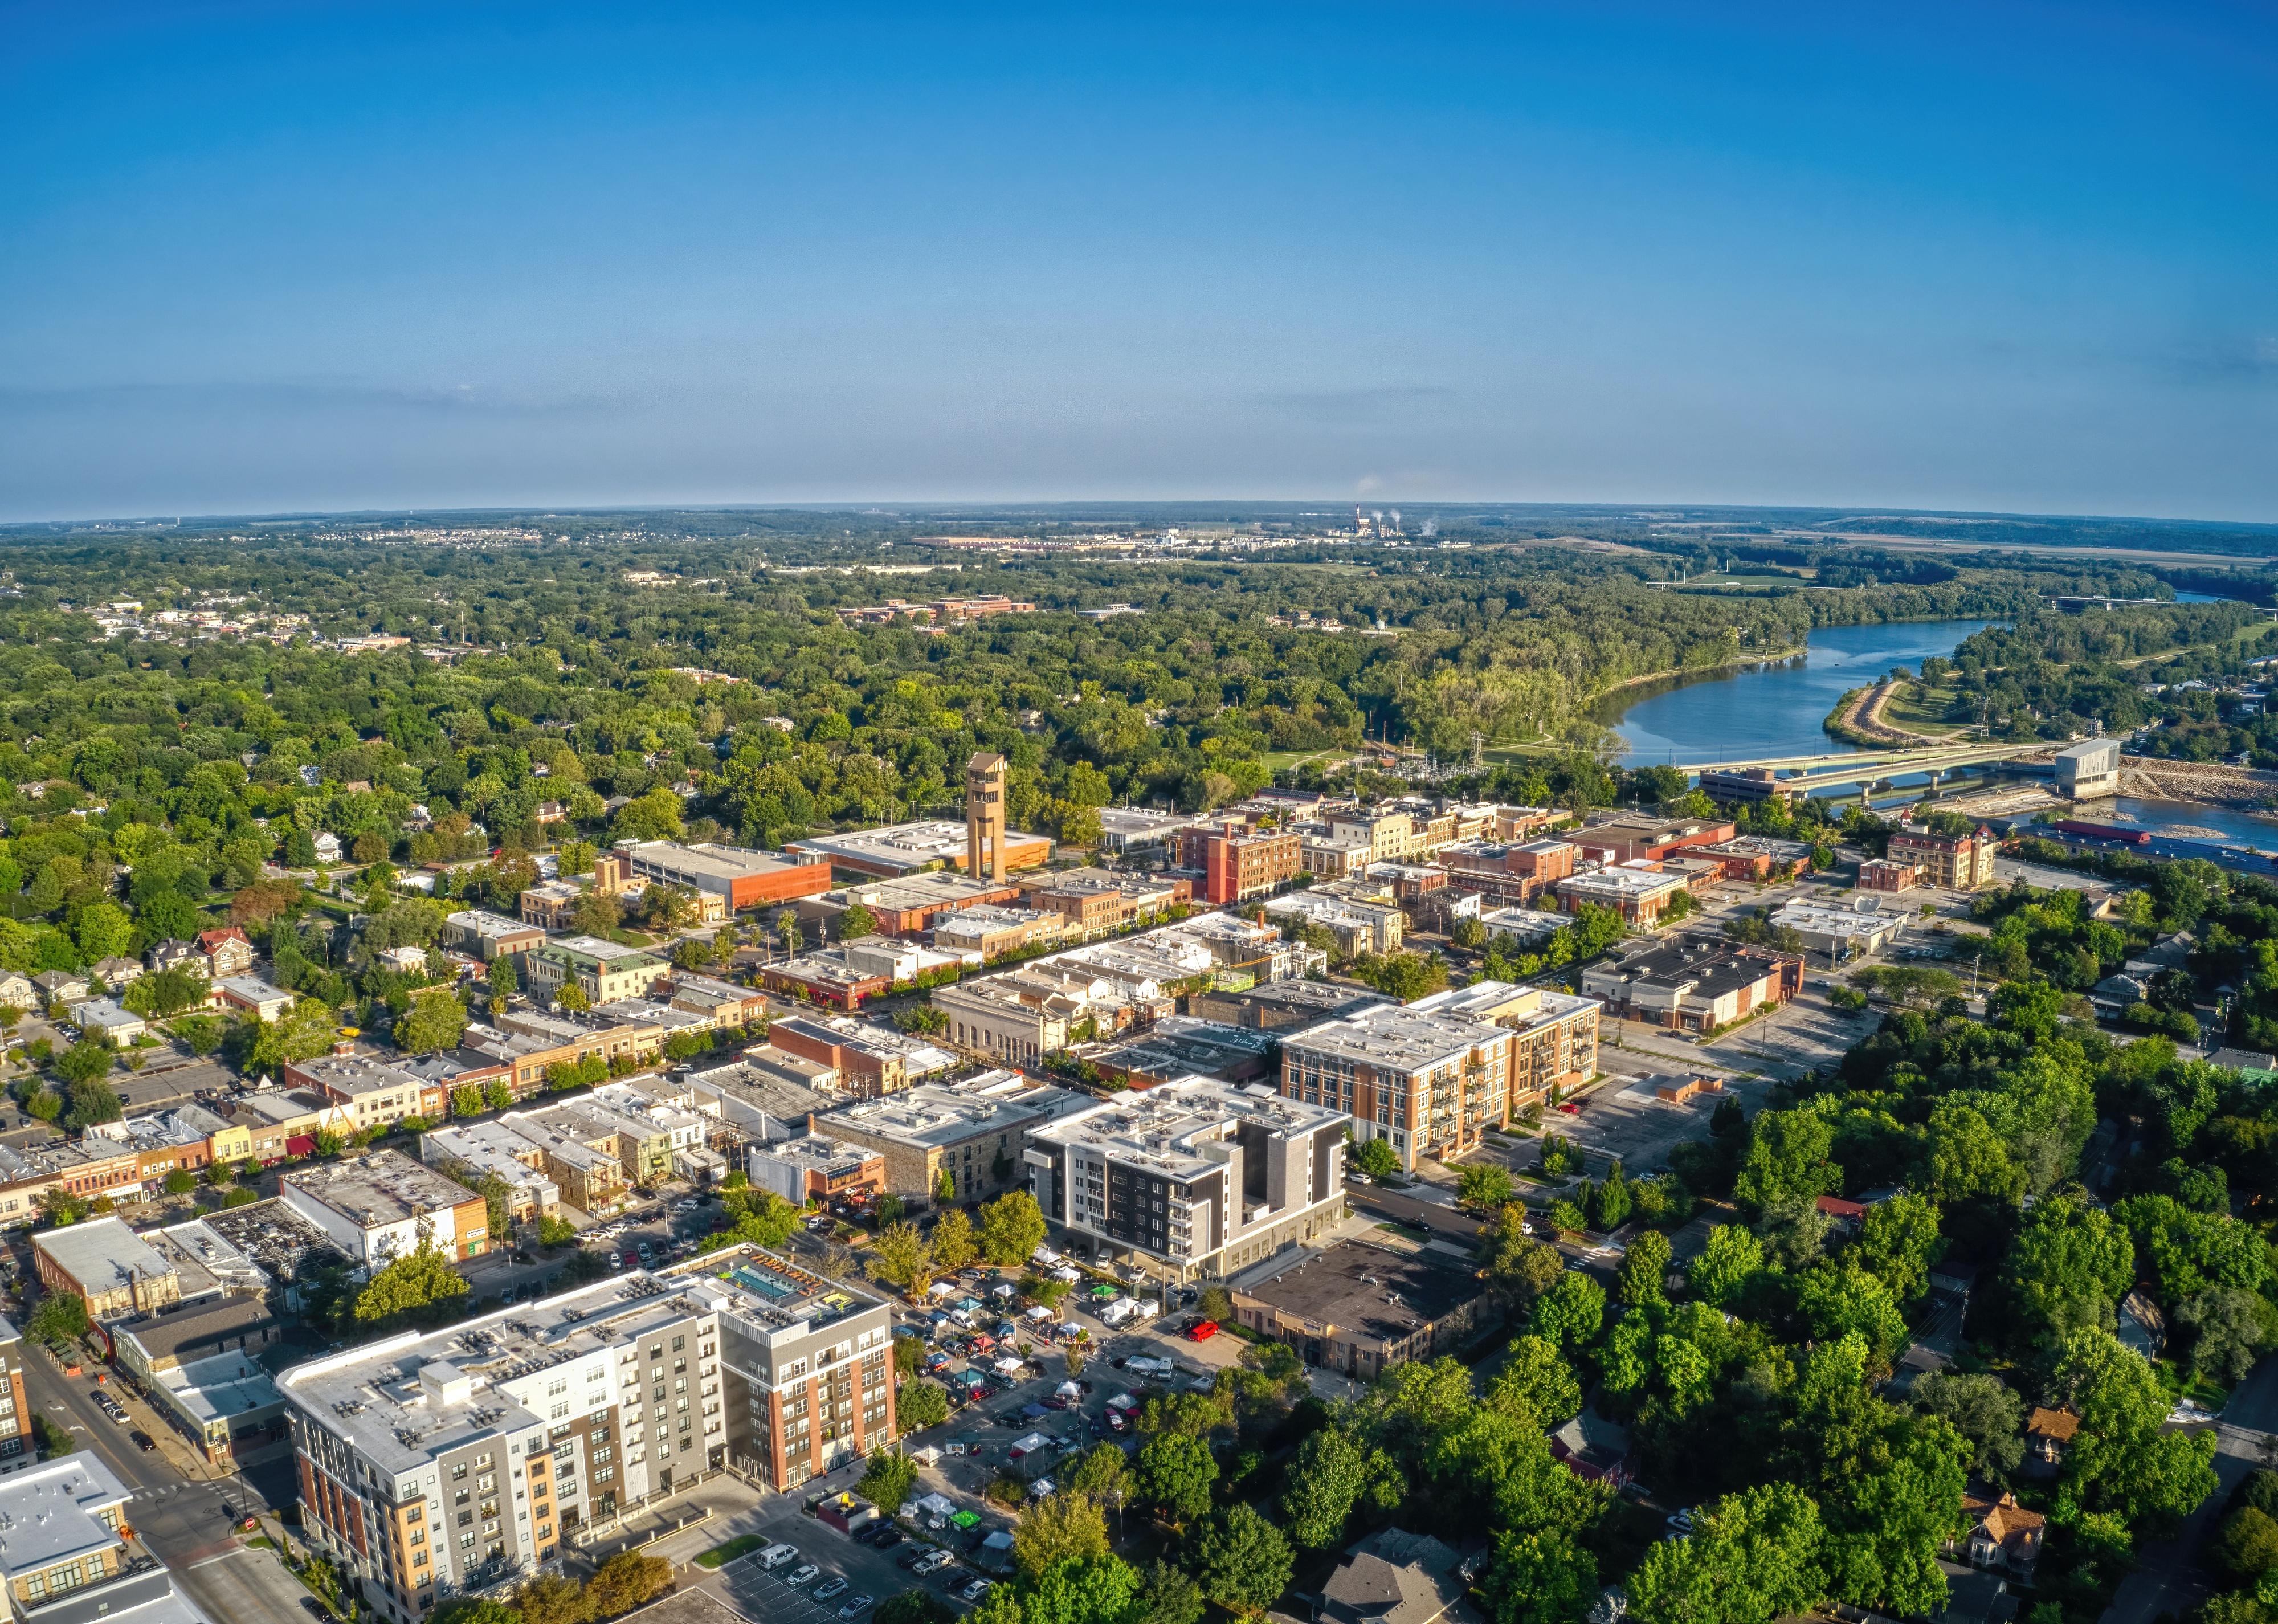
Jacob Boomsma // Getty Images
#34. Kansas
Aerial view of Lawrence and Kansas State University.
– Median household income: $64,124 (8.0% less than U.S. median income)
– Households earning less than $10,000: 65,819 (5.70%)
– Households earning over $200,000: 74,933 (6.50%)
– Median earnings for workers: $38,071 (men: $54,902; women: $44,368)
– Unemployment rate: 4.40%
– Families with income below poverty level: 8.00%
– Households with health insurance: 90.80%

Sean Pavone // Getty Images
#33. Maine
Portland Head Light, a lighthouse.
– Median household income: $64,767 (7.1% less than U.S. median income)
– Households earning less than $10,000: 32,174 (5.40%)
– Households earning over $200,000: 39,832 (6.70%)
– Median earnings for workers: $39,725 (men: $57,009; women: $47,018)
– Unemployment rate: 4.90%
– Families with income below poverty level: 7.20%
– Households with health insurance: 94.30%

haveseen // Getty Images
#32. Wyoming
Road from Yellowstone National Park to Grand Teton National Park.
– Median household income: $65,204 (6.5% less than U.S. median income)
– Households earning less than $10,000: 14,659 (6.00%)
– Households earning over $200,000: 14,179 (5.80%)
– Median earnings for workers: $35,613 (men: $59,853; women: $40,976)
– Unemployment rate: 3.70%
– Families with income below poverty level: 7.80%
– Households with health insurance: 87.80%
You may also like: Richest women in America
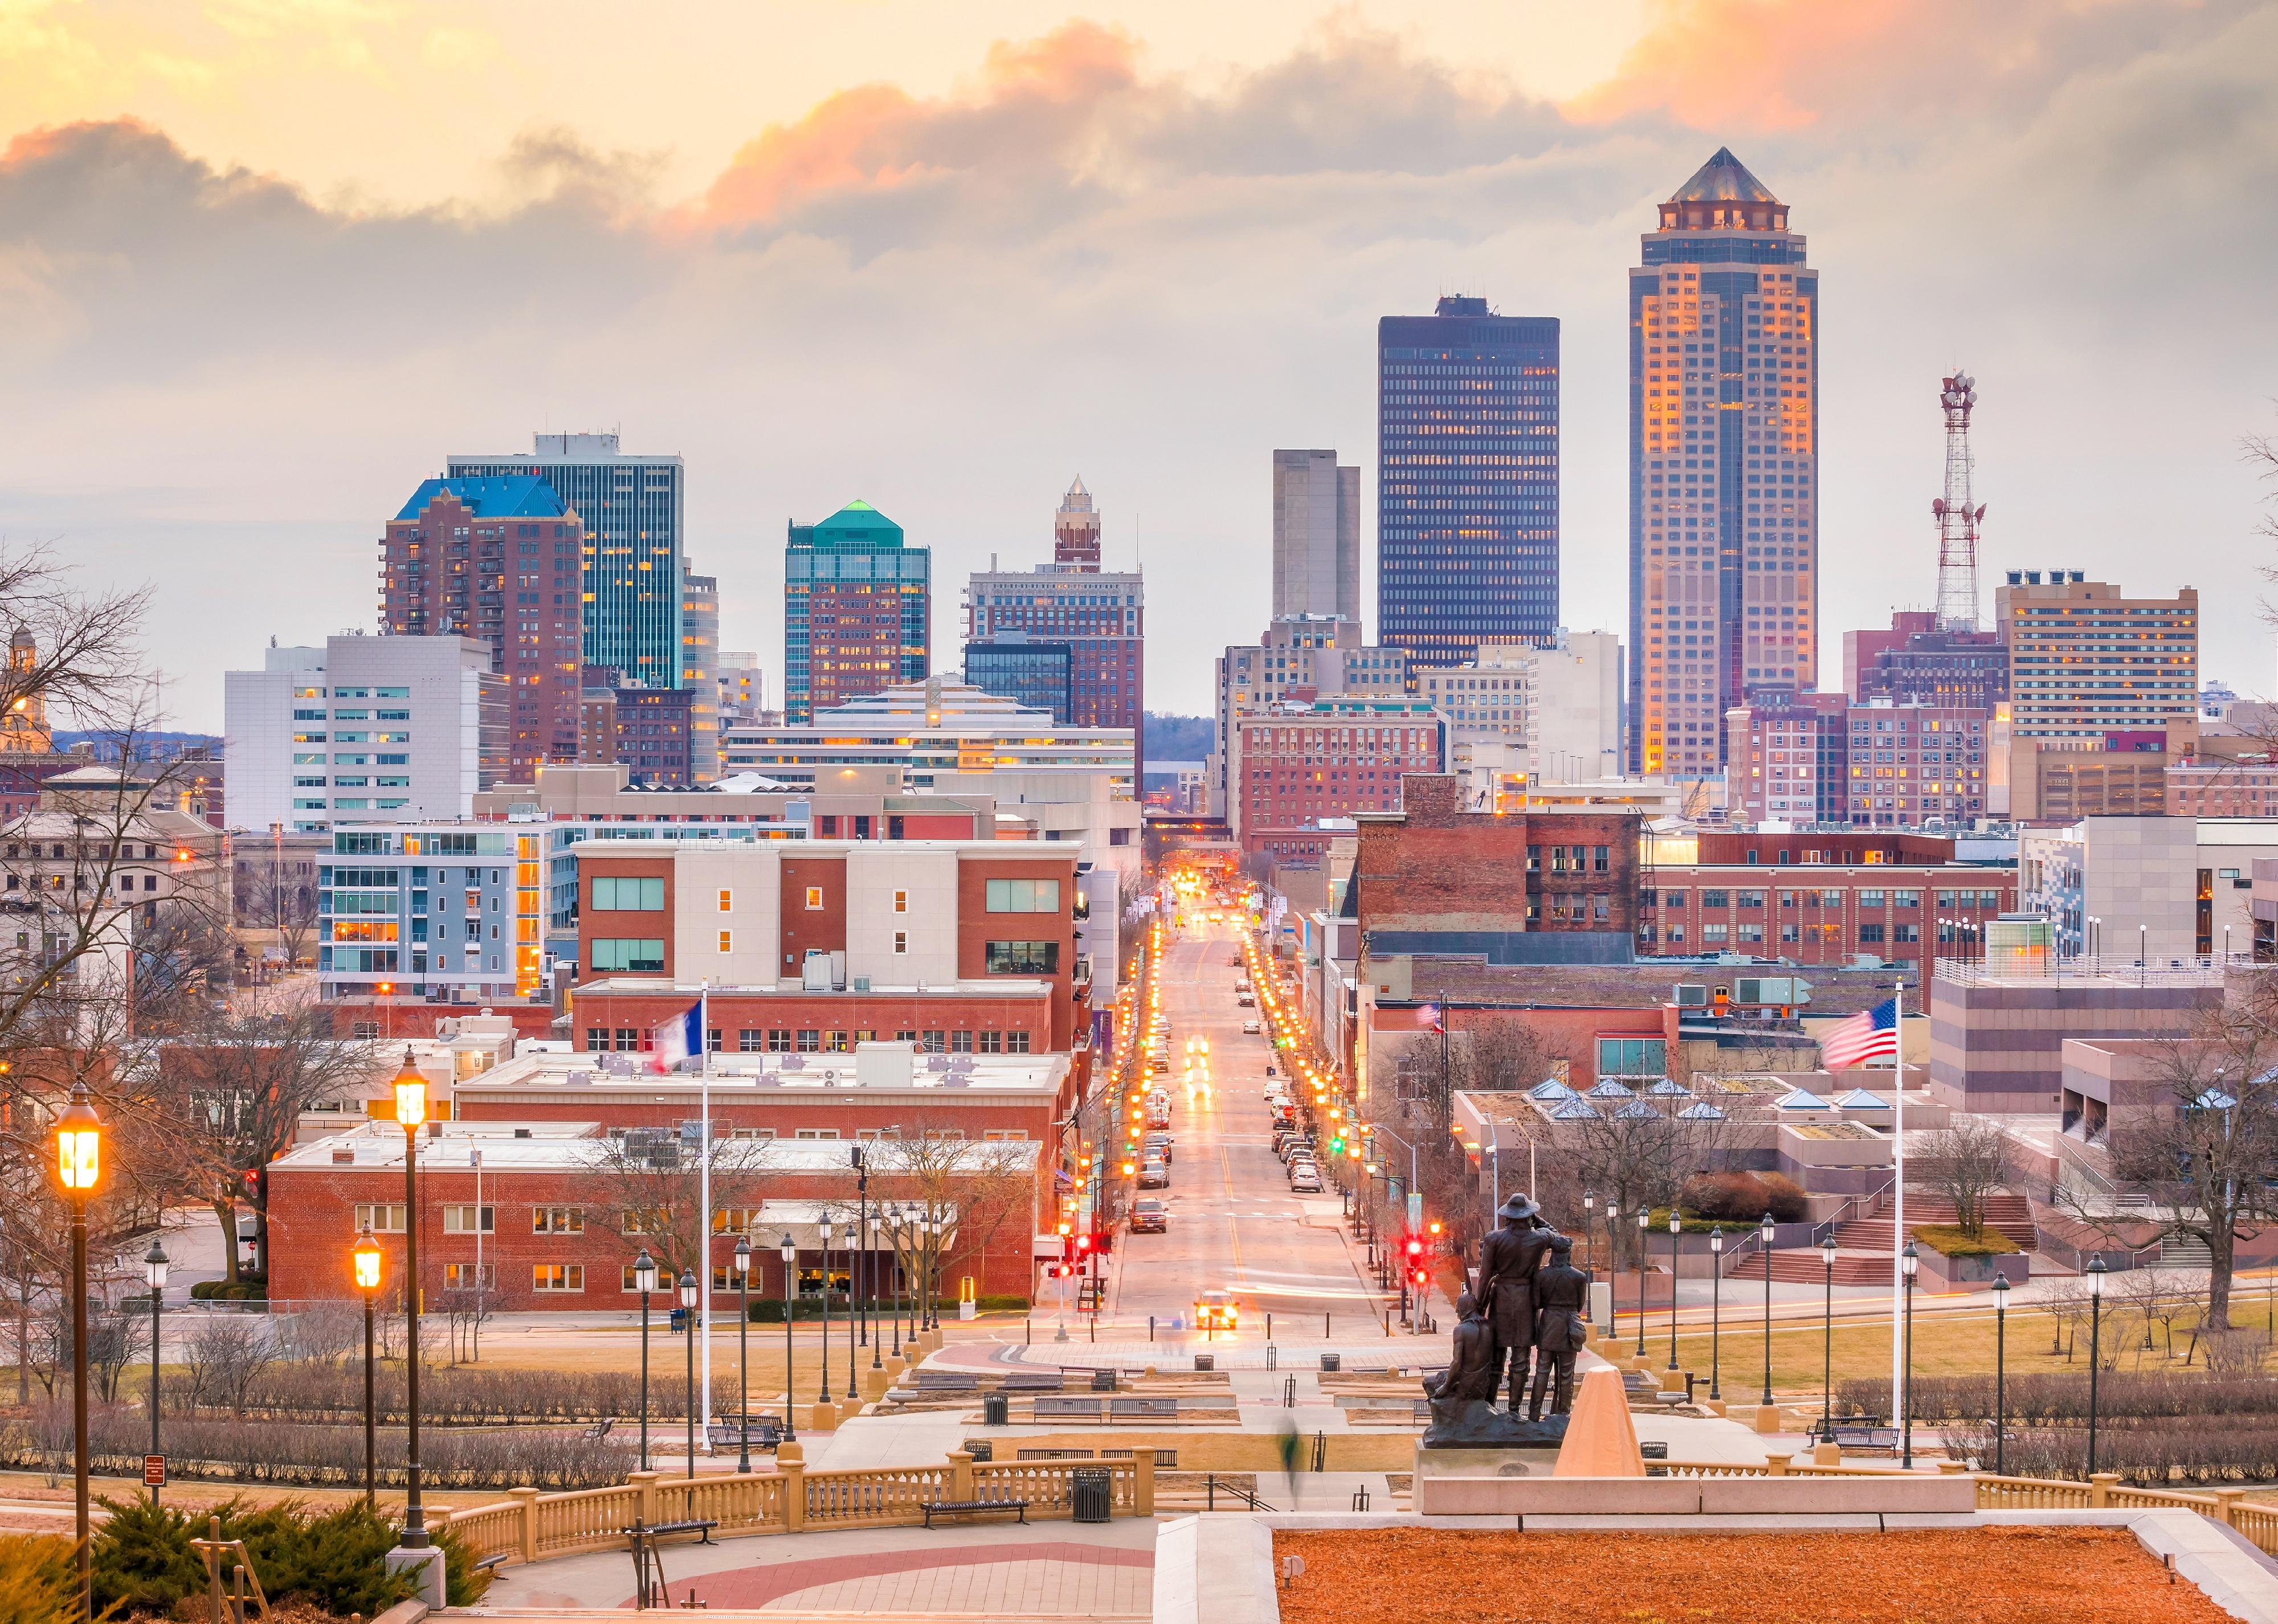
f11photo // Getty Images
#31. Iowa
Des Moines skyline.
– Median household income: $65,600 (5.9% less than U.S. median income)
– Households earning less than $10,000: 64,244 (4.90%)
– Households earning over $200,000: 81,020 (6.20%)
– Median earnings for workers: $39,068 (men: $56,427; women: $44,801)
– Unemployment rate: 3.60%
– Families with income below poverty level: 6.90%
– Households with health insurance: 95.20%

Mendenhall Olga // Getty Images
#30. South Dakota
Mount Rushmore with a blue sky in the background.
– Median household income: $66,143 (5.1% less than U.S. median income)
– Households earning less than $10,000: 17,158 (4.80%)
– Households earning over $200,000: 20,292 (5.70%)
– Median earnings for workers: $37,149 (men: $52,405; women: $41,792)
– Unemployment rate: 2.80%
– Families with income below poverty level: 7.90%
– Households with health insurance: 90.50%

Sean Pavone // Getty Images
#29. Nevada
Las Vegas skyline over the strip at dusk.
– Median household income: $66,274 (4.9% less than U.S. median income)
– Households earning less than $10,000: 85,960 (7.20%)
– Households earning over $200,000: 89,881 (7.50%)
– Median earnings for workers: $37,052 (men: $52,398; women: $44,906)
– Unemployment rate: 9.70%
– Families with income below poverty level: 10.60%
– Households with health insurance: 88.40%
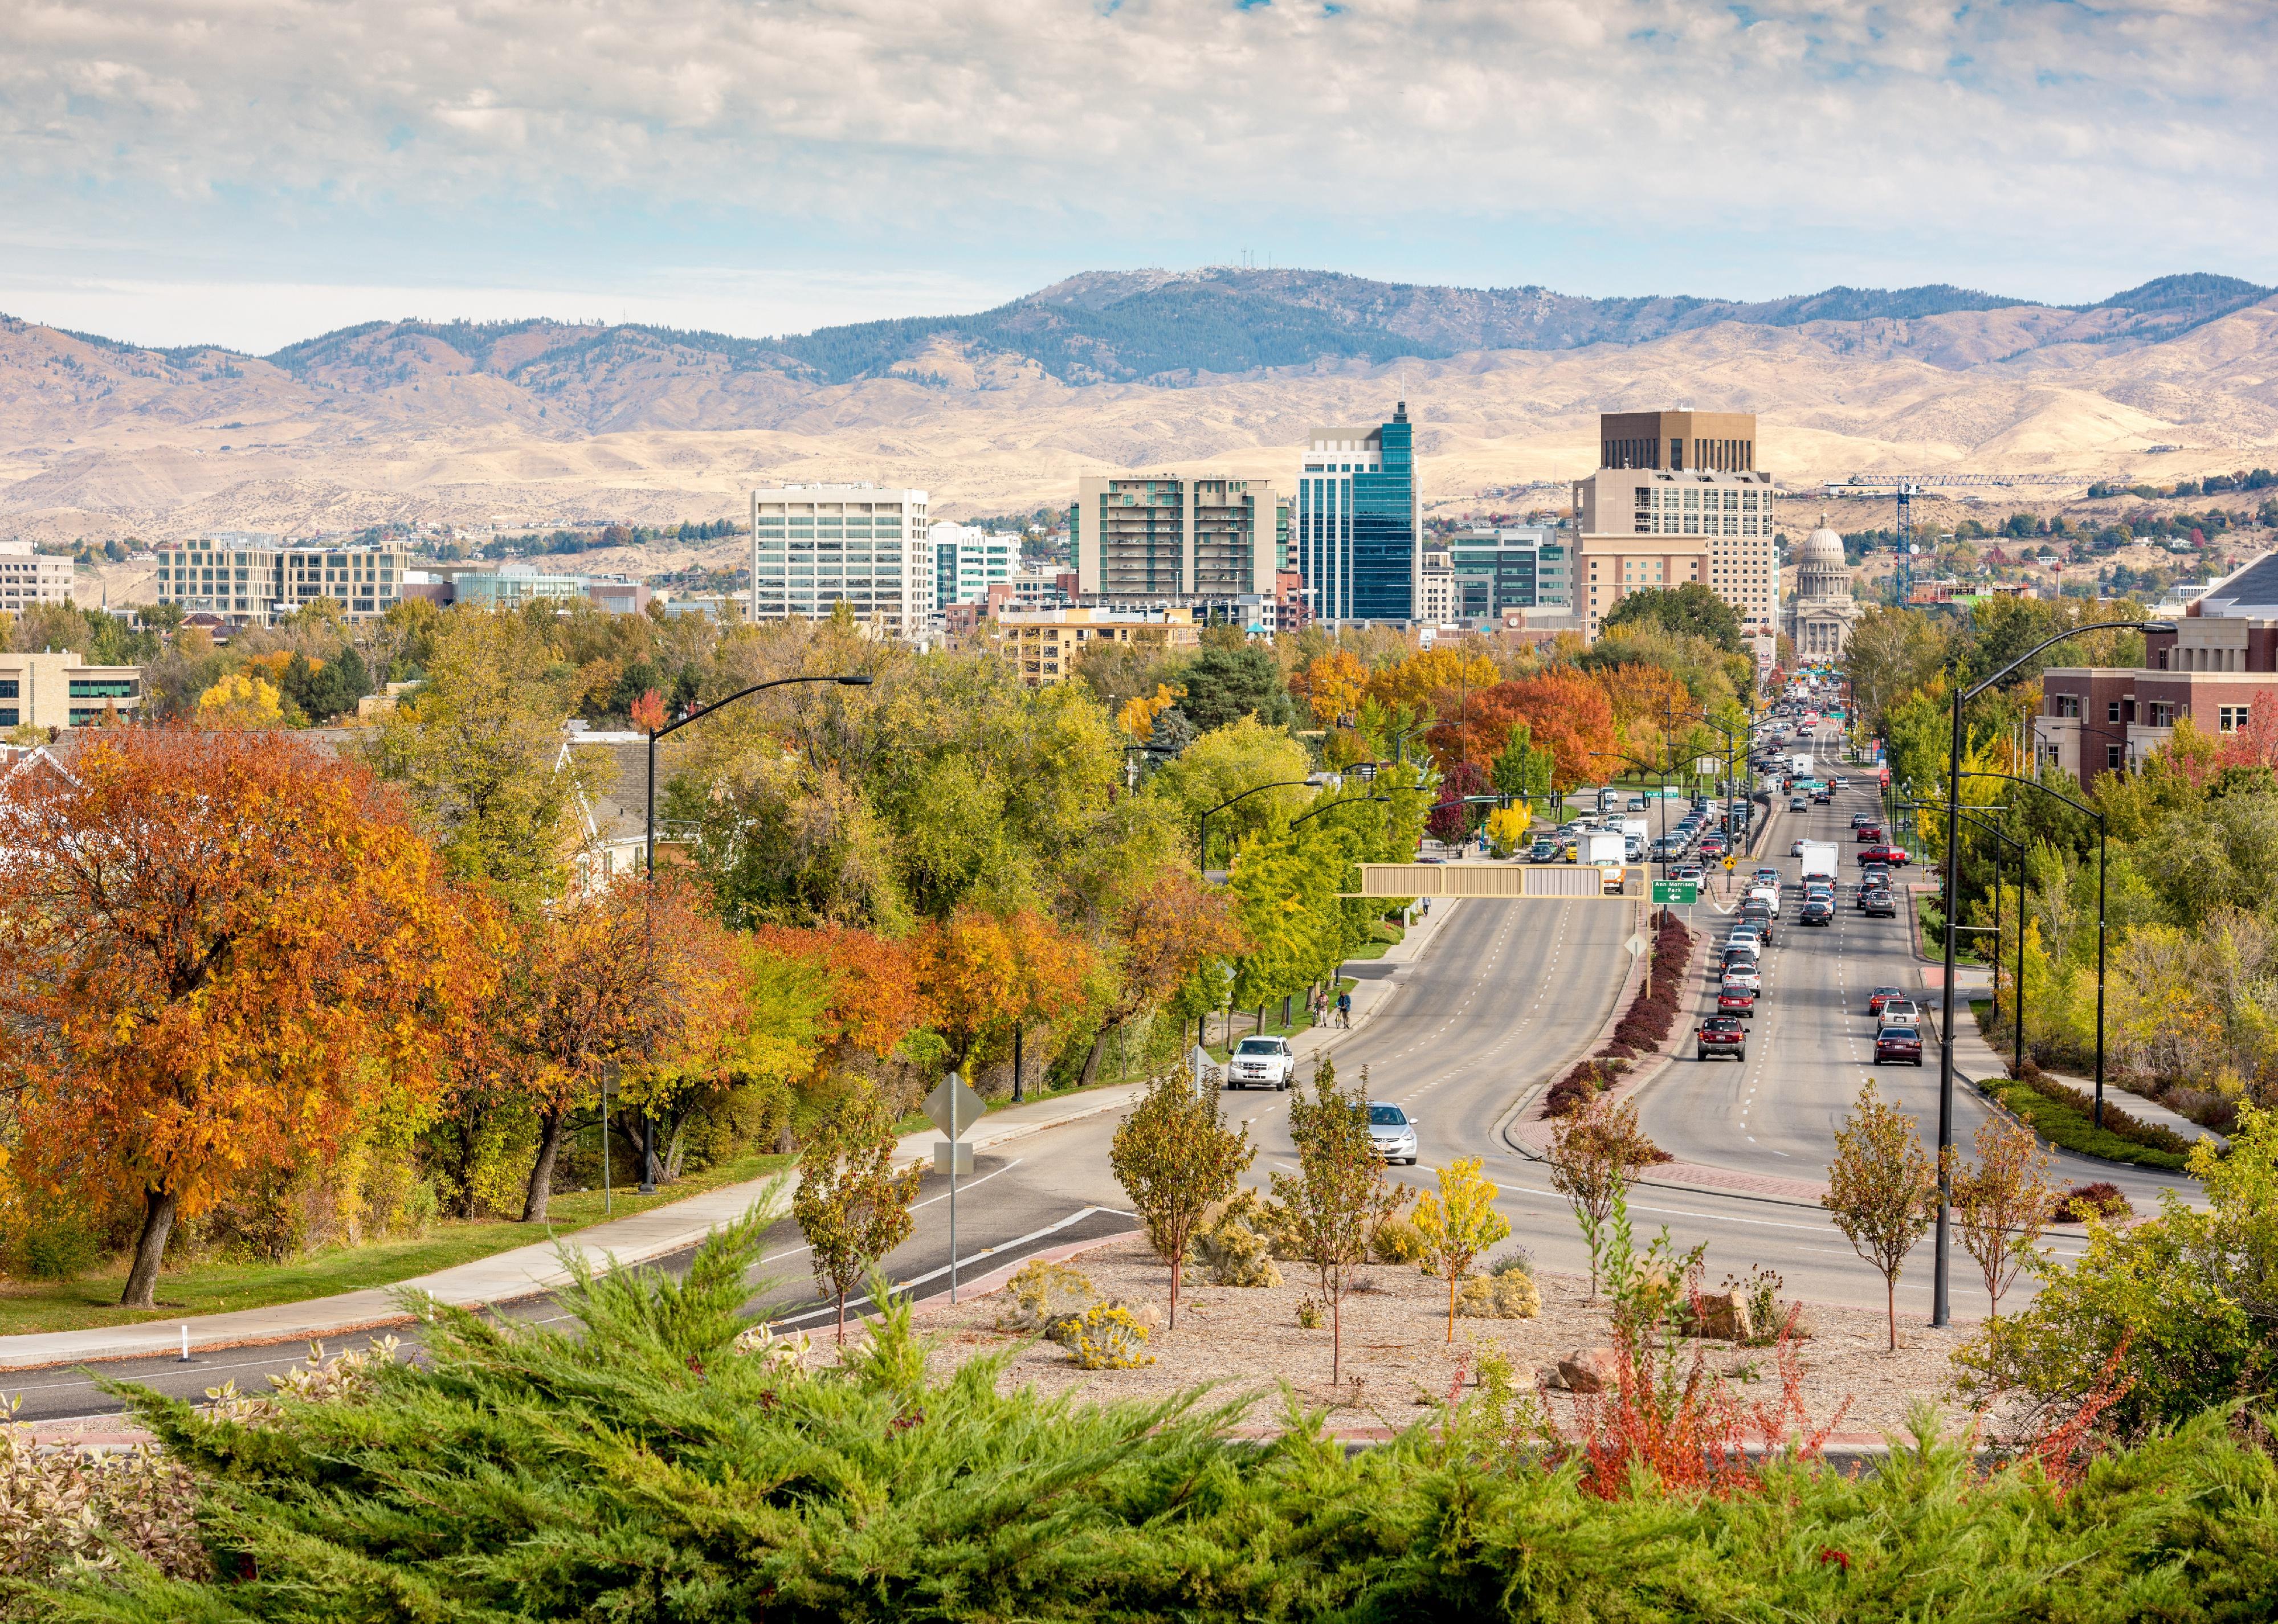
Charles Knowles // Getty Images
#28. Idaho
Aerial view of a Boise street leading to the capitol building in fall.
– Median household income: $66,474 (4.7% less than U.S. median income)
– Households earning less than $10,000: 30,955 (4.50%)
– Households earning over $200,000: 45,347 (6.50%)
– Median earnings for workers: $34,941 (men: $51,941; women: $40,803)
– Unemployment rate: 3.30%
– Families with income below poverty level: 7.70%
– Households with health insurance: 91.20%
Jacob Boomsma // Getty Images
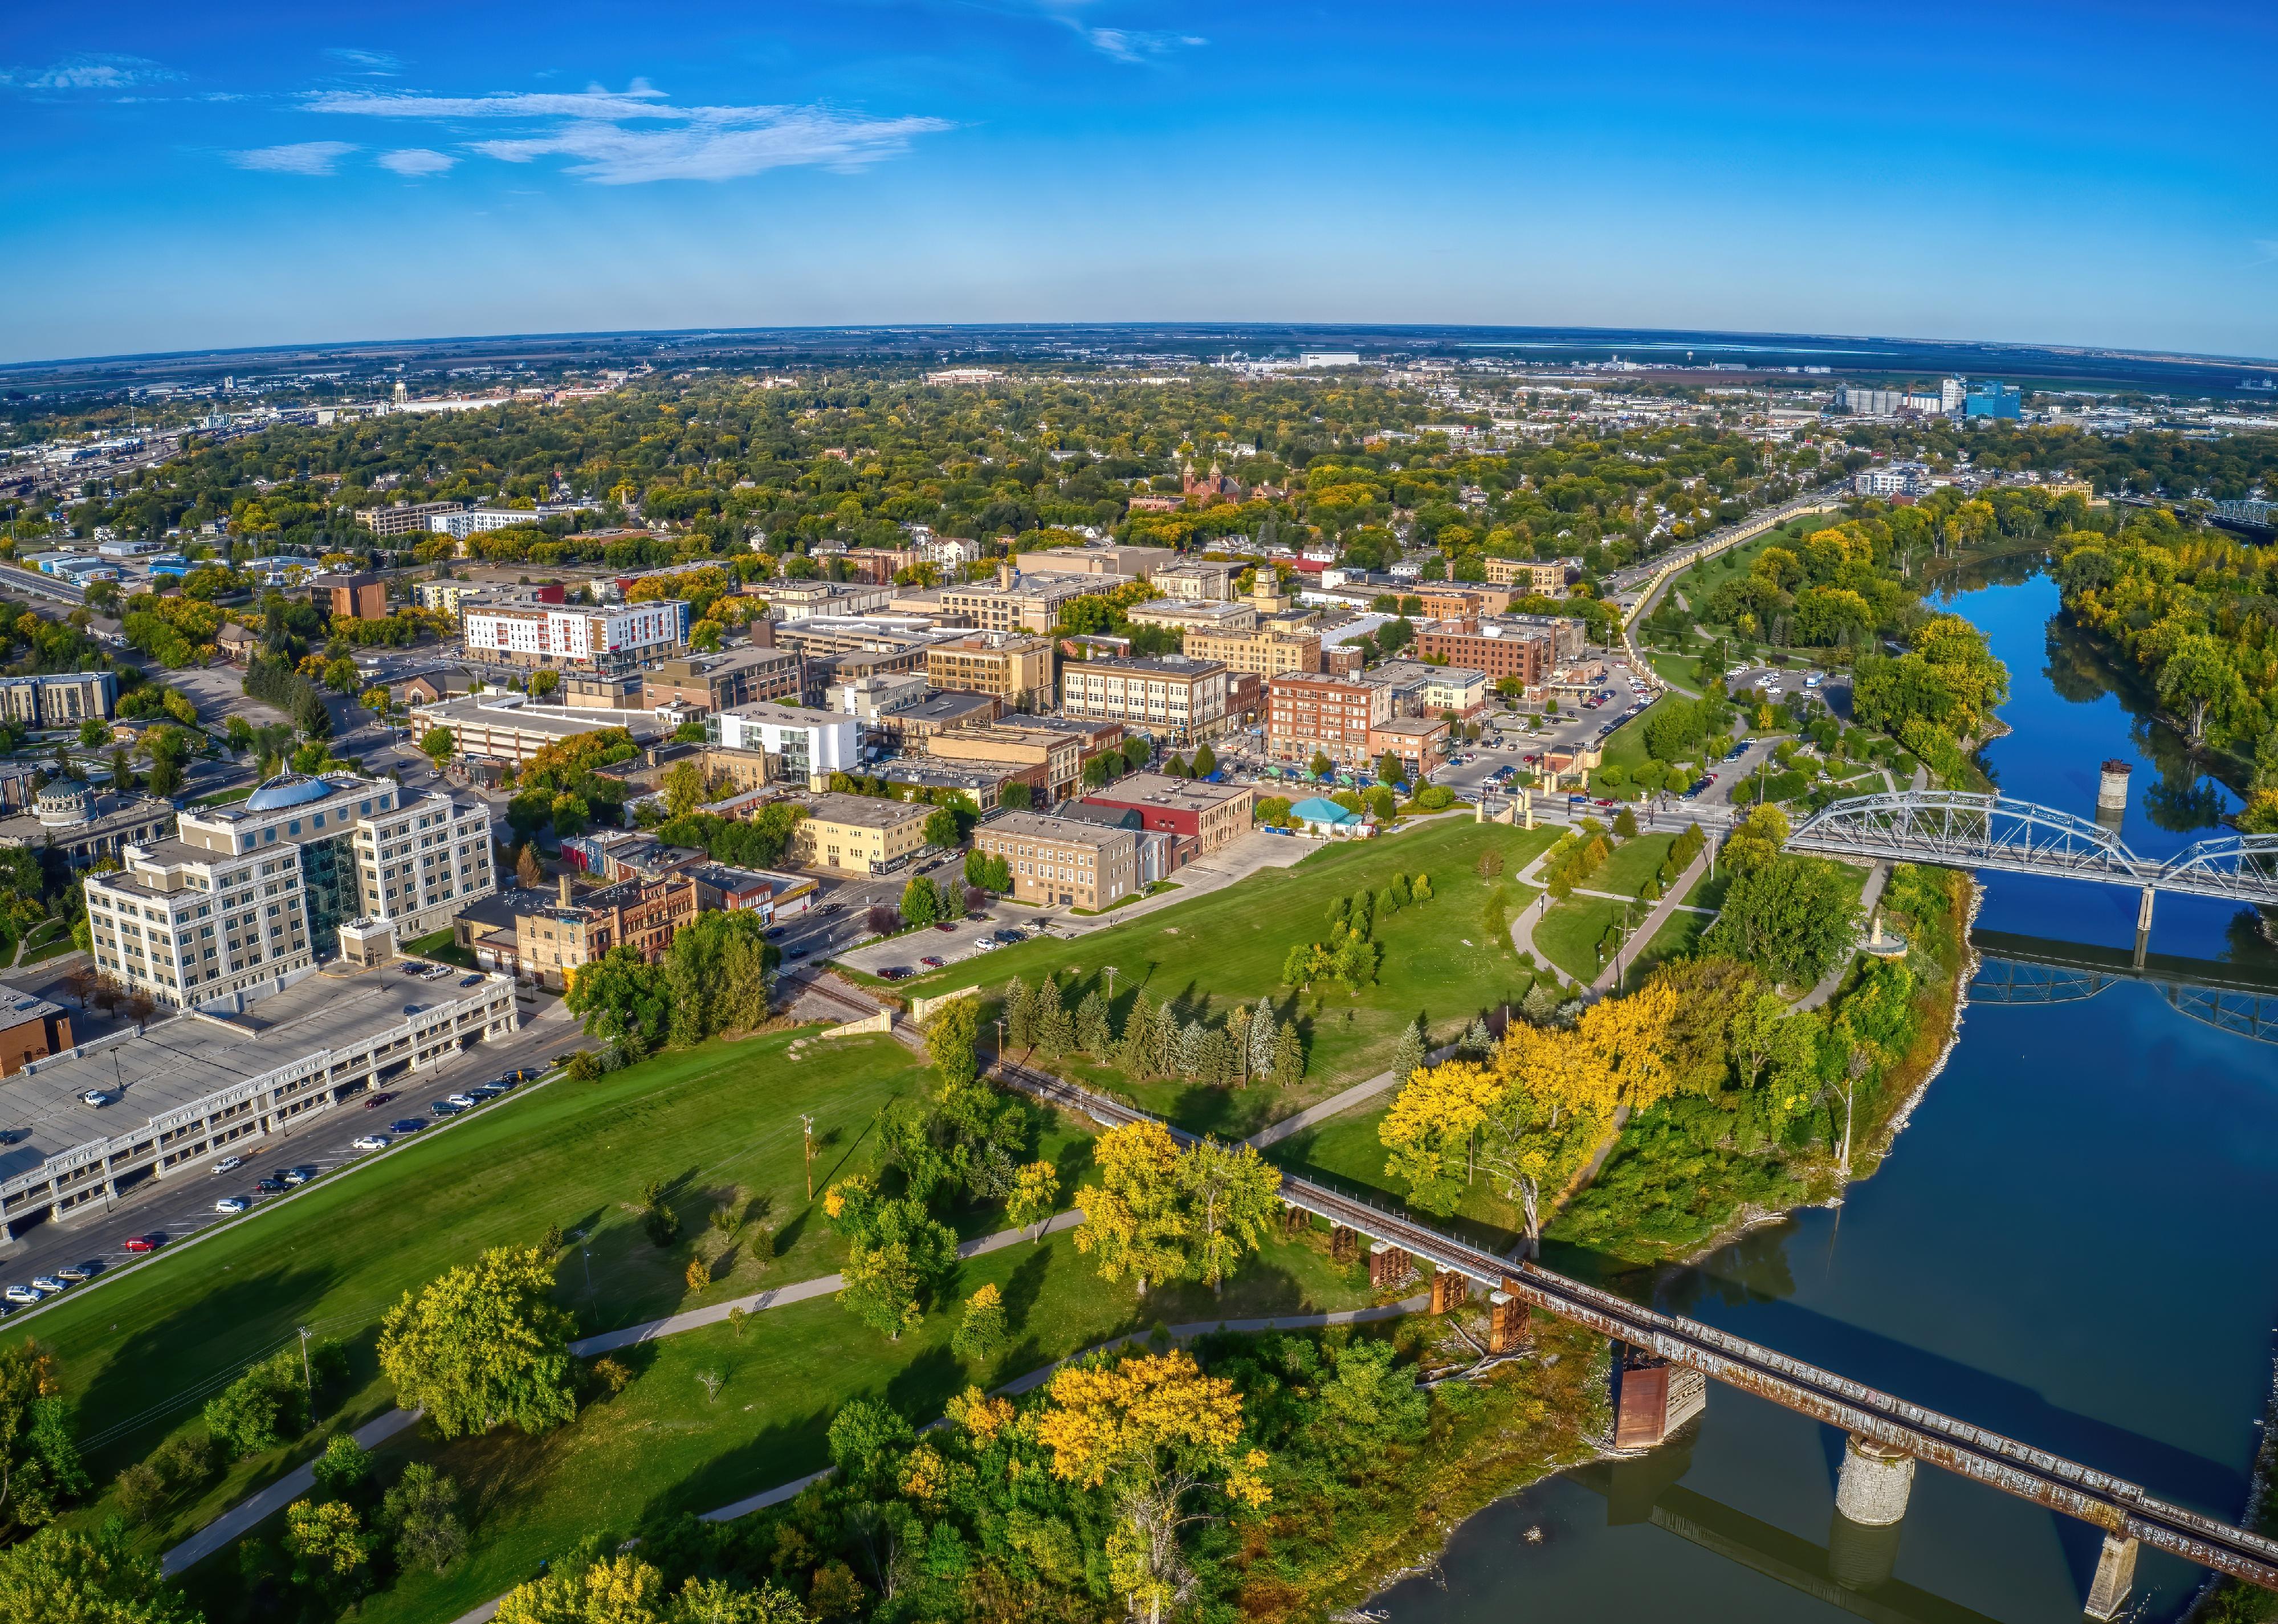
#27. North Dakota
Aerial View of Grand Forks in autumn.
– Median household income: $66,519 (4.6% less than U.S. median income)
– Households earning less than $10,000: 18,213 (5.60%)
– Households earning over $200,000: 19,407 (6.00%)
– Median earnings for workers: $39,438 (men: $57,121; women: $45,182)
– Unemployment rate: 2.90%
– Families with income below poverty level: 6.30%
– Households with health insurance: 92.10%
You may also like: Famous consumer brands that no longer exist

Sean Pavone // Getty Images
#26. Georgia
Downtown Atlanta skyline.
– Median household income: $66,559 (4.5% less than U.S. median income)
– Households earning less than $10,000: 251,693 (6.30%)
– Households earning over $200,000: 337,914 (8.40%)
– Median earnings for workers: $37,512 (men: $54,422; women: $45,405)
– Unemployment rate: 5.50%
– Families with income below poverty level: 10.60%
– Households with health insurance: 87.40%
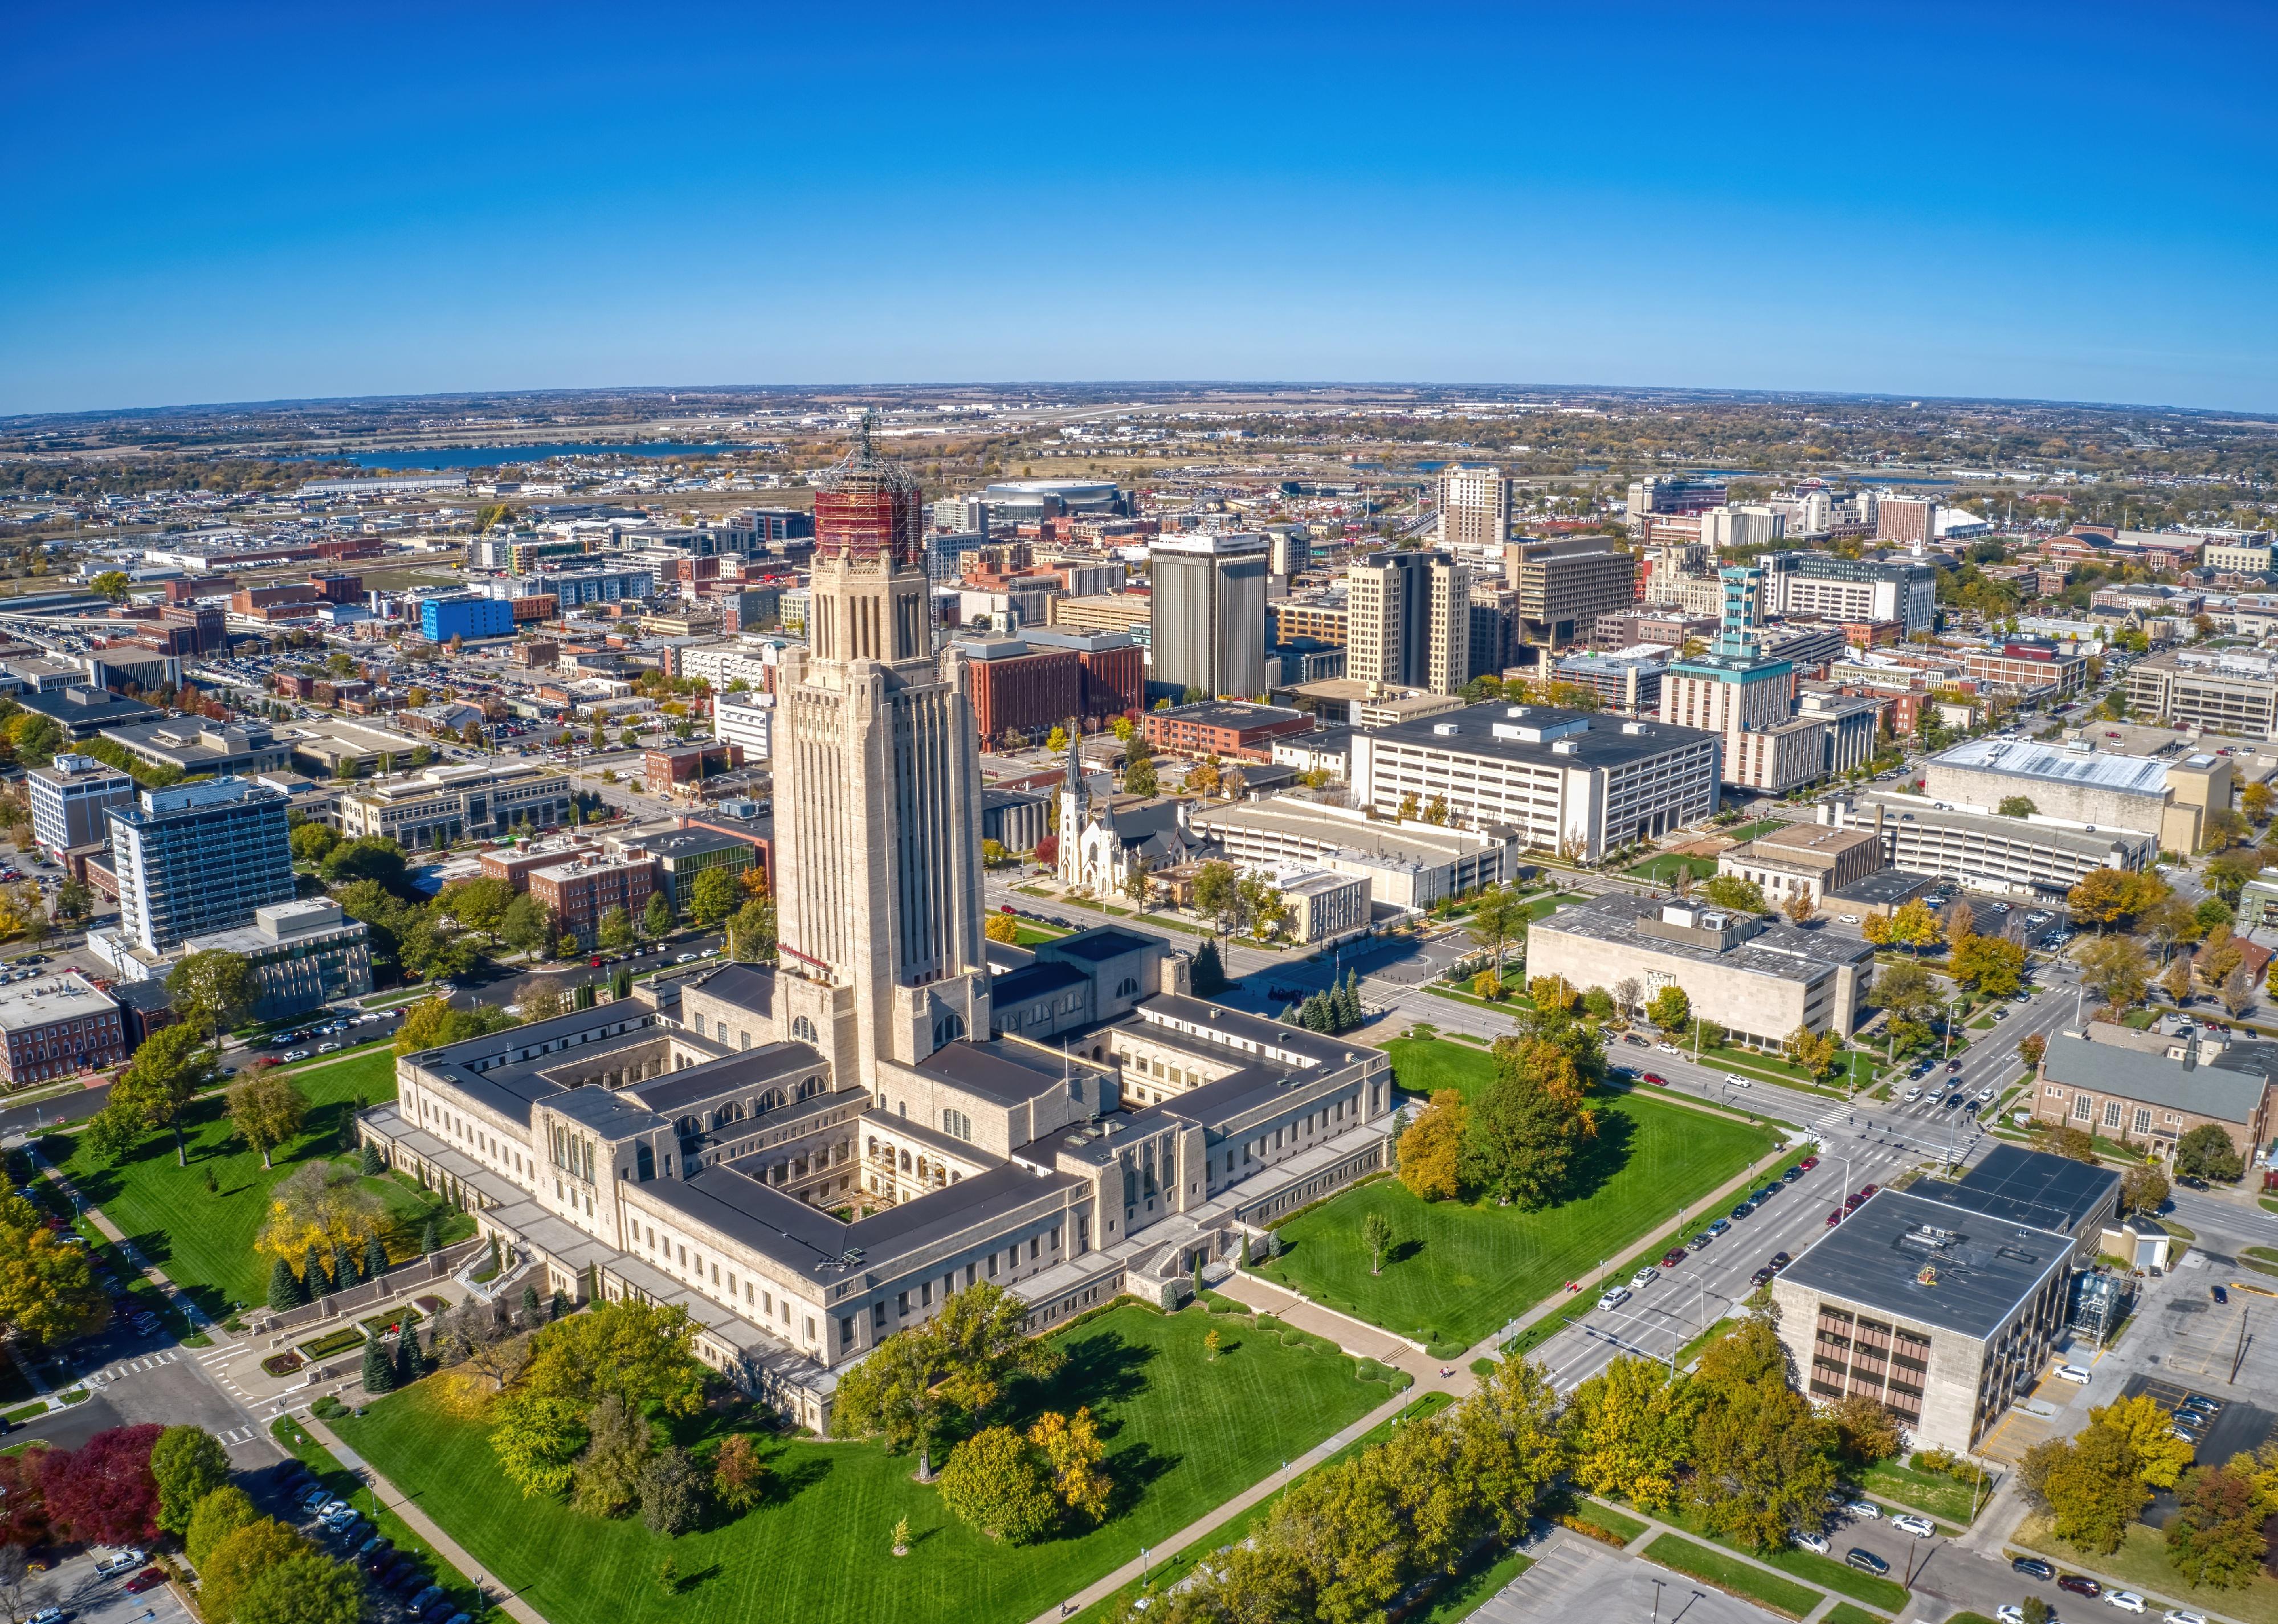
Jacob Boomsma // Getty Images
#25. Nebraska
Aerial view of Lincoln in autumn.
– Median household income: $66,817 (4.2% less than U.S. median income)
– Households earning less than $10,000: 40,806 (5.20%)
– Households earning over $200,000: 53,061 (6.80%)
– Median earnings for workers: $38,898 (men: $56,121; women: $44,037)
– Unemployment rate: 2.70%
– Families with income below poverty level: 6.70%
– Households with health insurance: 92.90%

Joe Belanger // Getty Images
#24. Texas
An abandoned old barn with the symbol of Texas painted on the roof.
– Median household income: $66,963 (4.0% less than U.S. median income)
– Households earning less than $10,000: 657,665 (6.10%)
– Households earning over $200,000: 955,952 (8.90%)
– Median earnings for workers: $38,059 (men: $56,100; women: $45,393)
– Unemployment rate: 6.20%
– Families with income below poverty level: 11.00%
– Households with health insurance: 82.00%

f11photo // Getty Images
#23. Wisconsin
Downtown skyline with buildings along the Milwaukee river.
– Median household income: $67,125 (3.7% less than U.S. median income)
– Households earning less than $10,000: 117,547 (4.80%)
– Households earning over $200,000: 160,477 (6.60%)
– Median earnings for workers: $40,678 (men: $57,925; women: $46,762)
– Unemployment rate: 3.50%
– Families with income below poverty level: 6.80%
– Households with health insurance: 94.60%

Sean Pavone // Getty Images
#22. Pennsylvania
Downtown Pittsburgh skyline.
– Median household income: $68,957 (1.1% less than U.S. median income)
– Households earning less than $10,000: 308,449 (5.90%)
– Households earning over $200,000: 454,003 (8.70%)
– Median earnings for workers: $40,983 (men: $62,096; women: $50,272)
– Unemployment rate: 6.40%
– Families with income below poverty level: 8.30%
– Households with health insurance: 94.50%
You may also like: Do you know the brands behind these famous slogans?

Sean Pavone // Getty Images
#21. Arizona
Downtown Tucson skyline including Sentinel Peak at dusk.
– Median household income: $69,056 (0.9% less than U.S. median income)
– Households earning less than $10,000: 158,400 (5.60%)
– Households earning over $200,000: 228,651 (8.10%)
– Median earnings for workers: $39,023 (men: $55,458; women: $46,309)
– Unemployment rate: 5.80%
– Families with income below poverty level: 9.10%
– Households with health insurance: 89.30%
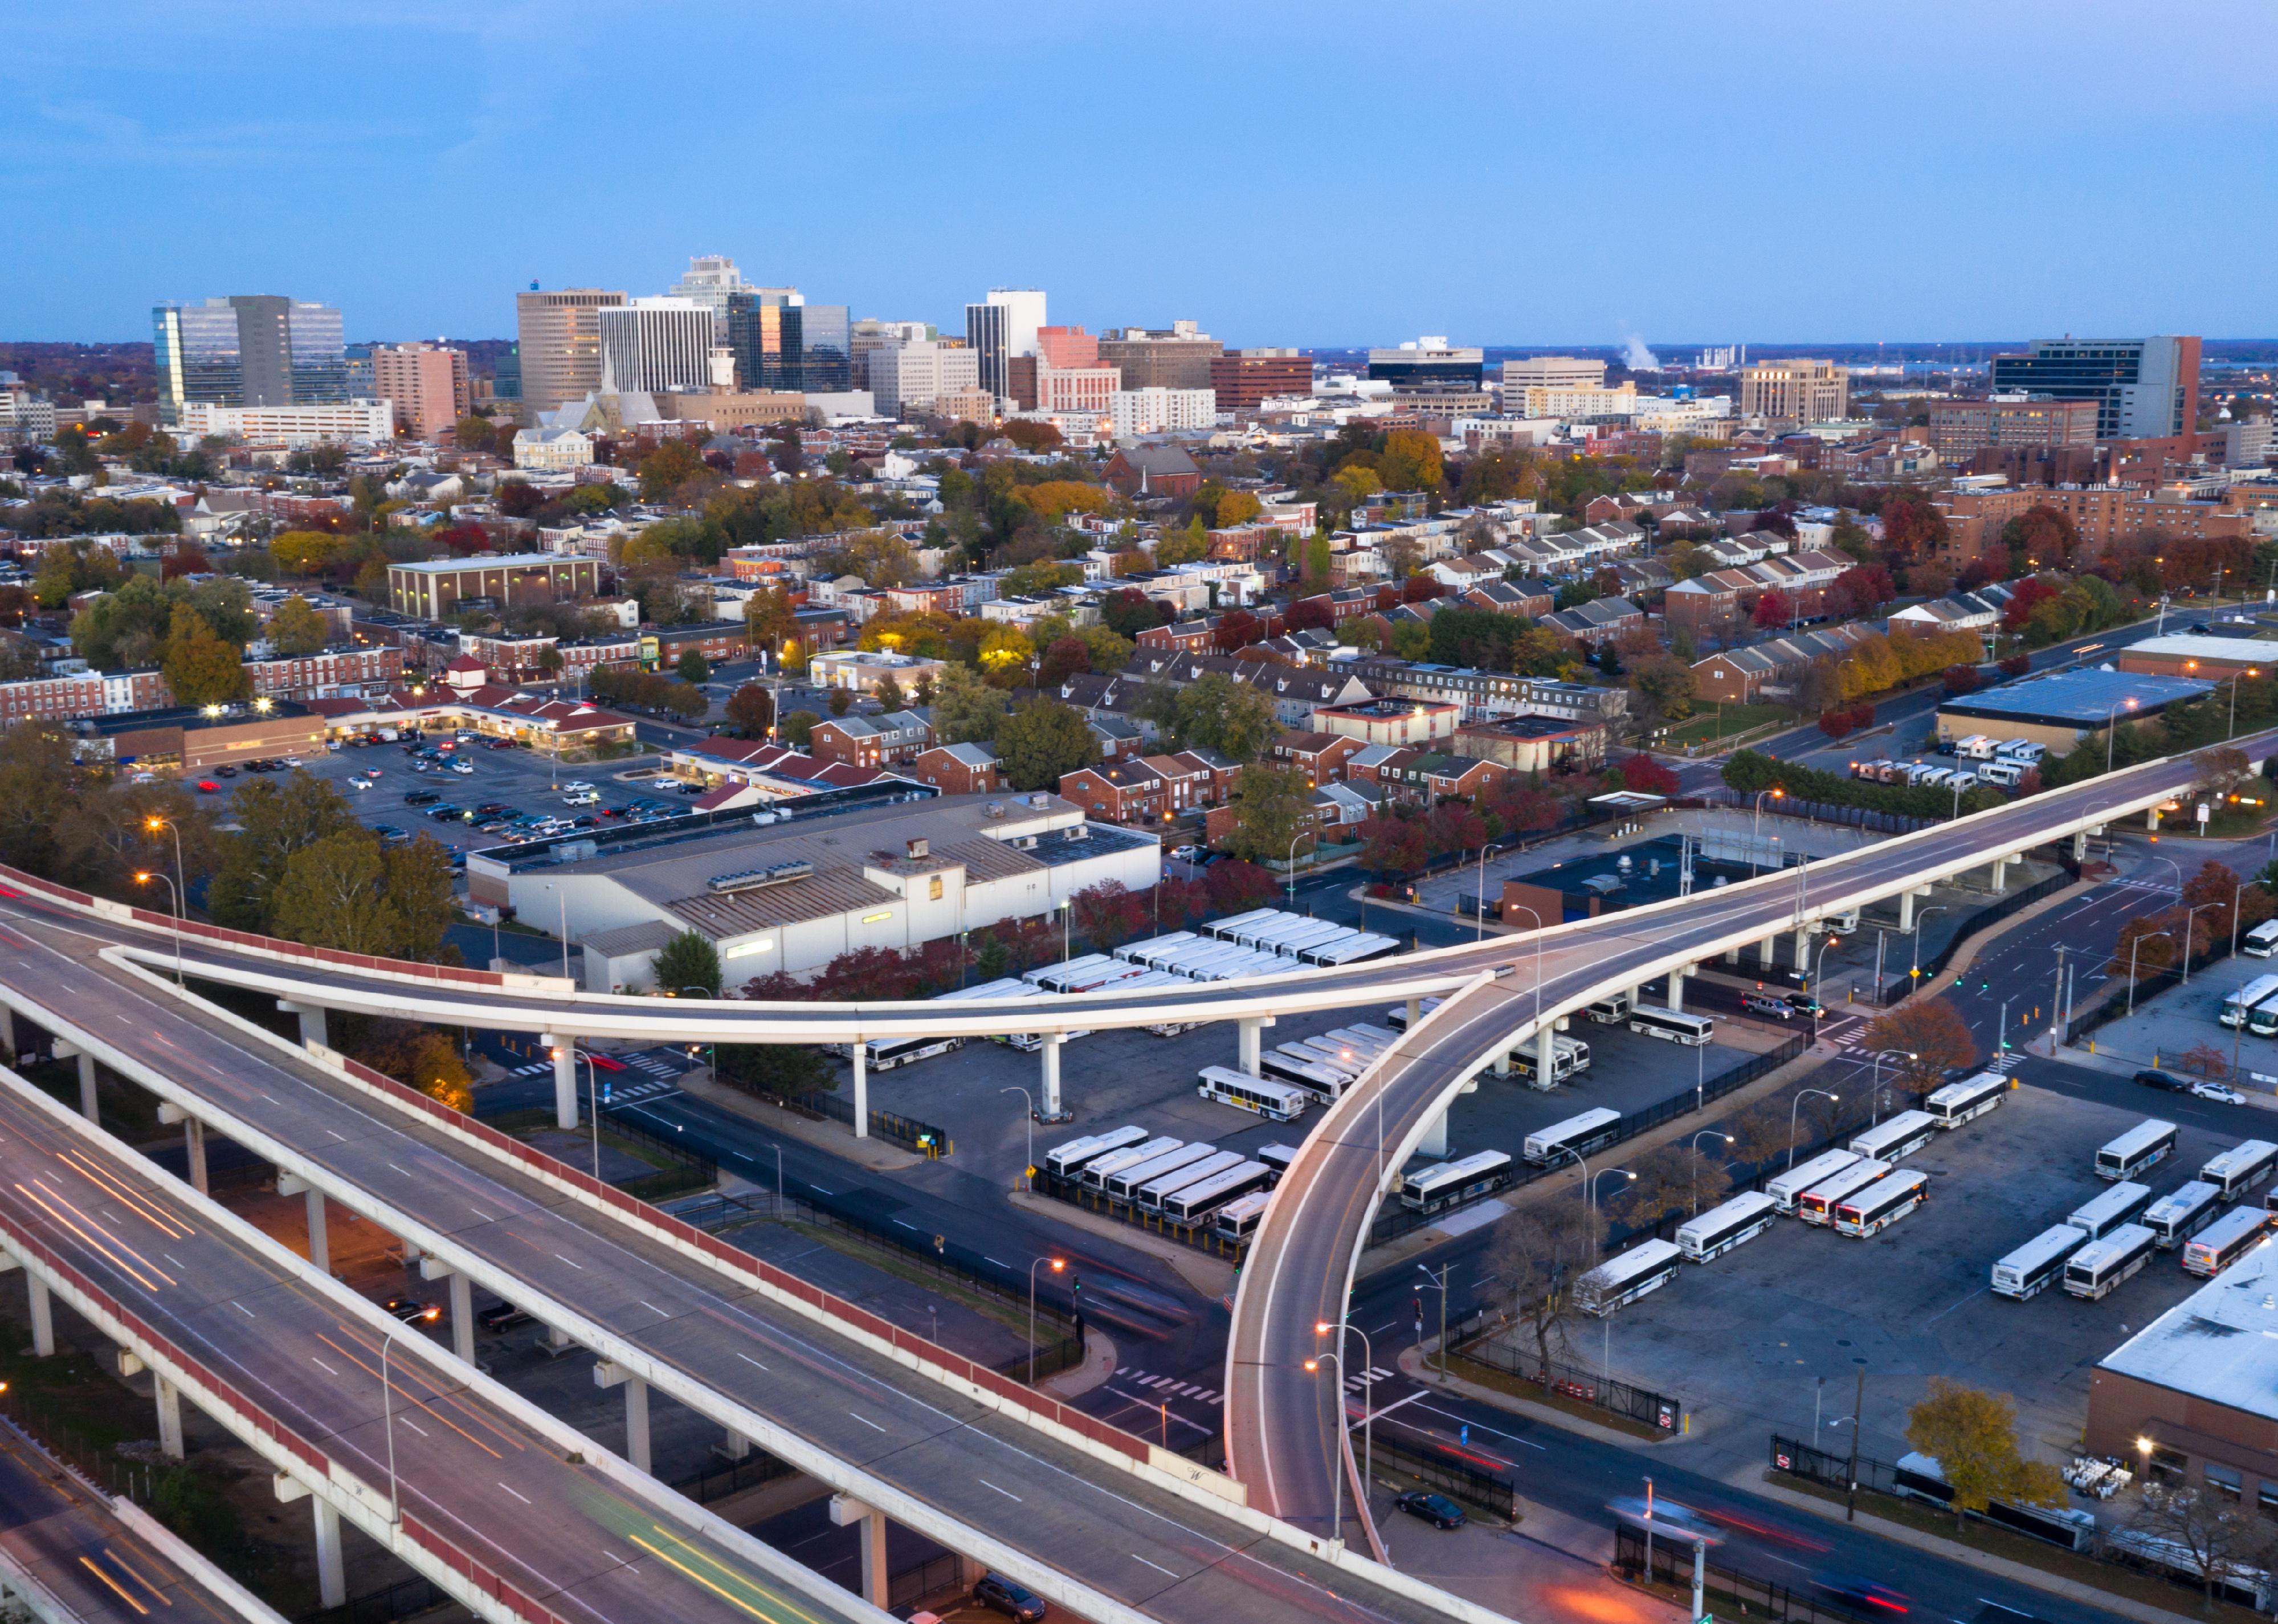
Real Window Creative // Getty Images
#20. Delaware
Aerial view of Wilmington.
– Median household income: $71,091 (2.0% more than U.S. median income)
– Households earning less than $10,000: 20,504 (5.20%)
– Households earning over $200,000: 33,025 (8.30%)
– Median earnings for workers: $41,374 (men: $60,608; women: $51,827)
– Unemployment rate: 5.60%
– Families with income below poverty level: 8.60%
– Households with health insurance: 94.30%

Josemaria Toscano // Getty Images
#19. Oregon
Aerial view of Portland at sunset from Pittock Mansion.
– Median household income: $71,562 (2.6% more than U.S. median income)
– Households earning less than $10,000: 90,749 (5.30%)
– Households earning over $200,000: 153,152 (9.00%)
– Median earnings for workers: $40,063 (men: $60,831; women: $51,057)
– Unemployment rate: 6.40%
– Families with income below poverty level: 7.60%
– Households with health insurance: 93.90%

Sean Pavone // Getty Images
#18. Illinois
Downtown Chicago skyline from Lincoln Park at twilight.
– Median household income: $72,205 (3.6% more than U.S. median income)
– Households earning less than $10,000: 321,928 (6.40%)
– Households earning over $200,000: 504,727 (10.10%)
– Median earnings for workers: $41,504 (men: $63,819; women: $51,131)
– Unemployment rate: 7.40%
– Families with income below poverty level: 8.60%
– Households with health insurance: 93.00%

Sean Pavone // Getty Images
#17. Vermont
Montpelier skyline in autumn.
– Median household income: $72,431 (3.9% more than U.S. median income)
– Households earning less than $10,000: 10,992 (4.10%)
– Households earning over $200,000: 23,553 (8.70%)
– Median earnings for workers: $40,249 (men: $55,803; women: $51,931)
– Unemployment rate: 4.20%
– Families with income below poverty level: 6.30%
– Households with health insurance: 96.30%
You may also like: States where food stamps are used the most

ESB Professional // Getty Images
#16. Rhode Island
Providence cityscape at Waterplace Park.
– Median household income: $74,008 (6.2% more than U.S. median income)
– Households earning less than $10,000: 25,735 (5.80%)
– Households earning over $200,000: 45,324 (10.30%)
– Median earnings for workers: $41,891 (men: $63,219; women: $54,188)
– Unemployment rate: 7.70%
– Families with income below poverty level: 7.00%
– Households with health insurance: 95.70%

oneinchpunch // Getty Images
#15. New York
View of Brooklyn Bridge and Manhattan skyline.
– Median household income: $74,314 (6.6% more than U.S. median income)
– Households earning less than $10,000: 535,006 (7.00%)
– Households earning over $200,000: 987,887 (12.90%)
– Median earnings for workers: $43,462 (men: $67,512; women: $59,869)
– Unemployment rate: 8.70%
– Families with income below poverty level: 10.10%
– Households with health insurance: 94.80%

f11photo // Getty Images
#14. Minnesota
Downtown Minneapolis skyline at sunset.
– Median household income: $77,720 (11.5% more than U.S. median income)
– Households earning less than $10,000: 96,651 (4.20%)
– Households earning over $200,000: 226,903 (9.90%)
– Median earnings for workers: $43,853 (men: $64,611; women: $52,535)
– Unemployment rate: 4.90%
– Families with income below poverty level: 5.50%
– Households with health insurance: 95.50%

SCStock // Getty Images
#13. Alaska
Creek Street in Ketchikan.
– Median household income: $77,845 (11.7% more than U.S. median income)
– Households earning less than $10,000: 14,625 (5.40%)
– Households earning over $200,000: 27,700 (10.20%)
– Median earnings for workers: $41,962 (men: $62,134; women: $55,285)
– Unemployment rate: 7.00%
– Families with income below poverty level: 7.10%
– Households with health insurance: 88.60%

Sean Pavone // Getty Images
#12. Utah
Downtown Salt Lake City skyline at dusk.
– Median household income: $79,449 (14.0% more than U.S. median income)
– Households earning less than $10,000: 47,612 (4.30%)
– Households earning over $200,000: 108,131 (9.80%)
– Median earnings for workers: $37,325 (men: $61,269; women: $44,707)
– Unemployment rate: 3.50%
– Families with income below poverty level: 5.90%
– Households with health insurance: 91.00%
You may also like: Most popular grocery stores in America

Sean Pavone // Getty Images
#11. Virginia
Downtown Richmond skyline.
– Median household income: $80,963 (16.1% more than U.S. median income)
– Households earning less than $10,000: 167,157 (5.00%)
– Households earning over $200,000: 445,751 (13.40%)
– Median earnings for workers: $43,963 (men: $66,014; women: $53,414)
– Unemployment rate: 4.80%
– Families with income below poverty level: 6.90%
– Households with health insurance: 93.20%

Andrew Zarivny // Getty Images
#10. Colorado
Downtown Denver including City Park.
– Median household income: $82,254 (18.0% more than U.S. median income)
– Households earning less than $10,000: 110,592 (4.80%)
– Households earning over $200,000: 277,905 (12.00%)
– Median earnings for workers: $44,818 (men: $65,217; women: $54,635)
– Unemployment rate: 5.30%
– Families with income below poverty level: 6.20%
– Households with health insurance: 92.00%

Sean Pavone // Getty Images
#9. Connecticut
Downtown Hartford skyline.
– Median household income: $83,771 (20.2% more than U.S. median income)
– Households earning less than $10,000: 74,573 (5.20%)
– Households earning over $200,000: 208,195 (14.60%)
– Median earnings for workers: $45,511 (men: $73,022; women: $60,672)
– Unemployment rate: 6.70%
– Families with income below poverty level: 6.70%
– Households with health insurance: 94.80%

Agnieszka Gaul // Getty Images
#8. Washington
Seattle skyline and Mount Rainier on a clear day.
– Median household income: $84,247 (20.8% more than U.S. median income)
– Households earning less than $10,000: 145,555 (4.80%)
– Households earning over $200,000: 422,689 (14.00%)
– Median earnings for workers: $46,951 (men: $74,068; women: $57,567)
– Unemployment rate: 5.90%
– Families with income below poverty level: 6.50%
– Households with health insurance: 93.60%

Izabela23 // Getty Images
#7. Hawaii
Aerial view of Downtown Honolulu skyline and the surrounding area.
– Median household income: $84,857 (21.7% more than U.S. median income)
– Households earning less than $10,000: 26,535 (5.40%)
– Households earning over $200,000: 65,102 (13.30%)
– Median earnings for workers: $40,595 (men: $61,812; women: $49,816)
– Unemployment rate: 7.70%
– Families with income below poverty level: 8.00%
– Households with health insurance: 96.10%
You may also like: Iconic car debuts from the year you were born

Lucky-photographer // Getty Images
#6. California
Golden Gate Bridge at sunset seen from San Francisco beach.
– Median household income: $84,907 (21.8% more than U.S. median income)
– Households earning less than $10,000: 715,644 (5.30%)
– Households earning over $200,000: 2,082,043 (15.50%)
– Median earnings for workers: $41,891 (men: $65,324; women: $57,373)
– Unemployment rate: 8.30%
– Families with income below poverty level: 9.00%
– Households with health insurance: 93.00%

Winston Tan // Getty Images
#5. New Hampshire
Aerial view of White Mountain National Forest in autumn.
– Median household income: $88,465 (26.9% more than U.S. median income)
– Households earning less than $10,000: 17,235 (3.10%)
– Households earning over $200,000: 62,138 (11.30%)
– Median earnings for workers: $45,677 (men: $68,566; women: $51,880)
– Unemployment rate: 3.60%
– Families with income below poverty level: 4.80%
– Households with health insurance: 94.90%
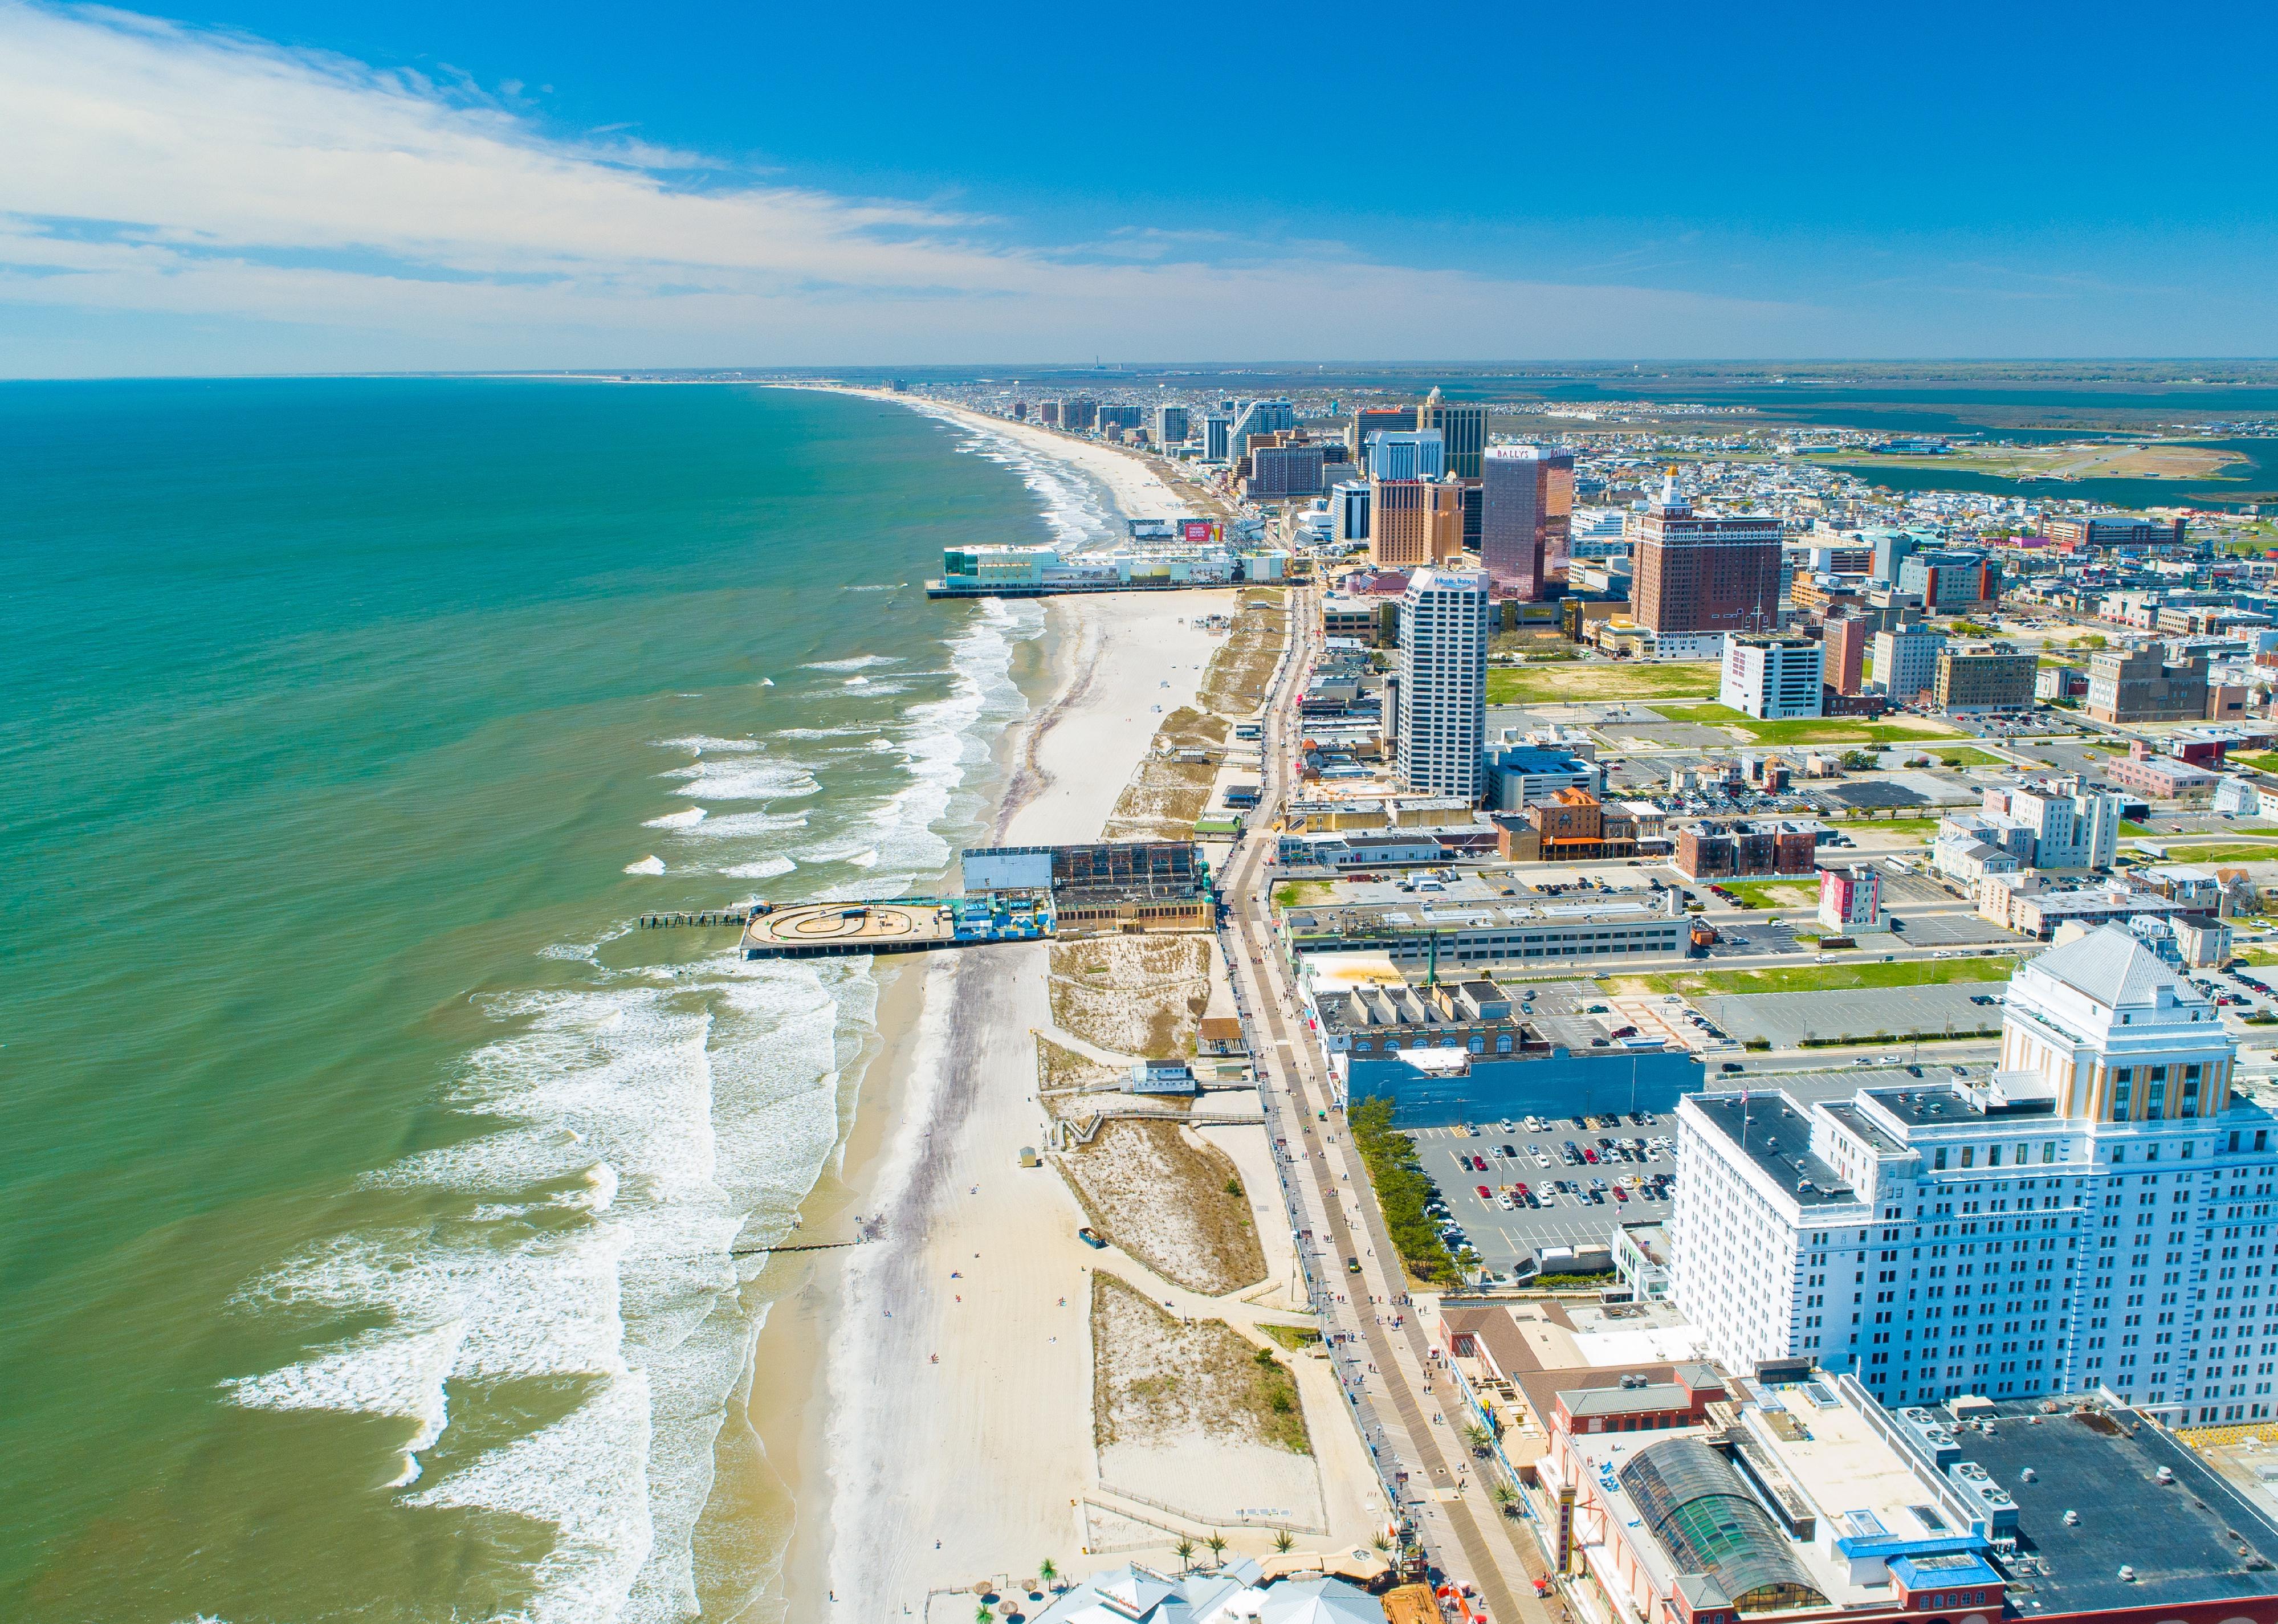
Mia2you // Getty Images
#4. New Jersey
Aerial view of Atlantic City boardwalk.
– Median household income: $89,296 (28.1% more than U.S. median income)
– Households earning less than $10,000: 171,737 (4.90%)
– Households earning over $200,000: 584,370 (16.70%)
– Median earnings for workers: $50,021 (men: $75,297; women: $61,802)
– Unemployment rate: 8.10%
– Families with income below poverty level: 7.40%
– Households with health insurance: 92.80%

Travellaggio // Getty Images
#3. Massachusetts
Boston skyline in sunny summer day, view from harbor of downtown.
– Median household income: $89,645 (28.6% more than U.S. median income)
– Households earning less than $10,000: 149,006 (5.40%)
– Households earning over $200,000: 472,304 (17.10%)
– Median earnings for workers: $50,683 (men: $77,636; women: $66,536)
– Unemployment rate: 6.60%
– Families with income below poverty level: 7.10%
– Households with health insurance: 97.50%

Sean Pavone // Getty Images
#2. Washington D.C.
Washington D.C. at the White House and Lafayette Square.
– Median household income: $90,088 (29.2% more than U.S. median income)
– Households earning less than $10,000: 30,677 (9.60%)
– Households earning over $200,000: 68,951 (21.60%)
– Median earnings for workers: $72,457 (men: $103,222; women: $87,244)
– Unemployment rate: 8.20%
– Families with income below poverty level: 12.80%
– Households with health insurance: 96.30%
You may also like: 25 richest families in America

Sean Pavone // Getty Images
#1. Maryland
Downtown Annapolis, view over Main Street with the State House.
– Median household income: $90,203 (29.4% more than U.S. median income)
– Households earning less than $10,000: 122,990 (5.20%)
– Households earning over $200,000: 355,084 (15.10%)
– Median earnings for workers: $50,548 (men: $71,995; women: $62,190)
– Unemployment rate: 5.90%
– Families with income below poverty level: 7.40%
– Households with health insurance: 93.90%
