Safest cities in America 2023: Violent crime rate increases drive per capita cost of crime
Canva
Safest cities in America 2023: Violent crime rate increases drive per capita cost of crime
A view across the water of Austin, Texas.
Despite progress overall, crime still impacts America’s communities. Crime and safety are intertwined with prosperity, income and economic opportunity. Crime is costly to individual victims, perpetrators, communities and society at large.
MoneyGeek‘s annual analysis looks at the most recent crime statistics from the Federal Bureau of Investigation (FBI) to estimate the cost of crime in 263 cities with populations greater than 100,000 across the United States. The analysis pairs reported crime statistics with academic research on the societal costs of different types of crimes to estimate the cost of crime for each city.
KEY FINDINGS:
- The cost of crime per capita in U.S. cities was $1,836 in 2021, up 6%, or $100 per capita since 2020.
- Naperville, Illinois, retained its No. 1 rank as the safest city overall ($156 per capita); St. Louis, Missouri, also kept its rank as the most dangerous city, with the highest per capita crime ($8,457).
- Mass shootings represented 4% of the total cost of crime in 2021, but are up 33% compared to 2020. Boulder, Colorado, had the highest societal costs due to mass shootings ($108.6 million).
![]()
MoneyGeek
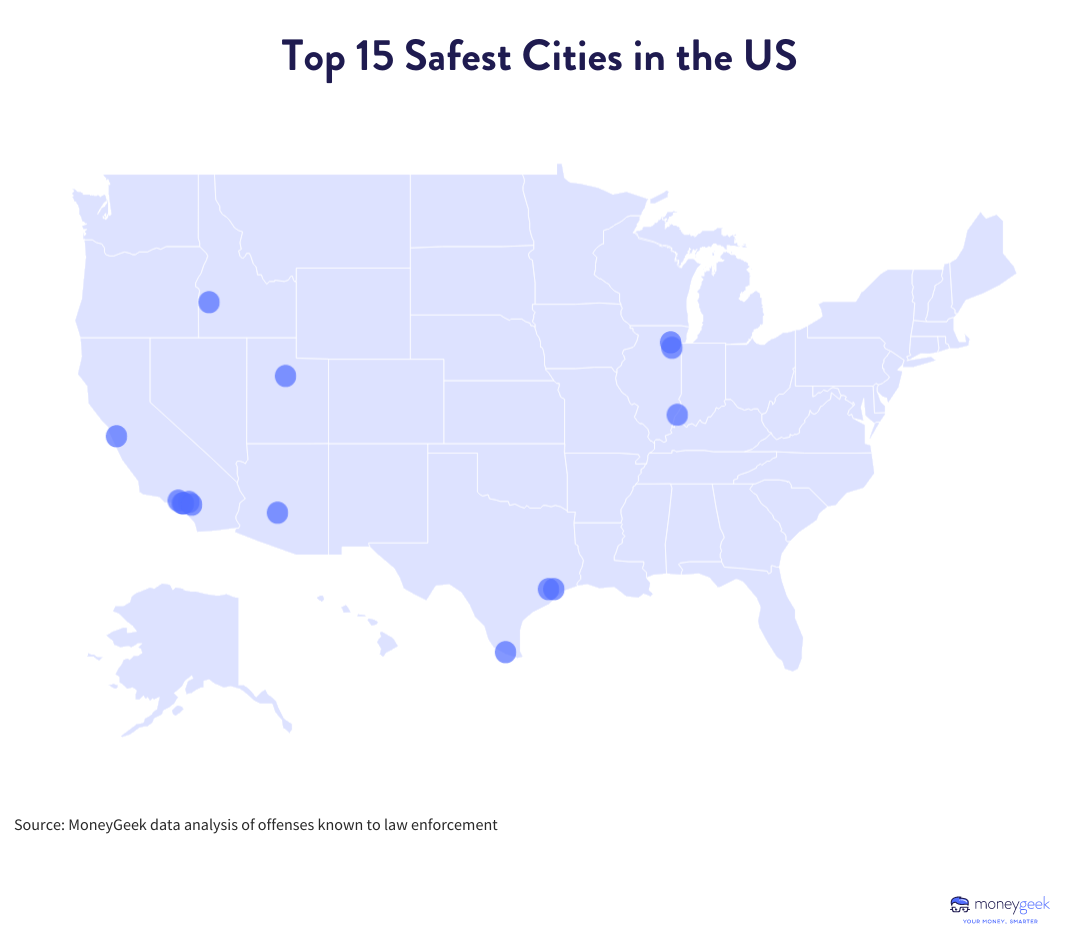
The 15 Safest Cities in America
Map of the United States showing the top 15 safest cities in the country.
MoneyGeek ranked 263 cities with populations over 100,000 people from most to least safe in this analysis. The following summaries show the safest cities overall and the safest large cities from the analysis and their per capita cost of crime.
- Naperville, IL – $156 cost of crime per capita
- Sunnyvale, CA – $156
- West Covina, CA – $181
- Carmel, IN – $205
- Glendale, AZ – $210
- Meridian, ID – $230
- Provo, UT – $245
- Joliet, IL – $247
- Jurupa Valley, CA – $253
- Sugar Land, TX – $260
- McAllen, TX – $268
- El Monte, CA – $277
- Rancho Cucamonga, CA – $283
- Glendale, CA – $299
- Pearland, TX – $302
15 SAFEST LARGE CITIES
- Honolulu, HI – $528 cost of crime per capita
- Virginia Beach, VA – $550
- Henderson, NV – $805
- El Paso, TX – $837
- New York, NY – $863
- San Diego, CA – $963
- Mesa, AZ – $1,069
- Charlotte, NC – $1,073
- San Jose, CA – $1,106
- Boston, MA – $1,119
- Raleigh, NC – $1,149
- Arlington, TX – $1,264
- Santa Ana, CA – $1,416
- Omaha, NE – $1,503
- Austin, TX – $1,577
MoneyGeek
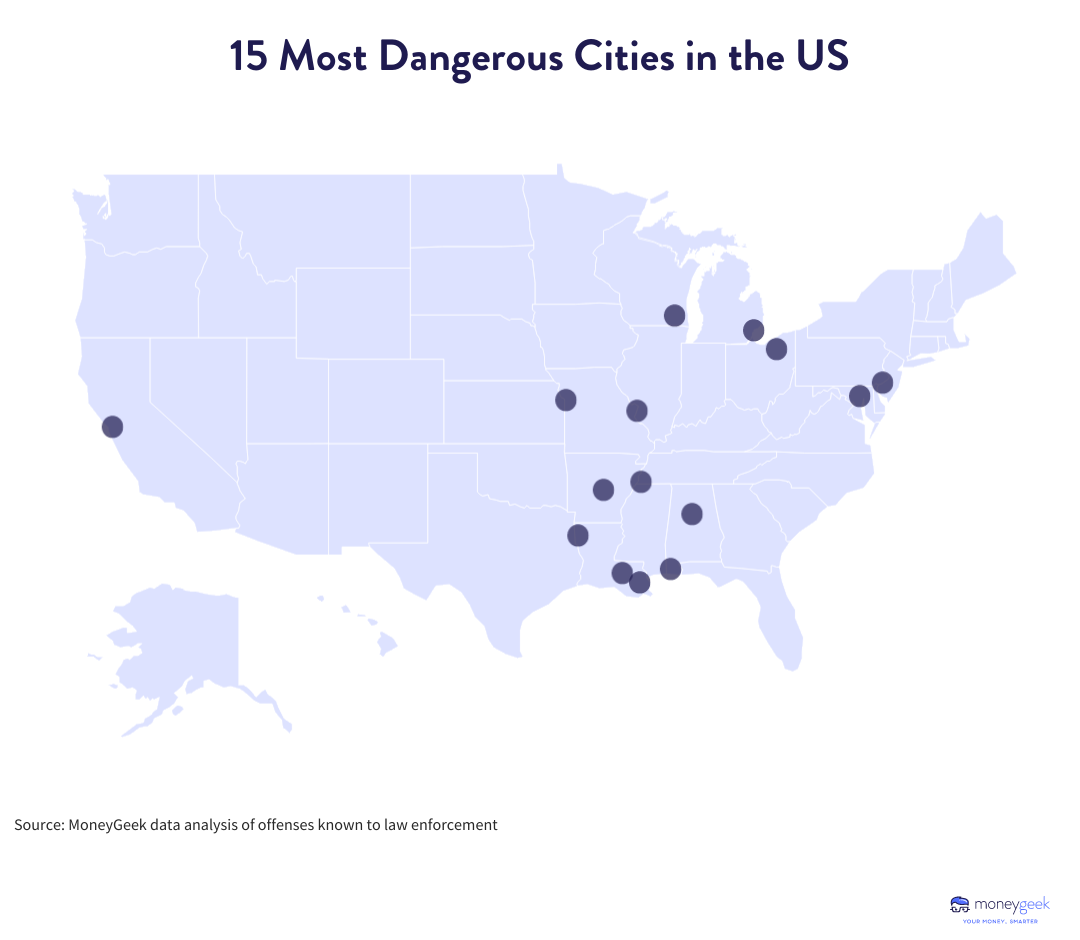
The 15 Most Dangerous Cities
Map of the United States showing the top 15 most dangerous cities in the country.
There’s an ongoing stereotype that larger cities are more dangerous. While no larger cities (population of 300,000 or more) made the overall safest list, fewer than half of the 15 least-safe cities in the U.S. The most dangerous cities were determined from the analysis by their per capita cost of crime.
- St. Louis, MO – $8,457 cost of crime per capita
- Mobile, AL – $8,014
- Birmingham, AL – $7,900
- Baltimore, MD – $7,230
- Memphis, TN – $7,184
- Detroit, MI – $6,780
- Cleveland, OH – $6,491
- New Orleans, LA – $6,444
- Shreveport, LA – $6,344
- Baton Rouge, LA – $5,739
- Little Rock, AR – $5,374
- Oakland, CA – $5,329
- Milwaukee, WI – $5,243
- Kansas City, MO – $4,884
- Philadelphia, PA – $4,755
Mass Shootings in American Cities Are Getting Worse
Mass shootings are a particular scourge on American life. According to Gun Violence Archive, which defines mass shootings as any single incident in which four or more people are shot, there were 648 mass shootings in 2022 and 18 as of January 9, 2023.
Mass shooting events are included in our safest and most dangerous cities rankings. Though they are relatively rare, we do not adjust our rankings for these events. The emotional impact of mass shootings is incalculable, traumatizing families and entire communities. To quantify the economic impact, MoneyGeek calculated the total cost of mass shootings in 2021 to be $8 billion — that’s about 4% of the total cost of crime in the approximately 263 cities analyzed and a 33% increase in costs from 2020 to 2021.
WORST CITIES FOR MASS SHOOTINGS IN 2021
- Boulder, CO – $108,651,414
- San Jose, CA – $108,393,140
- Indianapolis, IN – $98,457,785
- Atlanta, GA – $86,843,649
- Colorado Springs, CO – $75,875,198
Safety and the Cost of Crime
The direct economic costs of crime to individuals and society include victim medical and mental health care needs, damage to and loss of property and police and corrections costs. Aside from the imminent danger of crime, people living in higher crime areas see depressed home values and pay higher premiums on average for home insurance, renters insurance and auto insurance.
To assess the safest cities, MoneyGeek analyzed crime data, including violent crimes such as murder, rape and aggravated assault and property crimes such as home burglary and motor vehicle theft. This list calculated each city’s cost of crime and ranked the cities based on the cost of crime per capita. Additionally, researchers have quantified how much more violent crimes cost a community than property crimes.
While perceptions of safety are vital, crime statistics do not capture any city or community’s whole story.
“Behind all these averages that people like to cite about the crime rates in different communities are individual people and their decisions about how they choose to engage in their community,” says Jesse Bruhn, Annenberg assistant professor of education and economics at Brown University who researches education issues and inner-city gang violence. “There’s a lot more heterogeneity in these patterns that we just can’t measure.”
Despite genuine threats, Bruhn says, it may be surprising how safe people can feel in neighborhoods with high crime rates.
Canva
Methodology
Aerial view of San Diego, California.
To rank the safest cities in the United States, this analysis started with standardized crime statistics reported to the FBI from 2021, the latest year of available data. The population of each city was added to the analysis to determine crime rates per 100,000 people, and this information was also accessed via data provided by the FBI.
When cities with more than 100,000 people or more did not have data available in the FBI dataset, MoneyGeek conducted individualized research on standardized crime statistics for each specific city. Please note that 2021 data was limited for cities in California, the District of Columbia, Florida, Illinois, Maryland, New Jersey, New Mexico, New York and Pennsylvania. We omitted any cities that did not report murder and rape.
This analysis includes 263 cities.
MoneyGeek relied on research by professors Kathryn McCollister and Michael French of the University of Miami and Hai Fang of the University of Colorado, Denver to determine the cost of crime to society. Findings were integrated into the broader dataset to better understand the societal cost of crime within individual cities. Lastly, data was used via Wikipedia on the number and nature of mass shootings in the United States in 2021.
SOURCES
- Federal Bureau of Investigation. “FBI Releases 2020 Crime Statistics.” Accessed December 31, 2022.
- Gun Violence Archive. “General Methodology.” Accessed January 9, 2023.
- Gun Violence Archive. “Gun Violence Archive 2020.” Accessed January 9, 2023.
- Kathryn E. McCollister, Michael T. French and Hal Fang. “The Cost of Crime to Society: New Crime-Specific Estimates for Policy and Program Evaluation.” Accessed December 31, 2022.
- Wikipedia. “List of mass shootings in the United States in 2021.” Accessed December 30, 2022.
This story originally appeared on MoneyGeek and has been independently reviewed to meet journalistic standard
