How the rate of first-time home buying has changed over time

4 PM production // Shutterstock
How the rate of first-time home buying has changed over time
A family moving boxes into a new home.
For many, the American dream starts with buying a first home.
That milestone was achieved by just under half of all homebuyers last year: First-time homebuyers accounted for 44% of the home-buying population in 2021, according to census data. Sales reached record levels nationally and in certain major metro areas, including San Francisco, New York City, and San Jose, California, first-time homebuyers accounted for more than half of buyers that same year.
Texas Real Estate Source examined historical data from the Census Bureau’s American Housing Survey to see how the share of first-time home buyers has changed in the last 10 years time. A sale is considered a first-time home purchase if neither the primary buyer nor any co-buyer has ever owned another home as a primary residence. In addition to exploring how the rate of first-time home buyers has evolved, the 25 cities with the highest share of first-time homebuyers have been listed (data also from the American Housing Survey).
Among the most important factors that first-time homebuyers consider is whether it makes more financial sense to rent or buy. Generally, this is determined by a calculation of monthly mortgage payments versus rental costs—although if a buyer intends to stay in a house for at least five years, the scales most commonly tip in favor of owning. In locations such as Detroit in 2021, rent came in far below the average mortgage; in San Francisco, however, renters came out on top despite a high volume of first-time buyers that year.
Keep reading to see how the rate of first-time home buying has changed over time and which metros have the highest rate of these buyers.
![]()
Rentlodex
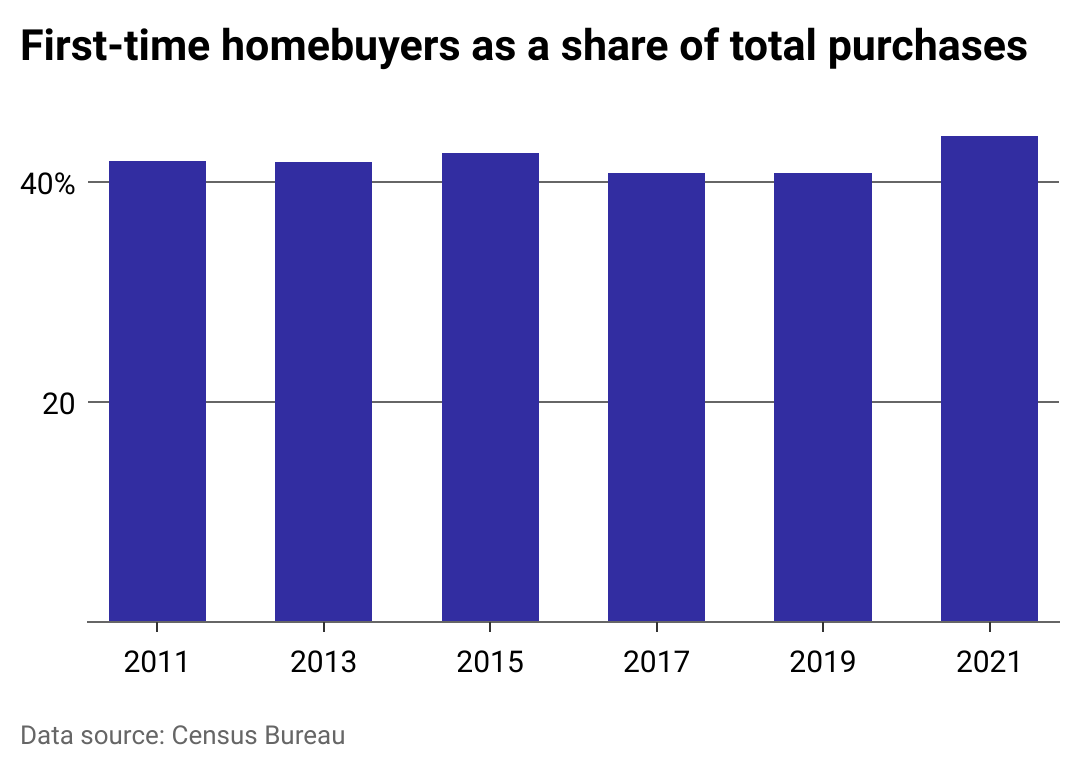
In the last decade, first-time homebuyers represented at least 40% of the home-buying population
Chart showing first-time homebuyers as a share of total home purchases.
Purchase rates of first homes have remained fairly steady since 2021. First-time homebuyers have made up a sizable proportion of the overall home-buying population for the last 10 years, hovering just over 40%, according to the Census Bureau’s American Housing Survey. That percentage jumped slightly between 2019 and 2021 to a 10-year high. While the pandemic did push up prices, new homebuyers jumped into the market at increasing rates.
That said, people are waiting longer to buy their first home. Forty years ago, the median age of a first-time buyer was 29; today, it’s 33.
Canva
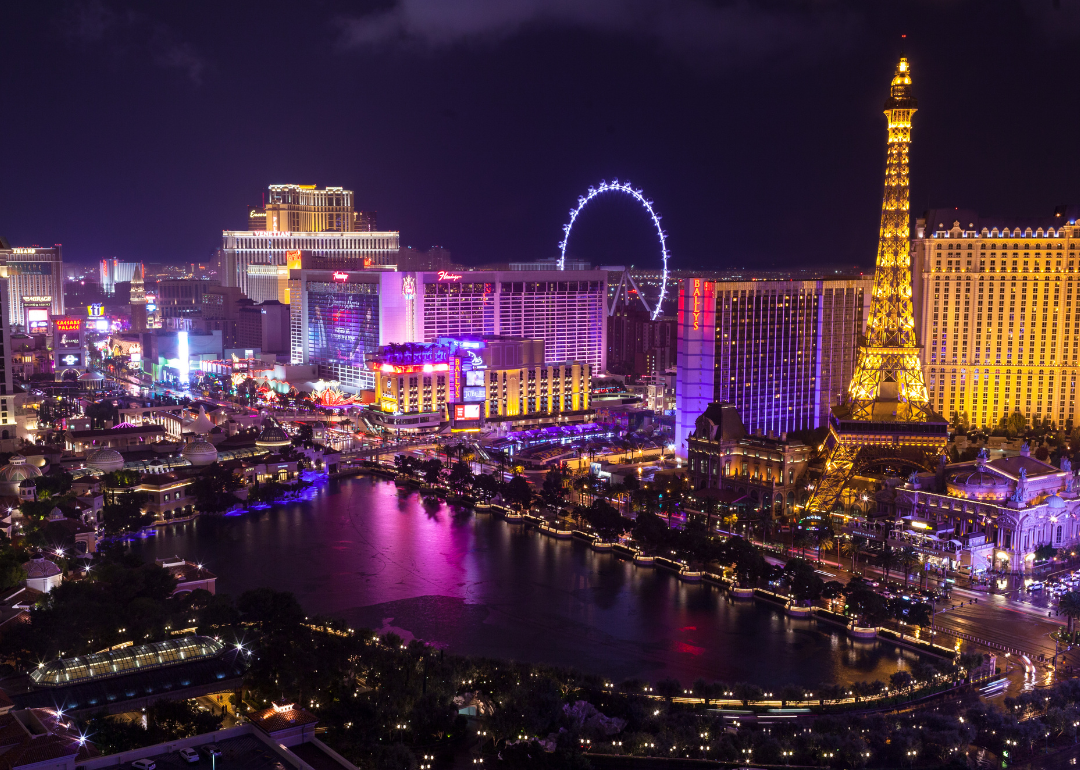
#25. Las Vegas
The Las Vegas Strip at night.
– Share of first-time buyers: 34.2%
Canva
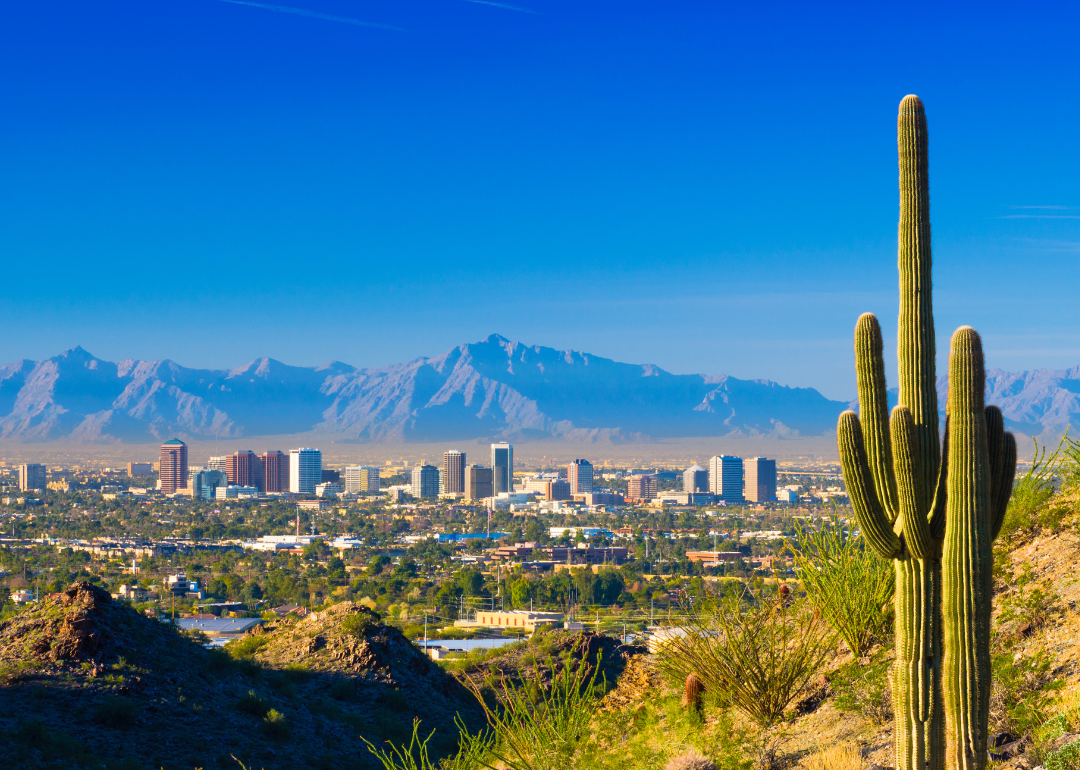
#24. Phoenix
The Phoenix skyline with cacti in the foreground.
– Share of first-time buyers: 34.4%
Canva
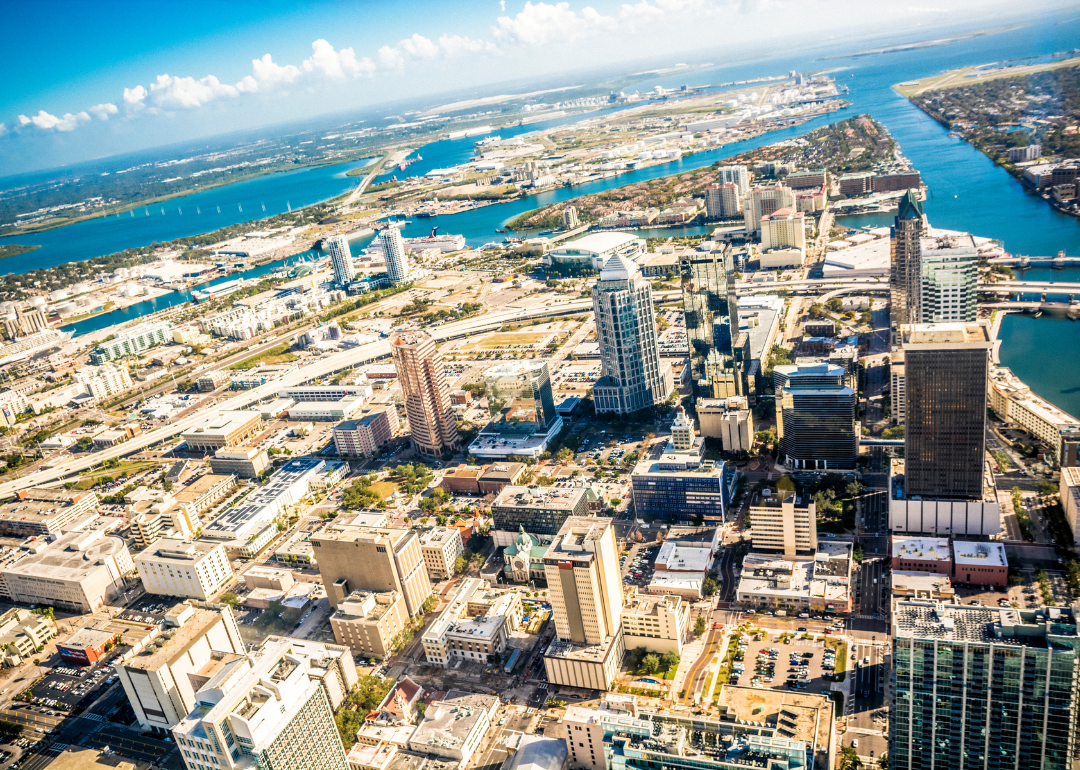
#23. Tampa, Florida
Tampa as viewed from above.
– Share of first-time buyers: 37.1%
Canva
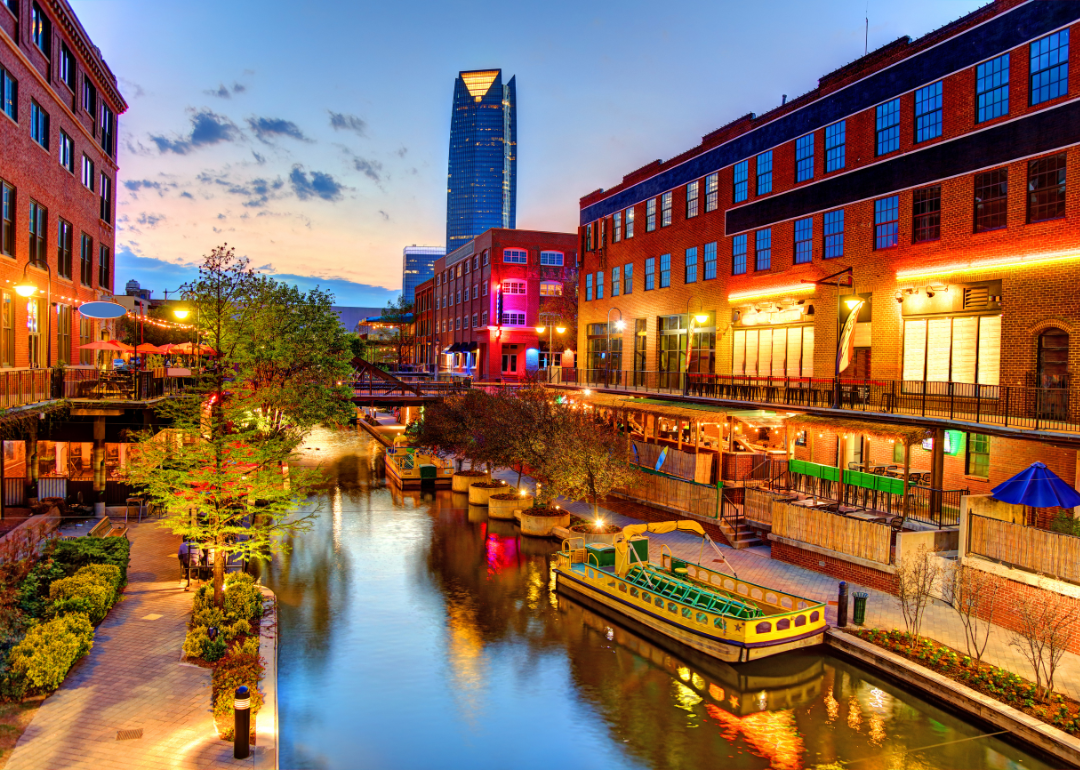
#22. Oklahoma City, Oklahoma
Bricktown, a neighborhood in Oklahoma City.
– Share of first-time buyers: 37.2%

Canva
#21. Dallas
Dallas, Texas, as viewed from afar.
– Share of first-time buyers: 39.2%
Canva
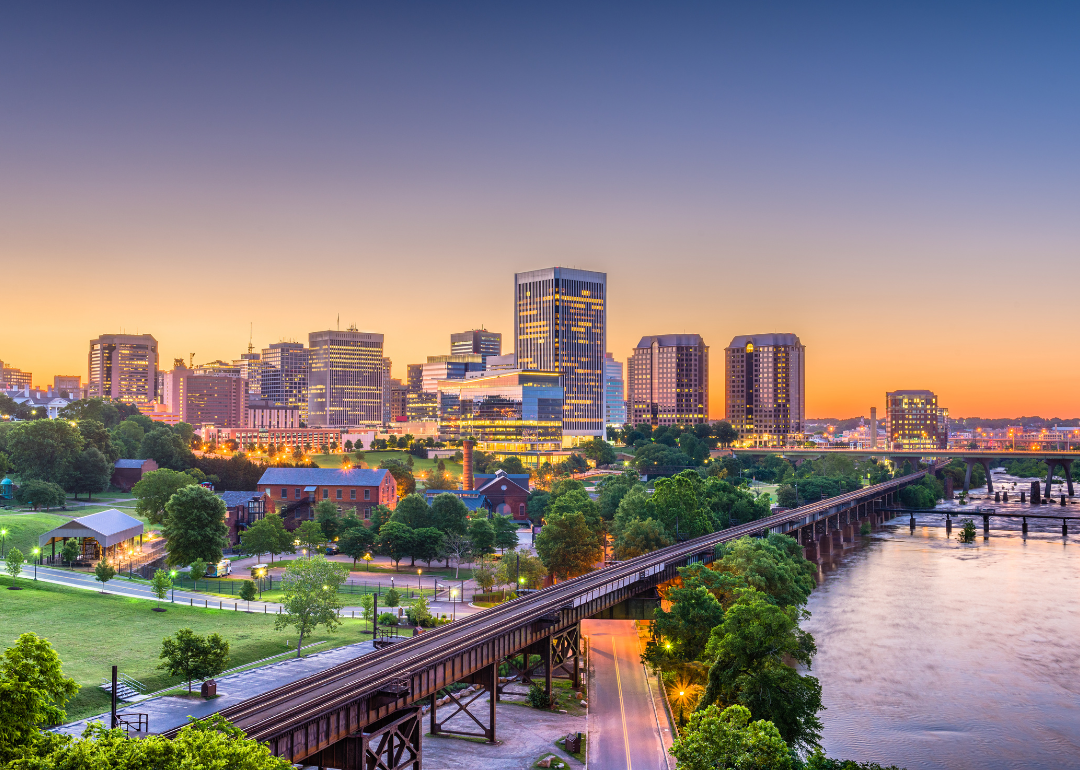
#20. Richmond, Virginia
Richmond, Virginia.
– Share of first-time buyers: 40.5%
Canva
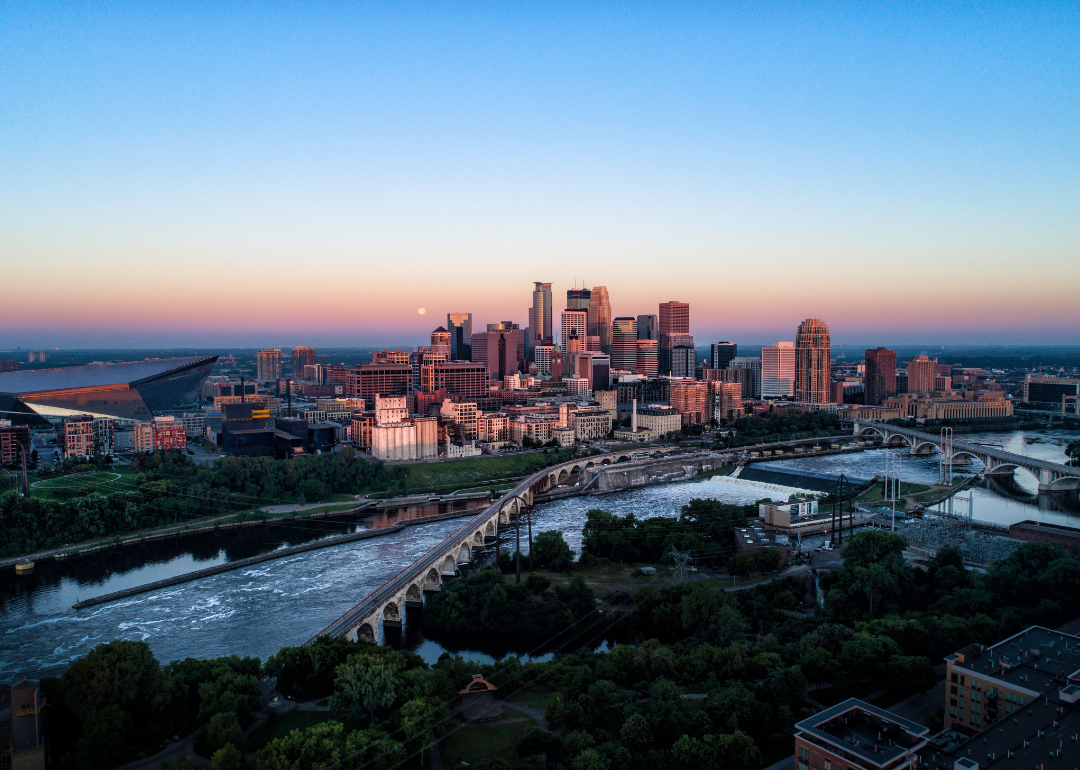
#19. Minneapolis
Minneapolis at sunsrise.
– Share of first-time buyers: 40.8%
Canva
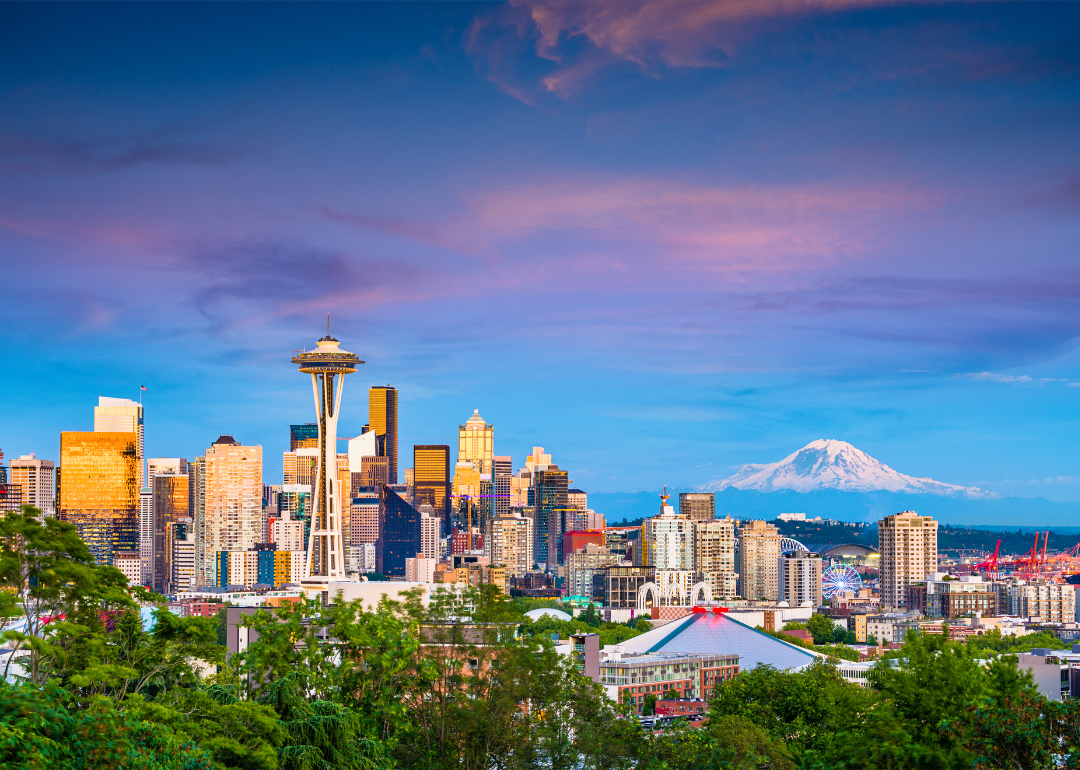
#18. Seattle
The Seattle skyline.
– Share of first-time buyers: 41.4%
Canva
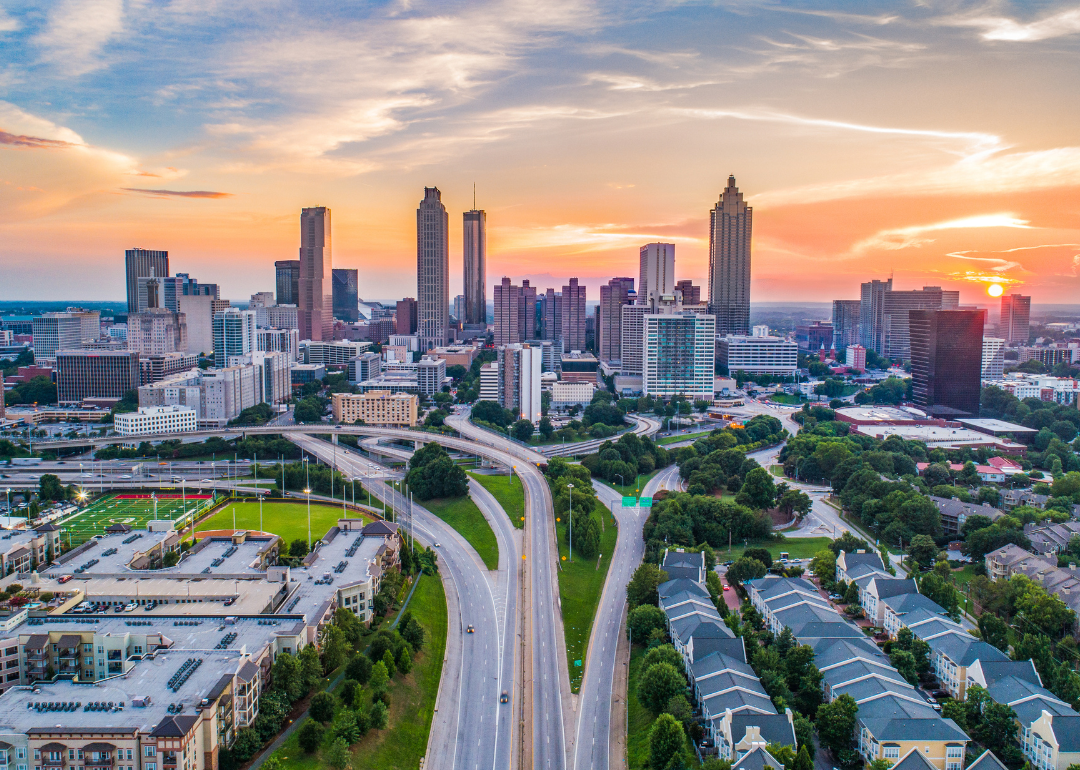
#17. Atlanta
An aerial view of downtown Atlanta, Georgia.
– Share of first-time buyers: 41.6%
Canva
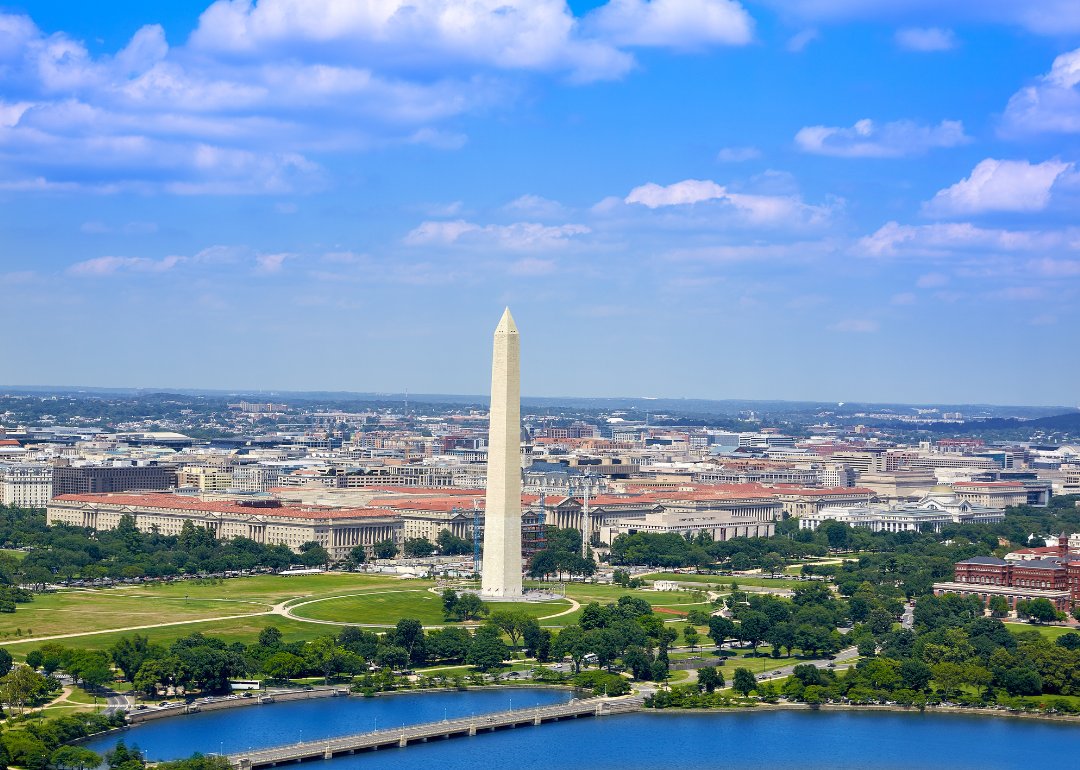
#16. Washington D.C.
Washington DC.
– Share of first-time buyers: 42.4%
Canva
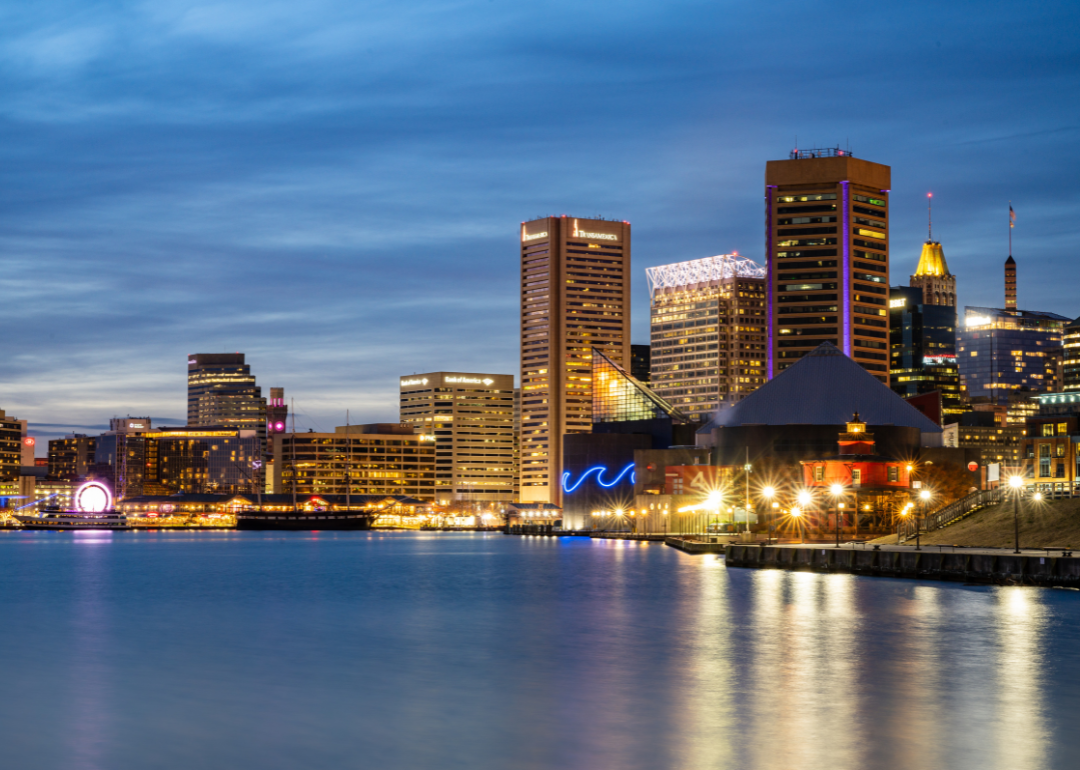
#15. Baltimore
Baltimore at dusk.
– Share of first-time buyers: 43.4%
Canva
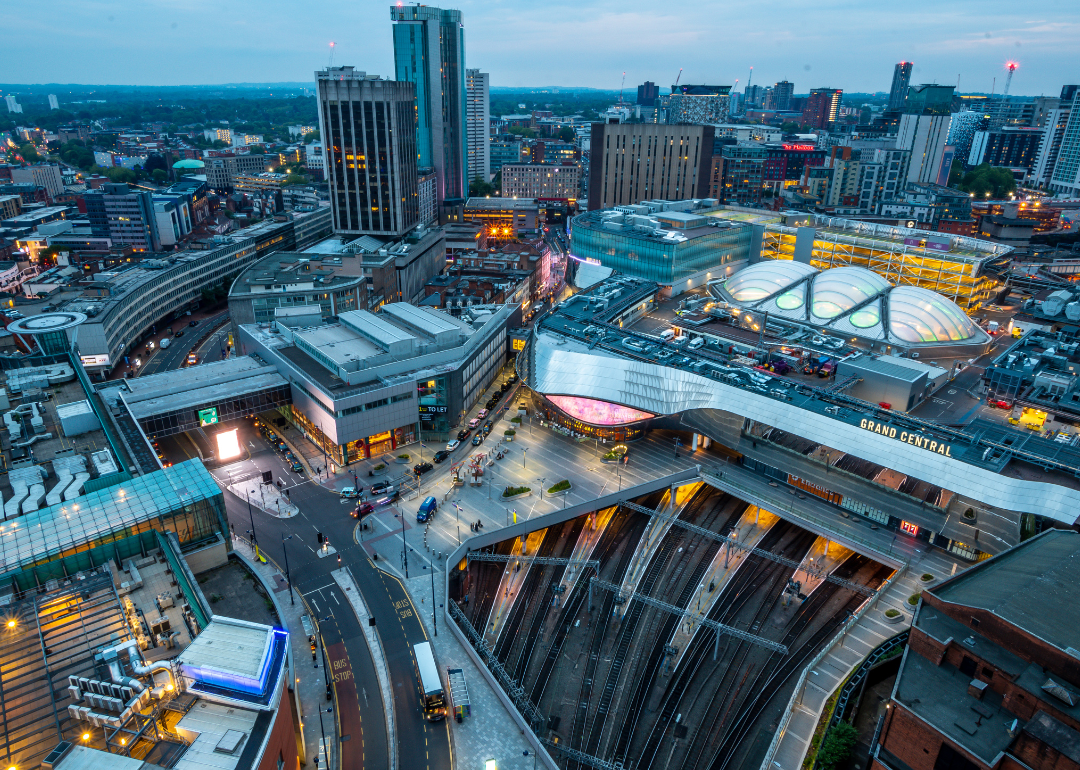
#14. Birmingham
An aerial view of Birmingham, Alabama.
– Share of first-time buyers: 44.1%
Canva
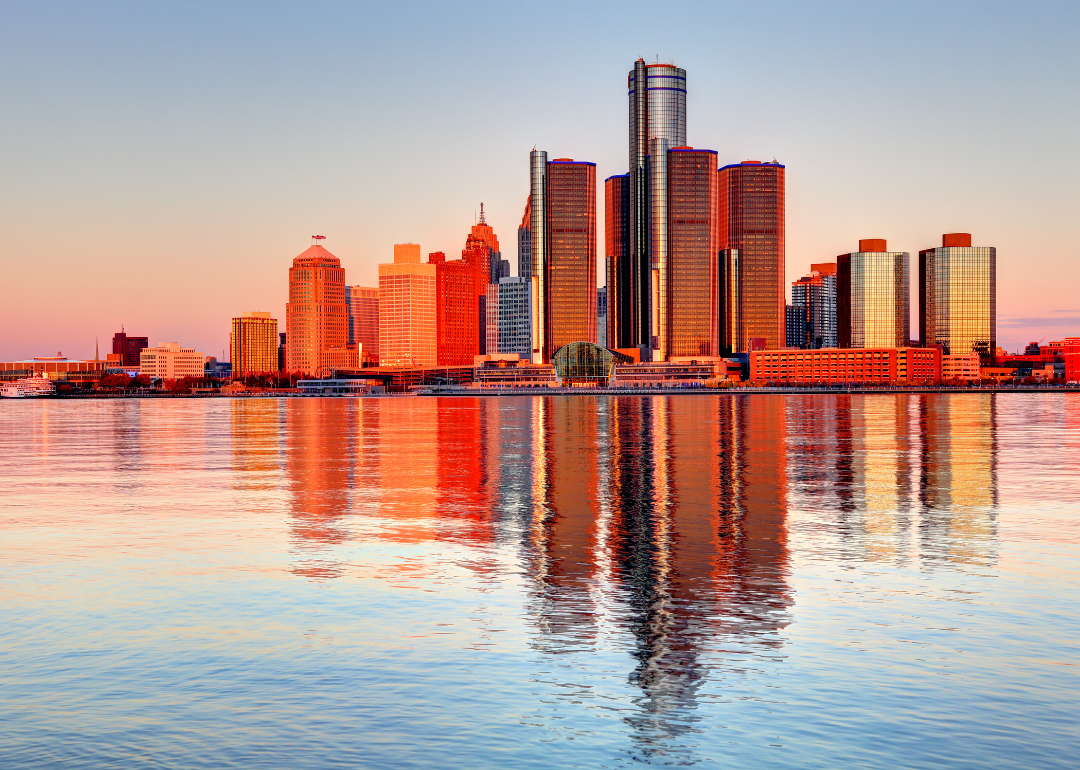
#13. Detroit
Detroit as viewed from the water.
– Share of first-time buyers: 44.4%
Canva
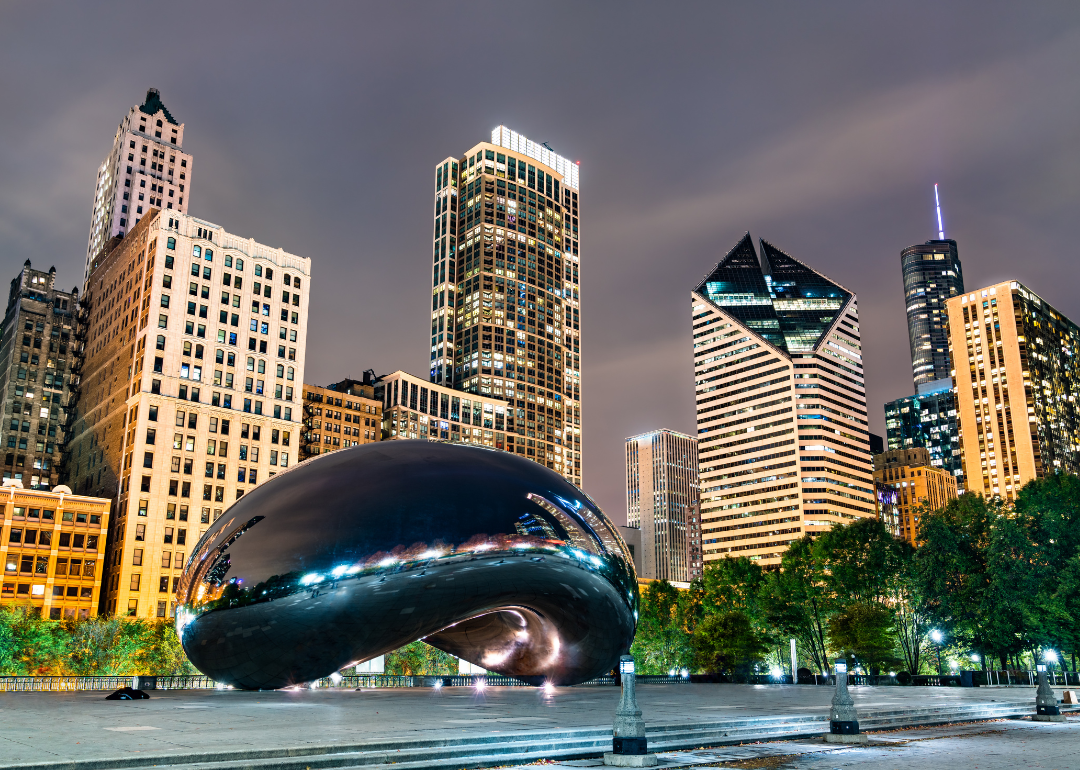
#12. Chicago
Cloud Gate, Millennium Park in Chicago, Illinois.
– Share of first-time buyers: 44.7%
Canva
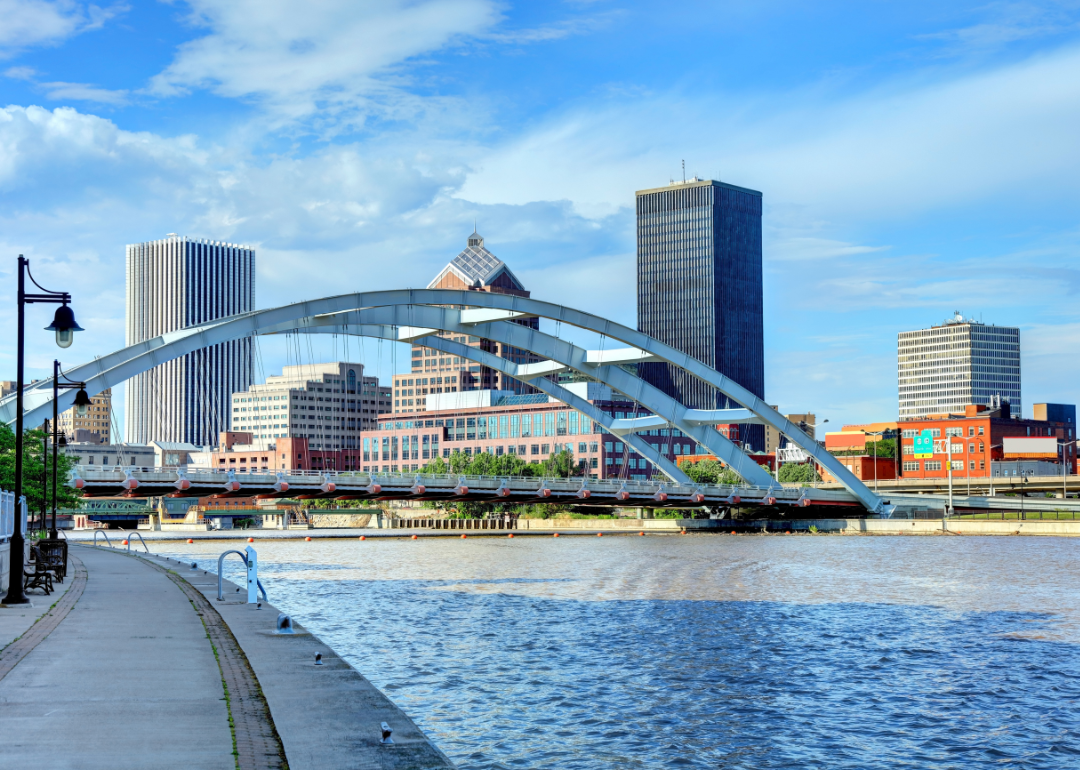
#11. Rochester, New York
The skyline of Rochester, New York.
– Share of first-time buyers: 44.9%
Canva
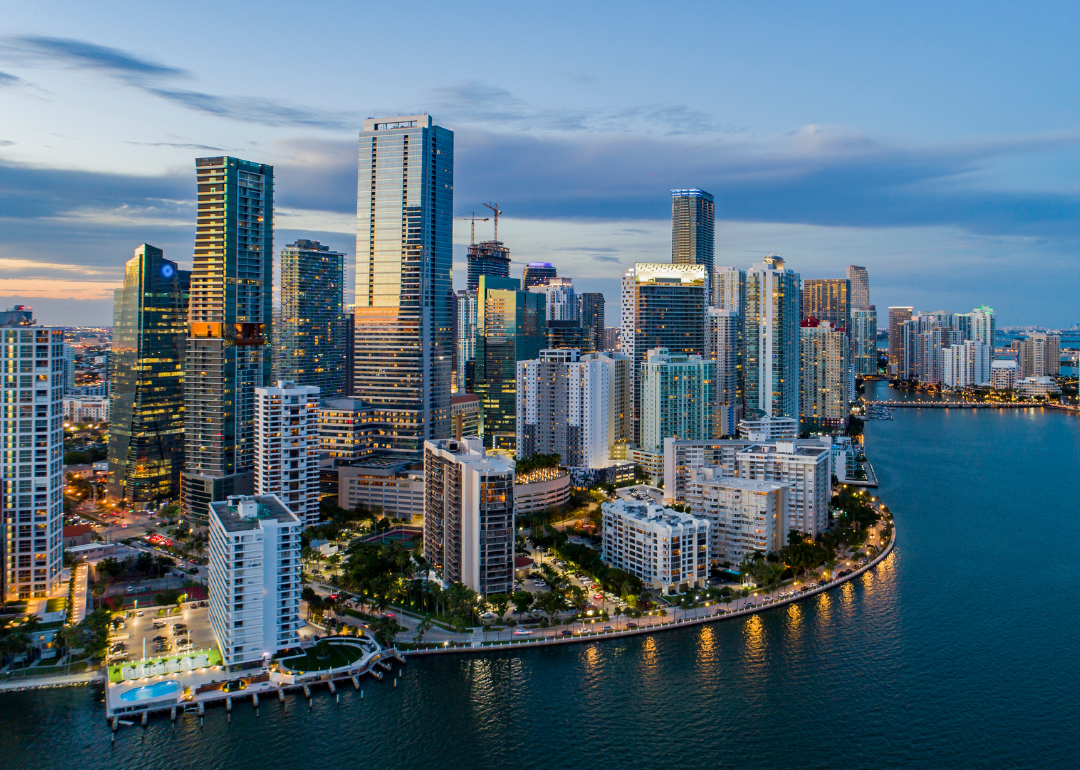
#10. Miami
Downtown Miami, Florida, at night.
– Share of first-time buyers: 45.3%
Canva
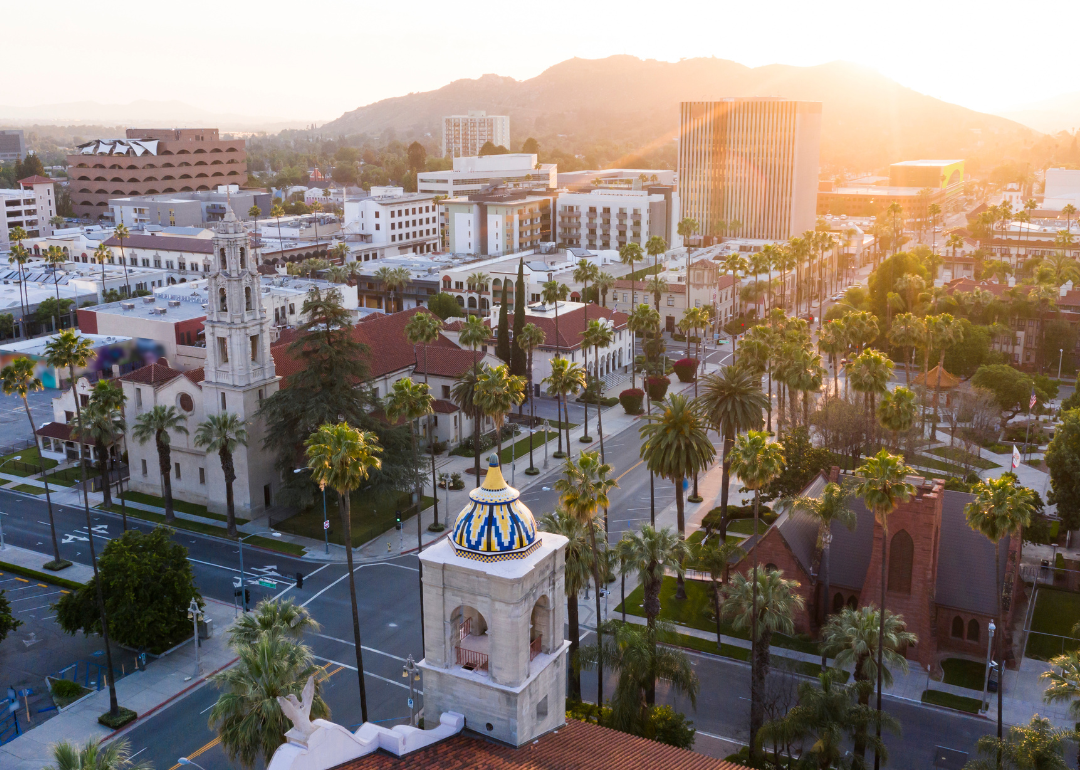
#9. Riverside, California
An aerial view of Riverside, California.
– Share of first-time buyers: 45.7%

Canva
#8. Philadelphia
The downtown skyline of Philadelphia.
– Share of first-time buyers: 47.7%
Canva
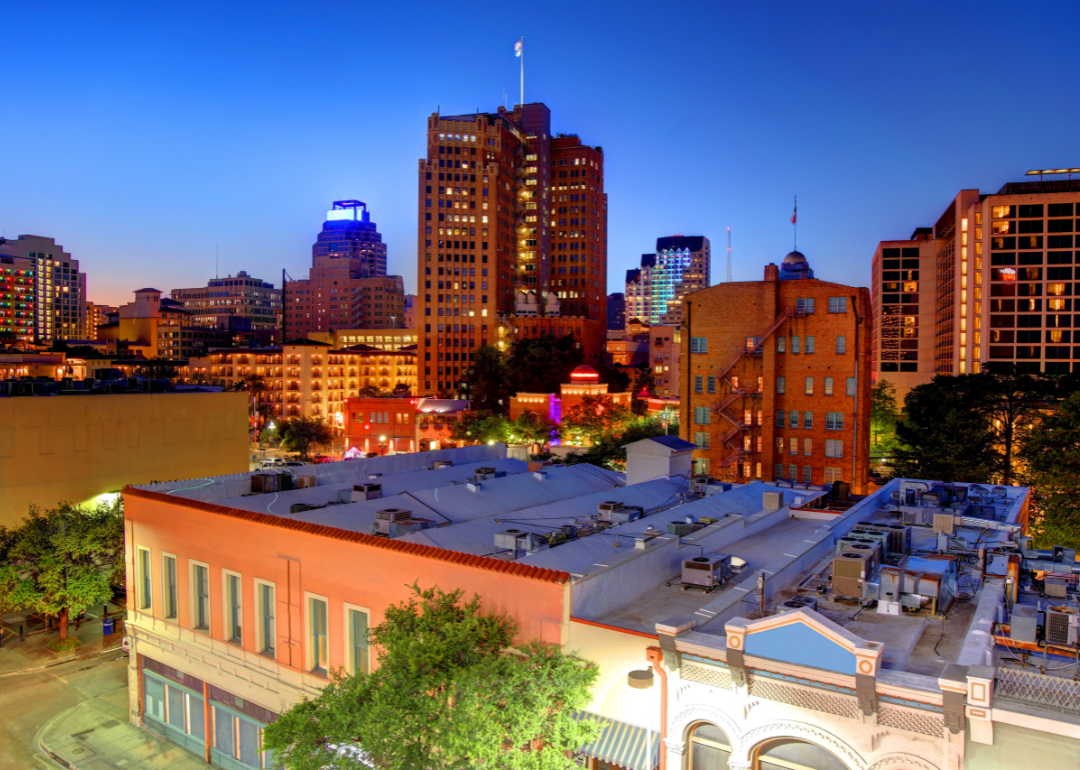
#7. San Antonio
San Antonio, Texas, at night.
– Share of first-time buyers: 47.7%
Canva
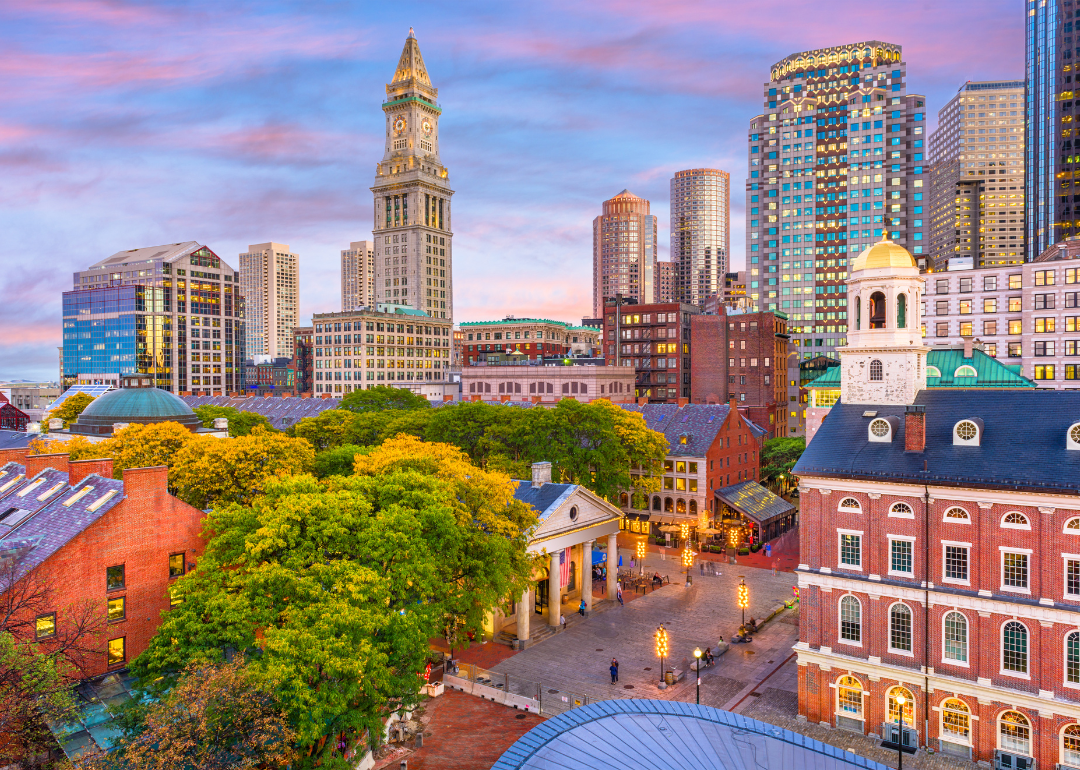
#6. Boston
Boston, Massachusetts.
– Share of first-time buyers: 47.9%
Canva
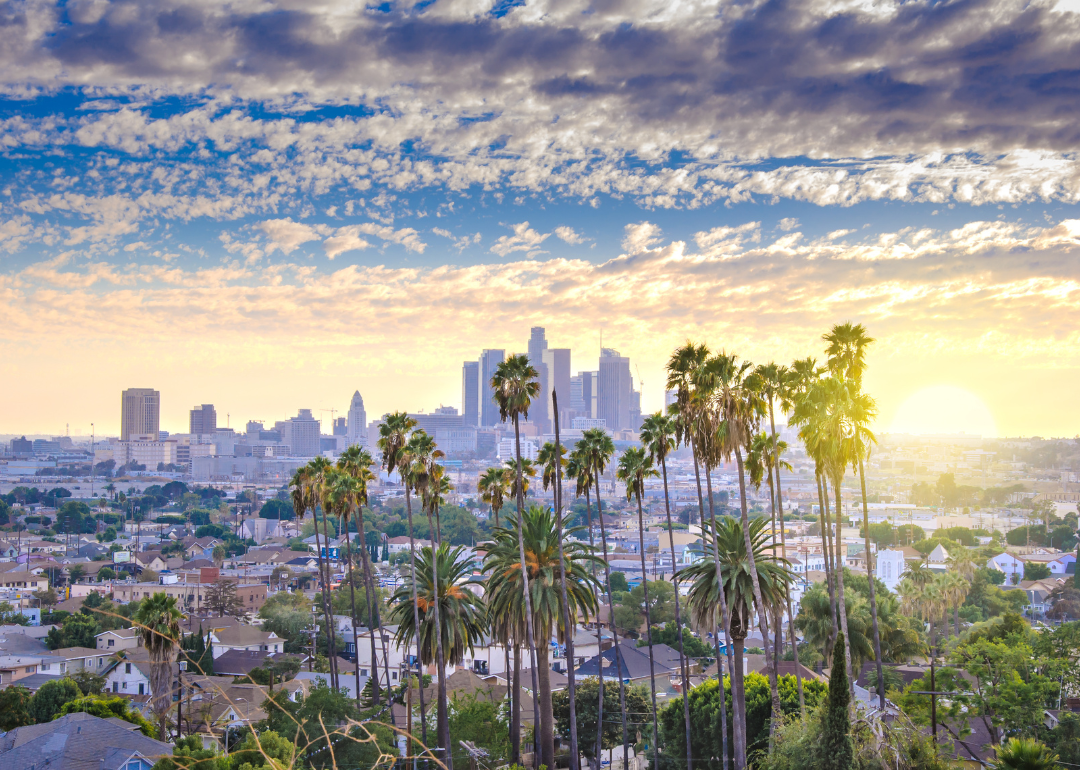
#5. Los Angeles
Downtown Los Angeles as viewed from a distance.
– Share of first-time buyers: 48.0%

Canva
#4. Houston
The skyline in Houston, Texas.
– Share of first-time buyers: 48.8%
Canva
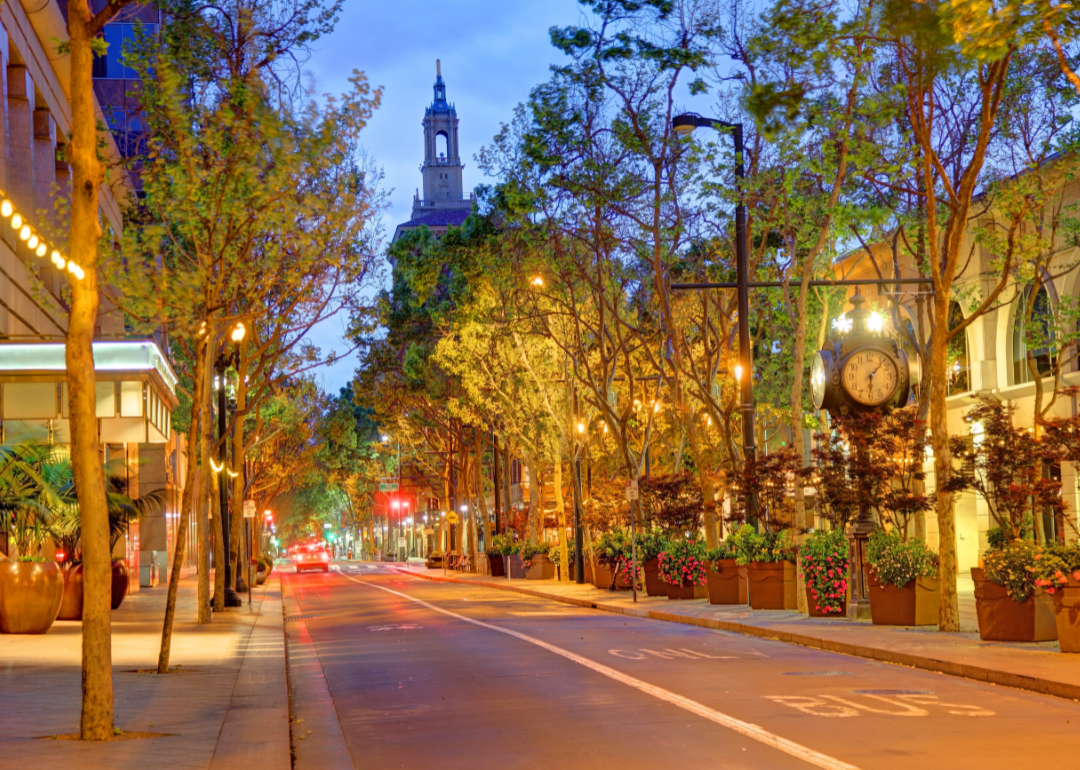
#3. San Jose, California
A street view in San Jose, California.
– Share of first-time buyers: 51.3%
Canva
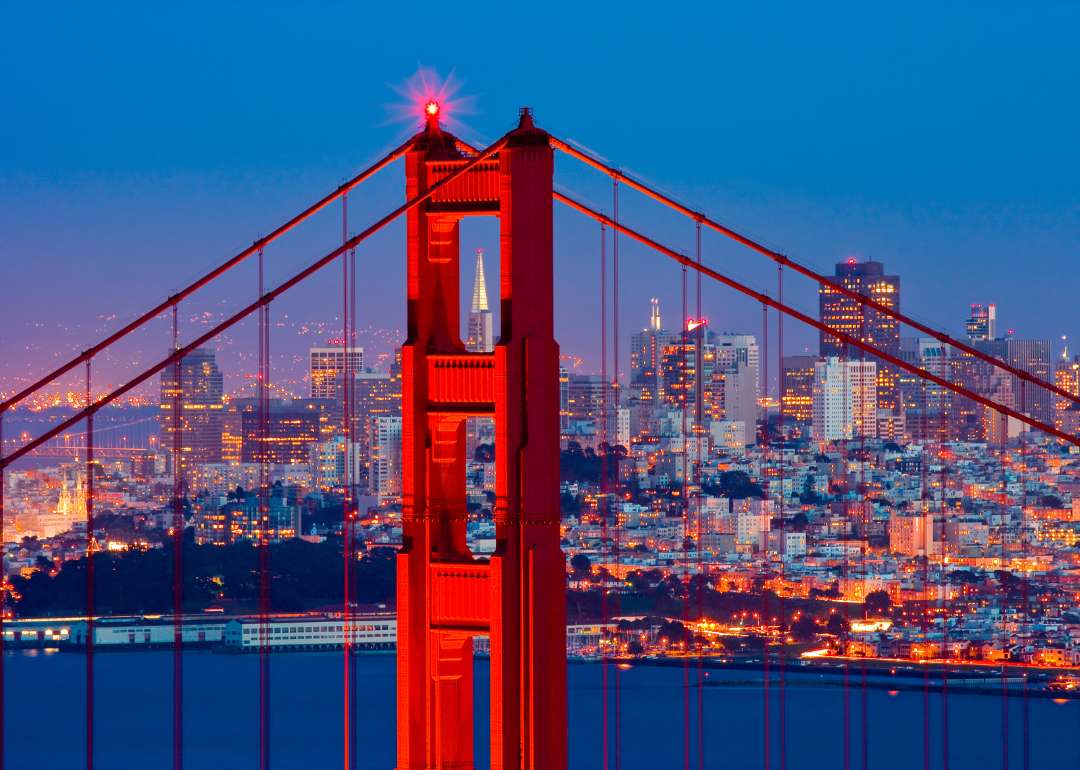
#2. San Francisco
San Francisco with the Golden Gate Bridge in hte foreground.
– Share of first-time buyers: 52.6%
Canva
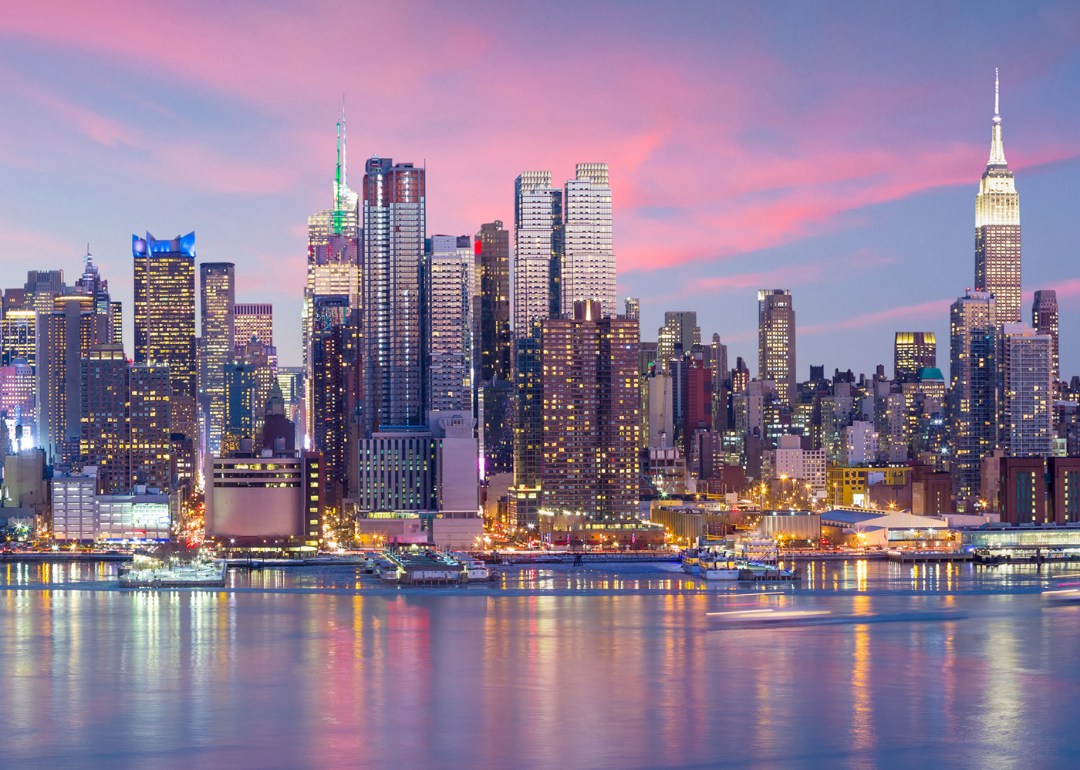
#1. New York, New York
The New York City skyline.
– Share of first-time buyers: 54.4%
This story originally appeared on Texas Real Estate Source and was produced and
distributed in partnership with Stacker Studio.
