Counties in Oregon where people spend most of their paycheck on housing

Stuart Seeger // Wikicommons
It’s no secret that many Americans are forgoing homeownership in favor of renting. In 2020, renters in the U.S. occupied 43 million housing units.
The Stacker team looked at data from a United States Census survey that revealed an estimated 43,378,800 renter-occupied homes in the United States as of 2017, which makes up 36.1% of all households in the country. In 2019, renting was more affordable than buying a median-priced home in 59% of the counties; in 2021, the opposite was true: Owning was more affordable than renting in 63% of U.S. counties.
Stacker compiled a list of counties in Oregon where people spend the highest percent of income on rent using data from the U.S. Census Bureau. Of course, saving money by owning a home is unattainable for many Americans who don’t have savings that could cover a down payment, those who are denied a mortgage, or both. Keep reading to see where in your home state most of people’s take-home pay goes to their monthly rent.
You may also like: Most popular boy names in the 60s in Oregon

Finetooth // Wikimedia Commons
– Median percent of income spent on housing: 16.4%
— Percent of households spending <20% of income on housing: 50.8%
— Percent of households spending >30% of income on housing: 23.9%
– Total occupied households: 748
– Median household income: $51,071
– Median monthly housing cost: $696

Sam Beebe // Wikimedia Commons
– Median percent of income spent on housing: 16.8%
— Percent of households spending <20% of income on housing: 48.4%
— Percent of households spending >30% of income on housing: 27.7%
– Total occupied households: 3,214
– Median household income: $51,224
– Median monthly housing cost: $719

Ken Lund // Wikimedia Commons
– Median percent of income spent on housing: 17.0%
— Percent of households spending <20% of income on housing: 51.2%
— Percent of households spending >30% of income on housing: 23.1%
– Total occupied households: 3,244
– Median household income: $40,735
– Median monthly housing cost: $576

Tomas Nevesely // Shutterstock
– Median percent of income spent on housing: 17.5%
— Percent of households spending <20% of income on housing: 39.2%
— Percent of households spending >30% of income on housing: 28.9%
– Total occupied households: 640
– Median household income: $40,926
– Median monthly housing cost: $597
Finetooth // Wikimedia Commons
– Median percent of income spent on housing: 17.8%
— Percent of households spending <20% of income on housing: 51.6%
— Percent of households spending >30% of income on housing: 26.3%
– Total occupied households: 6,921
– Median household income: $45,998
– Median monthly housing cost: $681
You may also like: Fastest-growing counties in Oregon

Finetooth // Wikimedia Commons
– Median percent of income spent on housing: 18.0%
— Percent of households spending <20% of income on housing: 48.0%
— Percent of households spending >30% of income on housing: 29.3%
– Total occupied households: 3,381
– Median household income: $44,712
– Median monthly housing cost: $671

Finetooth // Wikimedia Commons
– Median percent of income spent on housing: 18.0%
— Percent of households spending <20% of income on housing: 54.9%
— Percent of households spending >30% of income on housing: 22.1%
– Total occupied households: 4,108
– Median household income: $54,269
– Median monthly housing cost: $815

Gancayco // Wikimedia Commons
– Median percent of income spent on housing: 18.5%
— Percent of households spending <20% of income on housing: 49.5%
— Percent of households spending >30% of income on housing: 26.6%
– Total occupied households: 26,908
– Median household income: $54,699
– Median monthly housing cost: $843

Williamborg // Wikimedia Commons
– Median percent of income spent on housing: 19.0%
— Percent of households spending <20% of income on housing: 48.6%
— Percent of households spending >30% of income on housing: 27.1%
– Total occupied households: 10,708
– Median household income: $52,171
– Median monthly housing cost: $828

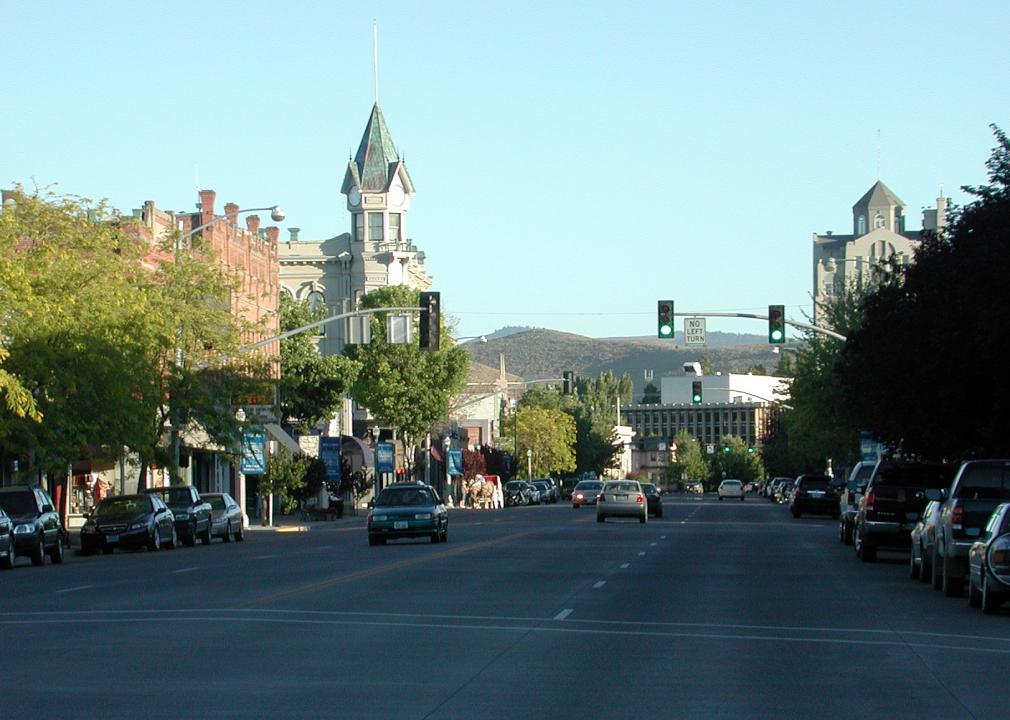
Ken Lund from Reno, Nevada, USA // Wikimedia Commons
– Median percent of income spent on housing: 19.2%
— Percent of households spending <20% of income on housing: 45.4%
— Percent of households spending >30% of income on housing: 28.1%
– Total occupied households: 10,062
– Median household income: $43,313
– Median monthly housing cost: $694
You may also like: Counties with the oldest homes in Oregon

Sam Beebe // Wikimedia Commons
– Median percent of income spent on housing: 19.3%
— Percent of households spending <20% of income on housing: 48.6%
— Percent of households spending >30% of income on housing: 25.0%
– Total occupied households: 8,600
– Median household income: $65,679
– Median monthly housing cost: $1,059
Finetooth // Wikimedia Commons
– Median percent of income spent on housing: 20.0%
— Percent of households spending <20% of income on housing: 48.1%
— Percent of households spending >30% of income on housing: 29.8%
– Total occupied households: 8,094
– Median household income: $53,277
– Median monthly housing cost: $886

Cacophony // Wikimedia Commons
– Median percent of income spent on housing: 20.0%
— Percent of households spending <20% of income on housing: 46.1%
— Percent of households spending >30% of income on housing: 26.2%
– Total occupied households: 10,305
– Median household income: $53,105
– Median monthly housing cost: $887
Bobjgalindo // Wikimedia Commons
– Median percent of income spent on housing: 20.2%
— Percent of households spending <20% of income on housing: 47.0%
— Percent of households spending >30% of income on housing: 29.1%
– Total occupied households: 27,886
– Median household income: $46,491
– Median monthly housing cost: $782

Manuela Durson // Shutterstock
– Median percent of income spent on housing: 20.3%
— Percent of households spending <20% of income on housing: 45.2%
— Percent of households spending >30% of income on housing: 31.2%
– Total occupied households: 10,546
– Median household income: $48,440
– Median monthly housing cost: $818
You may also like: Most popular girl names in the 70s in Oregon

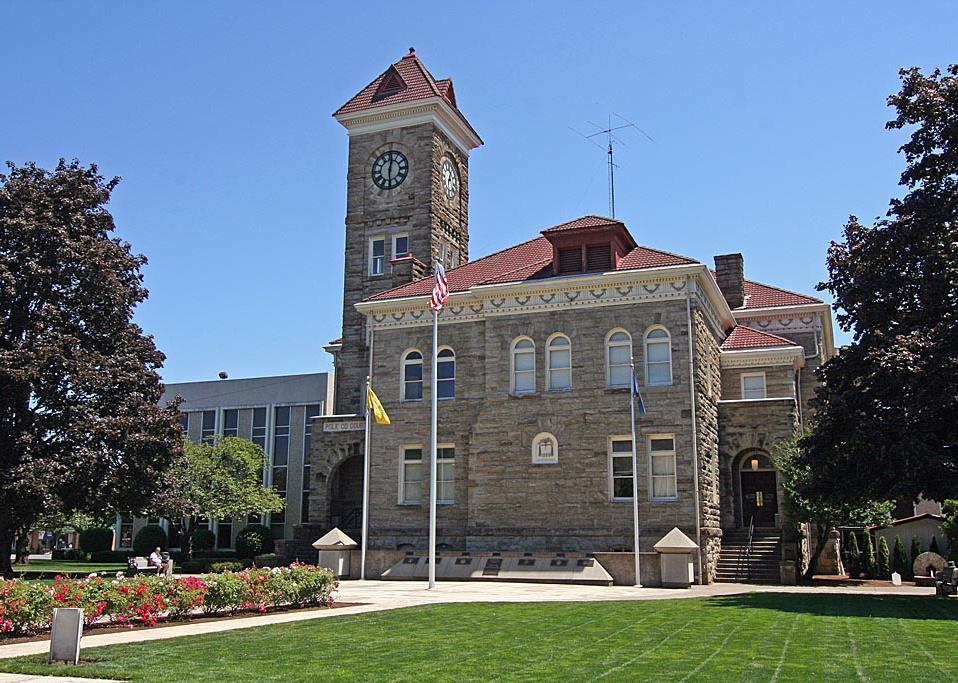
Tedder // Wikimedia Commons
– Median percent of income spent on housing: 20.6%
— Percent of households spending <20% of income on housing: 44.7%
— Percent of households spending >30% of income on housing: 23.4%
– Total occupied households: 842
– Median household income: $47,500
– Median monthly housing cost: $814
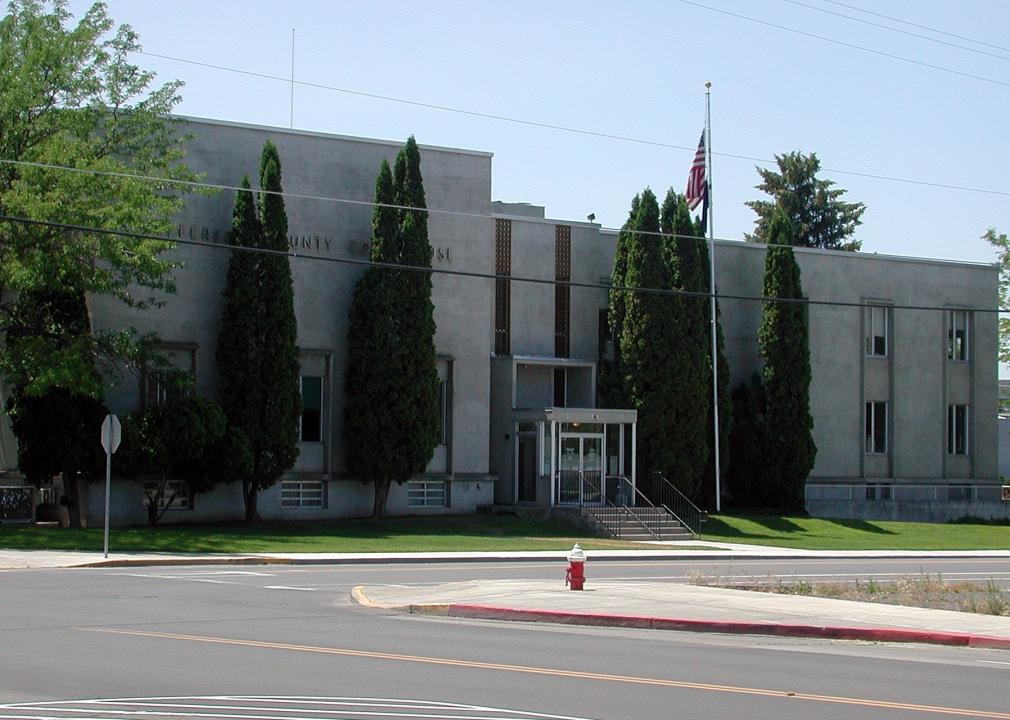
English: Gary Halvorson, Oregon State Archives // Wikimedia Commons
– Median percent of income spent on housing: 20.9%
— Percent of households spending <20% of income on housing: 46.1%
— Percent of households spending >30% of income on housing: 29.1%
– Total occupied households: 45,456
– Median household income: $47,267
– Median monthly housing cost: $824
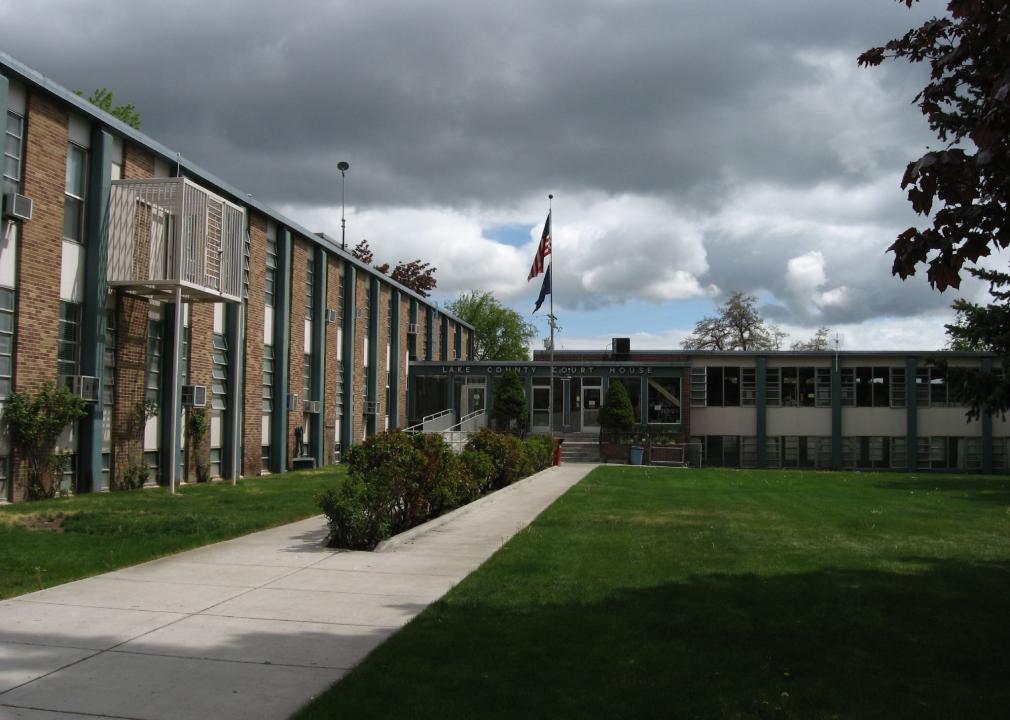
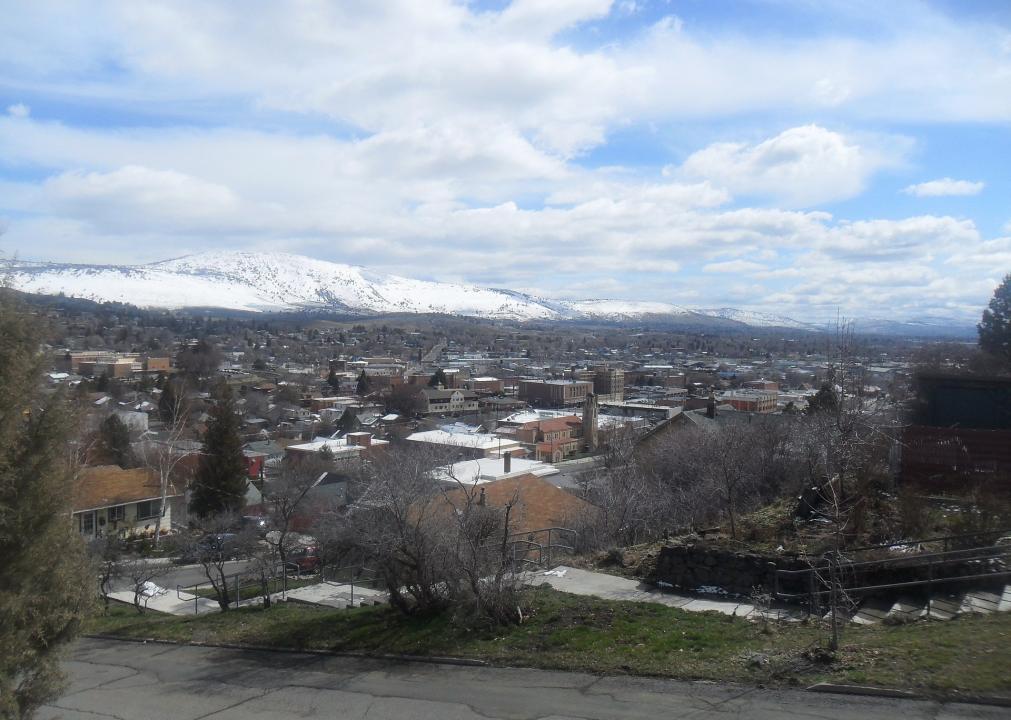
Ken Lund // Wikimedia Commons
– Median percent of income spent on housing: 21.2%
— Percent of households spending <20% of income on housing: 48.0%
— Percent of households spending >30% of income on housing: 29.1%
– Total occupied households: 3,515
– Median household income: $37,898
– Median monthly housing cost: $670
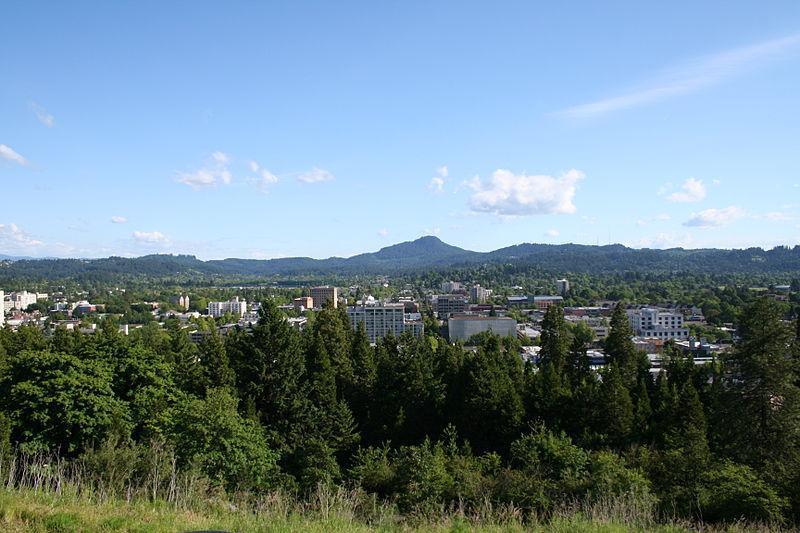
Bruce Fingerhood from Springfield, Oregon, US // Wikimedia Commons
– Median percent of income spent on housing: 21.2%
— Percent of households spending <20% of income on housing: 42.1%
— Percent of households spending >30% of income on housing: 30.5%
– Total occupied households: 30,305
– Median household income: $62,691
– Median monthly housing cost: $1,109

Cacophony // Wikimedia Commons
– Median percent of income spent on housing: 21.3%
— Percent of households spending <20% of income on housing: 45.1%
— Percent of households spending >30% of income on housing: 30.0%
– Total occupied households: 19,671
– Median household income: $62,257
– Median monthly housing cost: $1,104
You may also like: Highest-rated Class of 2021 football recruits from Oregon

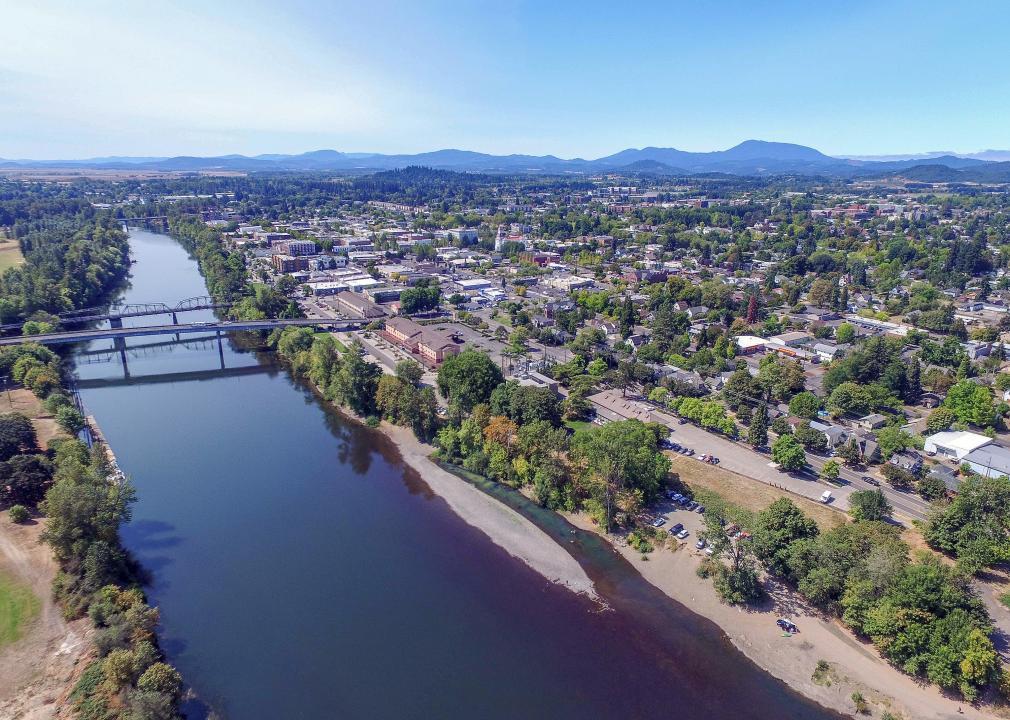
Edmund Garman // Flickr
– Median percent of income spent on housing: 21.9%
— Percent of households spending <20% of income on housing: 41.1%
— Percent of households spending >30% of income on housing: 33.2%
– Total occupied households: 118,038
– Median household income: $59,625
– Median monthly housing cost: $1,086

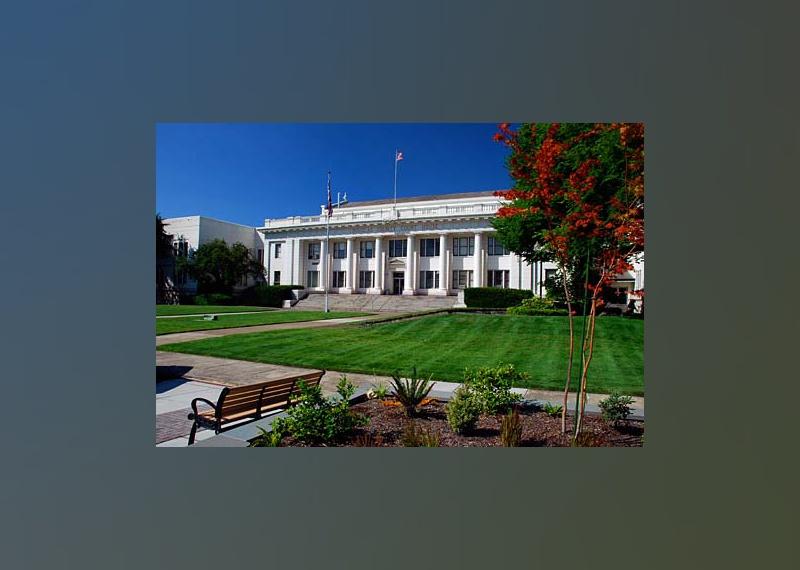
English: Gary Halvorson, Oregon State Archives // Wikimedia Commons
– Median percent of income spent on housing: 21.9%
— Percent of households spending <20% of income on housing: 43.7%
— Percent of households spending >30% of income on housing: 30.5%
– Total occupied households: 15,800
– Median household income: $54,886
– Median monthly housing cost: $1,001
cpaulfell // Shutterstock
– Median percent of income spent on housing: 21.9%
— Percent of households spending <20% of income on housing: 41.6%
— Percent of households spending >30% of income on housing: 34.5%
– Total occupied households: 35,718
– Median household income: $62,077
– Median monthly housing cost: $1,134

Debbie Tegtmeier // Wikimedia Commons
– Median percent of income spent on housing: 22.0%
— Percent of households spending <20% of income on housing: 43.0%
— Percent of households spending >30% of income on housing: 31.8%
– Total occupied households: 27,025
– Median household income: $45,051
– Median monthly housing cost: $826

Mrgadget51 // Wikimedia Commons
– Median percent of income spent on housing: 22.0%
— Percent of households spending <20% of income on housing: 42.1%
— Percent of households spending >30% of income on housing: 31.6%
– Total occupied households: 157,408
– Median household income: $80,484
– Median monthly housing cost: $1,477
You may also like: Highest-rated specialty museums in Oregon, according to Tripadvisor

M.O. Stevens // Wikimedia Commons
– Median percent of income spent on housing: 22.0%
— Percent of households spending <20% of income on housing: 41.3%
— Percent of households spending >30% of income on housing: 31.6%
– Total occupied households: 219,053
– Median household income: $82,215
– Median monthly housing cost: $1,509

Jmabel // Wikimedia Commons
– Median percent of income spent on housing: 22.1%
— Percent of households spending <20% of income on housing: 41.5%
— Percent of households spending >30% of income on housing: 32.6%
– Total occupied households: 47,762
– Median household income: $55,893
– Median monthly housing cost: $1,028

Cacophony // Wikimedia Commons
– Median percent of income spent on housing: 22.3%
— Percent of households spending <20% of income on housing: 40.7%
— Percent of households spending >30% of income on housing: 31.8%
– Total occupied households: 9,588
– Median household income: $49,006
– Median monthly housing cost: $911

USFWS Headquarters’ photostream // Wikimedia Commons
– Median percent of income spent on housing: 22.3%
— Percent of households spending <20% of income on housing: 45.9%
— Percent of households spending >30% of income on housing: 31.0%
– Total occupied households: 10,784
– Median household income: $49,895
– Median monthly housing cost: $928

EncMstr // Wikimedia Commons
– Median percent of income spent on housing: 22.8%
— Percent of households spending <20% of income on housing: 40.3%
— Percent of households spending >30% of income on housing: 35.0%
– Total occupied households: 21,298
– Median household income: $47,882
– Median monthly housing cost: $910
You may also like: Biggest sources of immigrants to Oregon

M.O. Stevens // Wikimedia Commons
– Median percent of income spent on housing: 23.0%
— Percent of households spending <20% of income on housing: 40.5%
— Percent of households spending >30% of income on housing: 33.6%
– Total occupied households: 36,808
– Median household income: $63,902
– Median monthly housing cost: $1,223

Ian Poellet // Wikimedia Commons
– Median percent of income spent on housing: 23.1%
— Percent of households spending <20% of income on housing: 40.3%
— Percent of households spending >30% of income on housing: 34.1%
– Total occupied households: 74,397
– Median household income: $67,043
– Median monthly housing cost: $1,289

Little Mountain 5 // Wikicommons
– Median percent of income spent on housing: 23.3%
— Percent of households spending <20% of income on housing: 38.6%
— Percent of households spending >30% of income on housing: 36.7%
– Total occupied households: 88,241
– Median household income: $53,412
– Median monthly housing cost: $1,038

Joseph Novak // Wikicommons
– Median percent of income spent on housing: 24.0%
— Percent of households spending <20% of income on housing: 39.6%
— Percent of households spending >30% of income on housing: 37.2%
– Total occupied households: 36,367
– Median household income: $45,616
– Median monthly housing cost: $913
Lauram12345 // Wikicommons
– Median percent of income spent on housing: 24.3%
— Percent of households spending <20% of income on housing: 37.1%
— Percent of households spending >30% of income on housing: 36.8%
– Total occupied households: 152,312
– Median household income: $52,426
– Median monthly housing cost: $1,060
You may also like: States sending the most people to Oregon

Stuart Seeger // Wikicommons
– Median percent of income spent on housing: 24.3%
— Percent of households spending <20% of income on housing: 36.5%
— Percent of households spending >30% of income on housing: 36.8%
– Total occupied households: 326,229
– Median household income: $69,176
– Median monthly housing cost: $1,403
