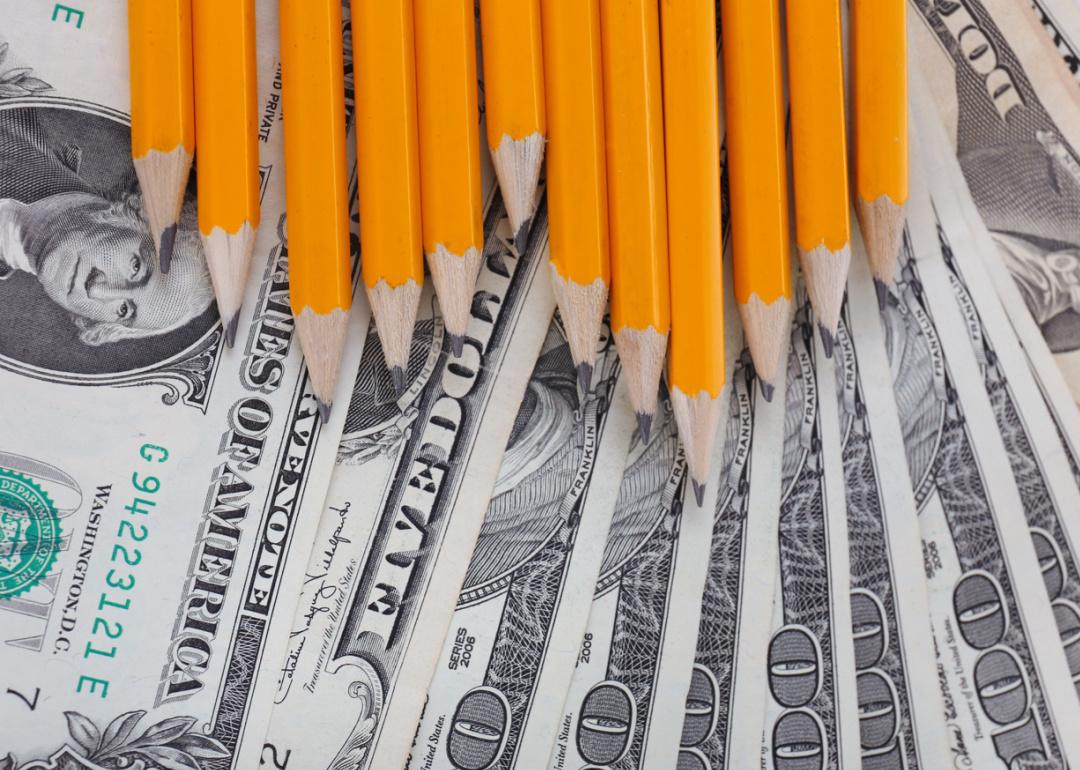
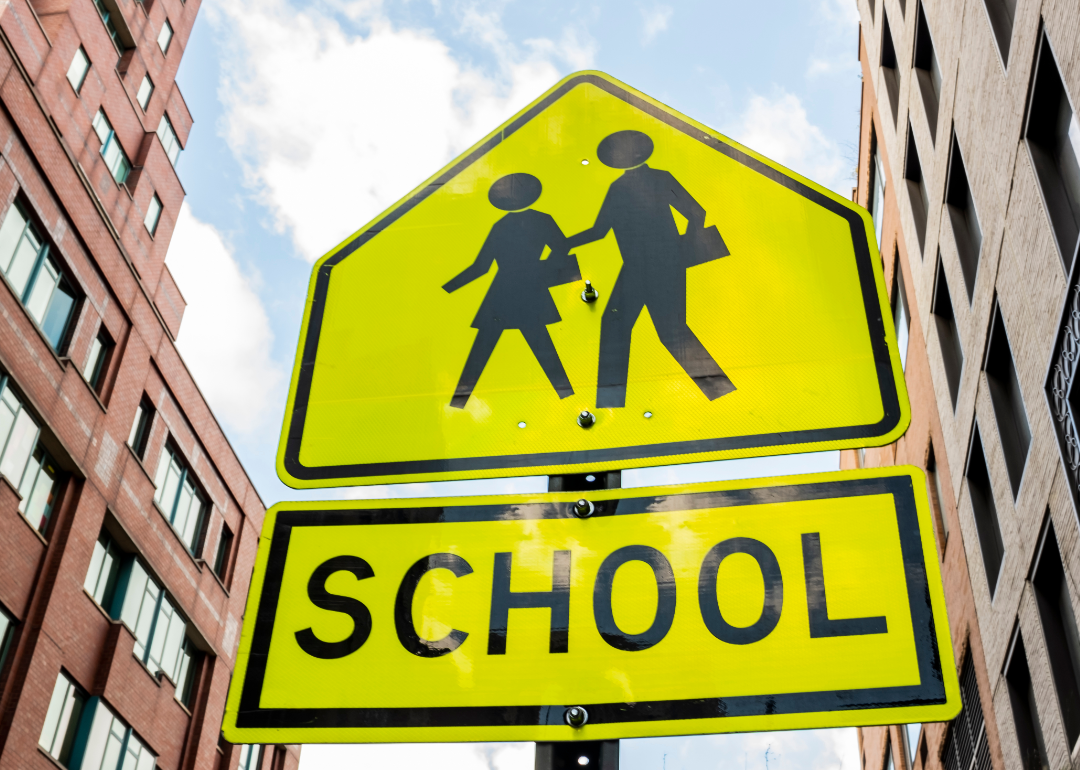
How spending on public education in every state has changed—and where the money comes from
Africa Studio // Shutterstock
How spending on public education in every state has changed—and where the money comes from
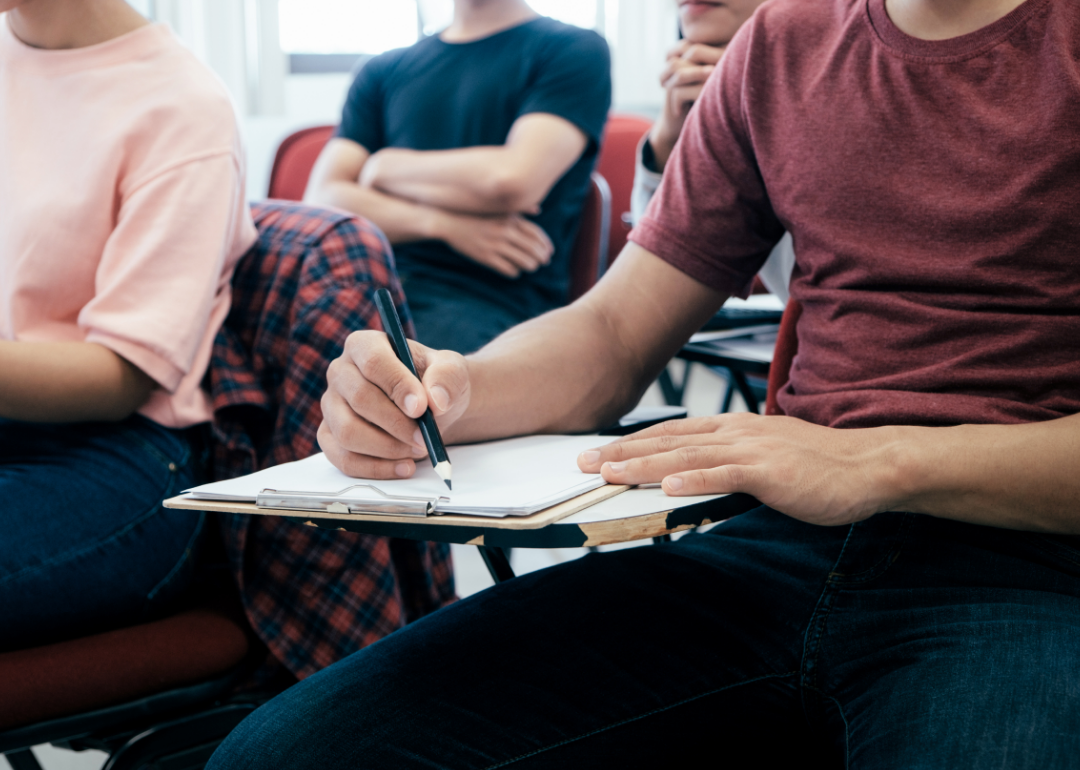
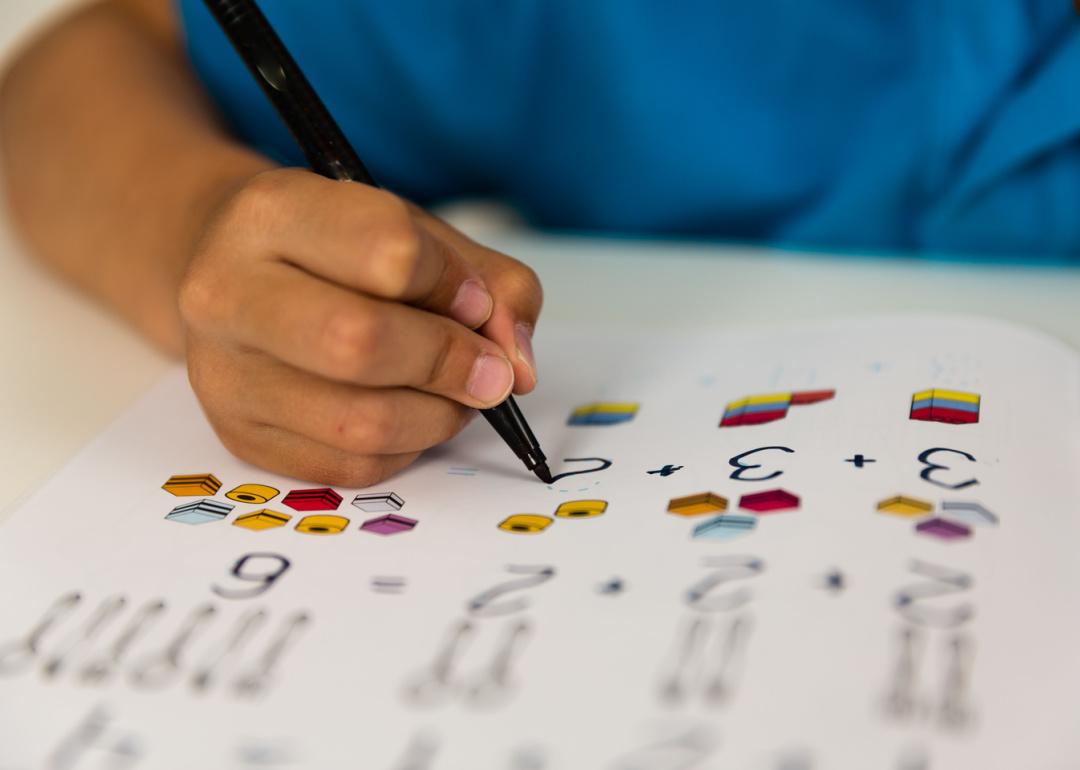
American currency and sharpened pencils.
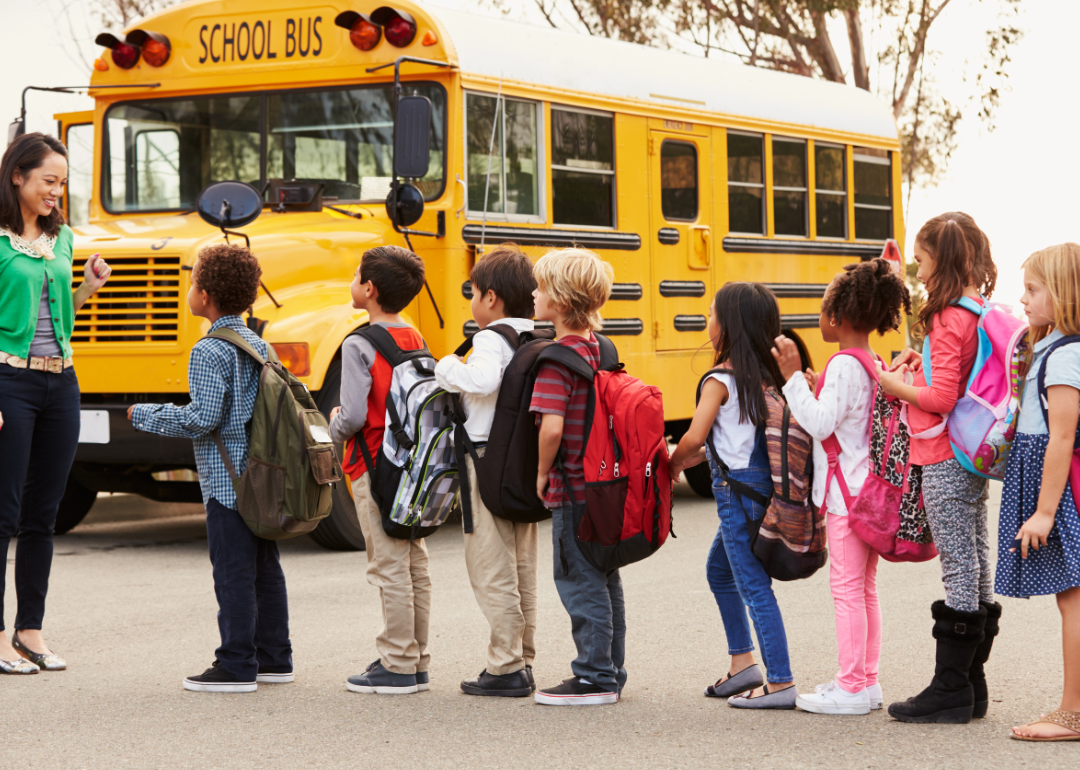
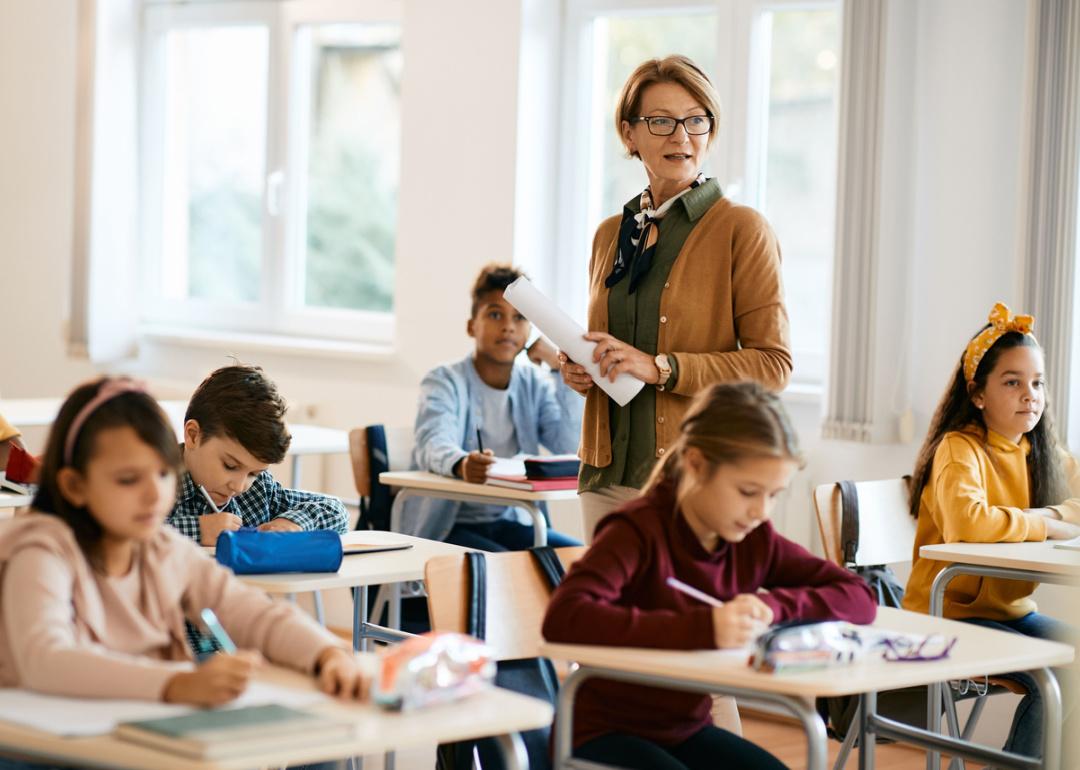
The COVID-19 pandemic has wreaked havoc on the U.S. public education system, diminishing enrollment by unprecedented numbers. As a growing contingent of parents have enrolled their kids in private or charter schools or turned to home-schooling, a key consequence has been less money for public schools and districts, as public school funding is determined by student population. This funding crunch has thrust the lives of many public school teachers, administrators, families, and students into crisis.
Lower student enrollment has also meant layoffs for teachers and other school staff, fewer resources and opportunities for kids, and even closing school entirely. Funding for public education comes from several sources: state and local funding streams, as well as federal revenues, which include assistance for special education programming, low-income student aid, vocational programs, and nutrition.
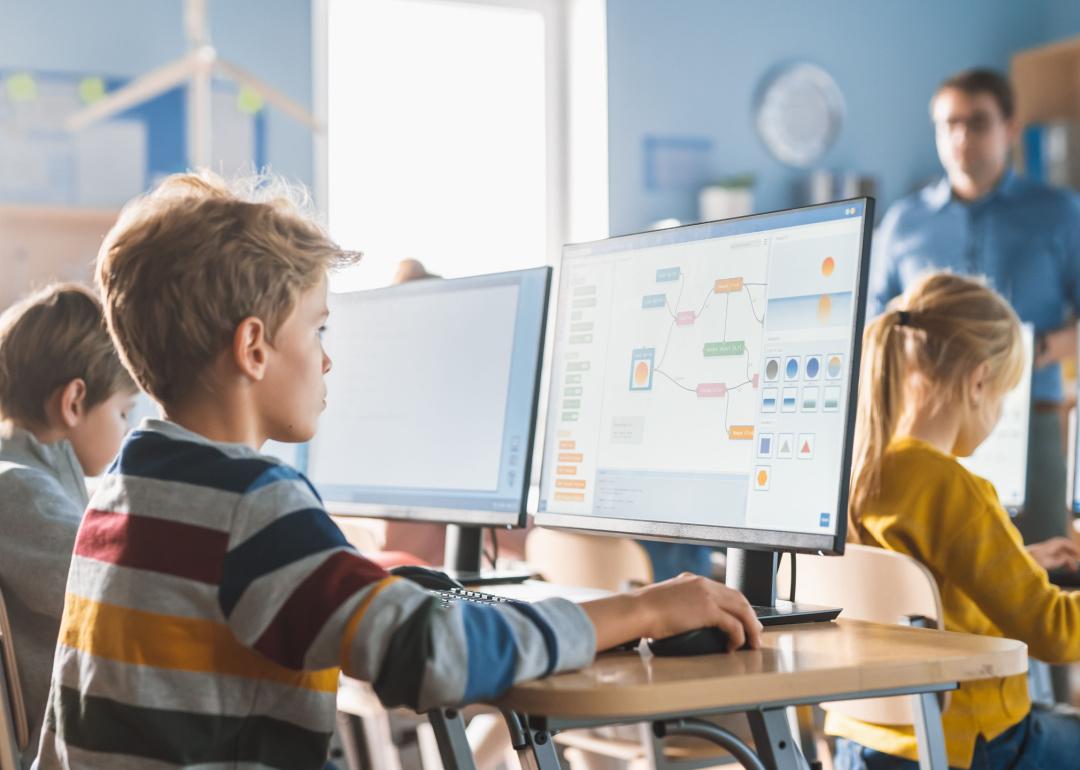
But between states, and even on the county and city level, spending on public education varies greatly, further driving inequities between students—educational, economic, and racial disparities that often persist into adulthood, limiting future opportunities.
While some states spend significantly more per student than others, the U.S. on average lags behind other developed countries in its public education spending. According to the Education Data Initiative, the average amount spent per pupil in the U.S. is $16,993, ranking seventh amongst the 37 other member countries of the Organisation for Economic Co-operation and Development. That figure drops to just over $13,000 per pupil for K-12 public schools. At that rate, the accumulated total expenditure for all K-12 schools in the U.S. equals just 3.4% of taxpayer income.
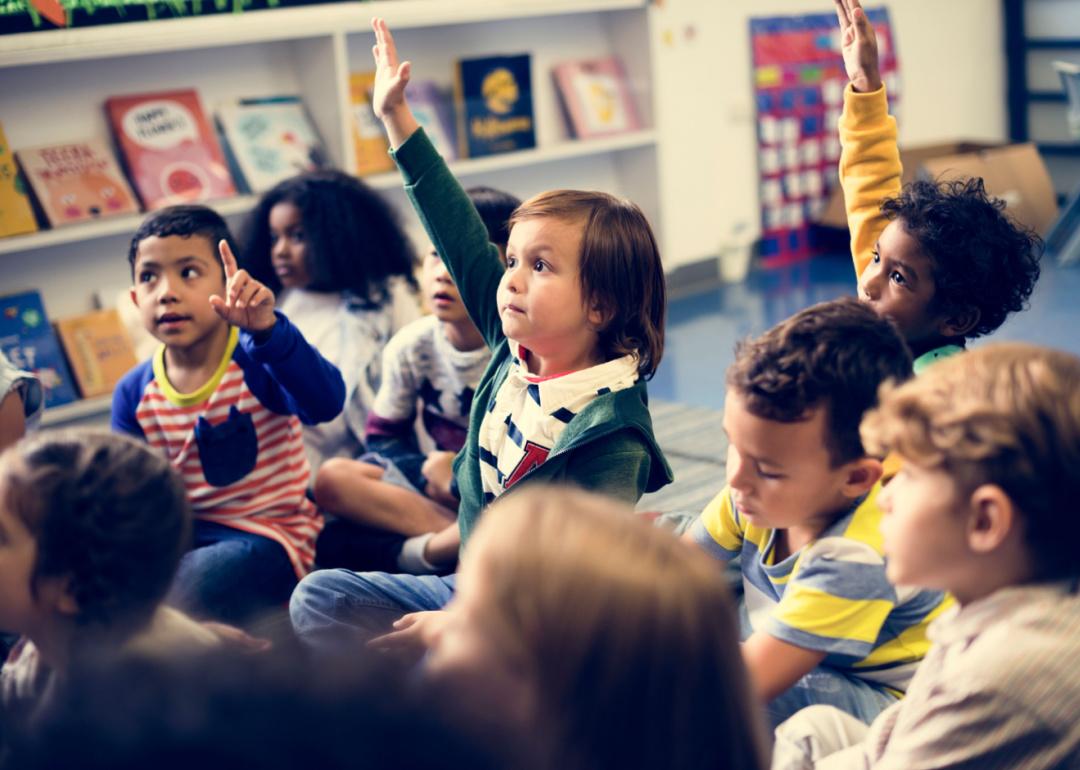
Historically, public education funding has taken major hits after recessions, as states slash education budgets in an effort to tighten their belts. However, the impact of the pandemic on public schools prompted the allocation of emergency federal spending under the Elementary and Secondary School Emergency Relief, or ESSER, funds, counteracting some of the effects of diminished state and local revenue streams. While helpful for the first year or two of the pandemic, studies have shown that the funding was ultimately not enough to negate the learning loss experienced by students.
In order to compare each state’s spending on public education, Best Universities used data from the Census Bureau’s Annual Survey of School Systems to rank states by their spending per pupil. States with no data available for the 2021 school year were ranked according to their 2020 data and are marked with an asterisk.
![]()
B Brown // Shutterstock
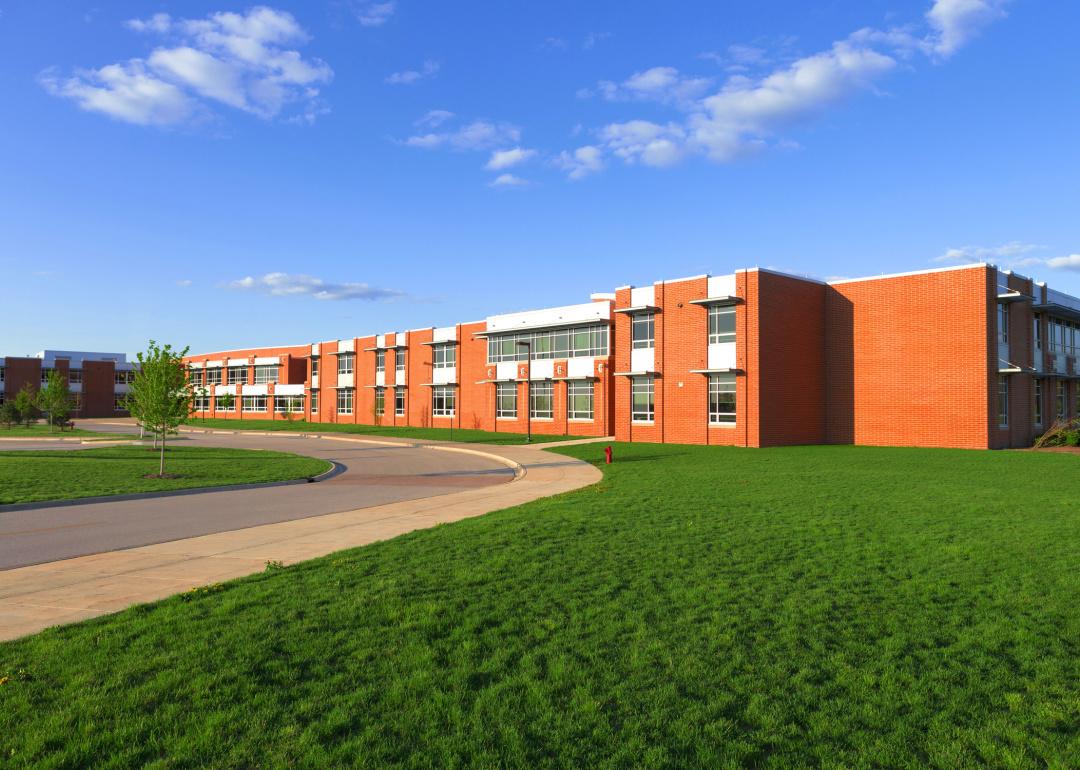
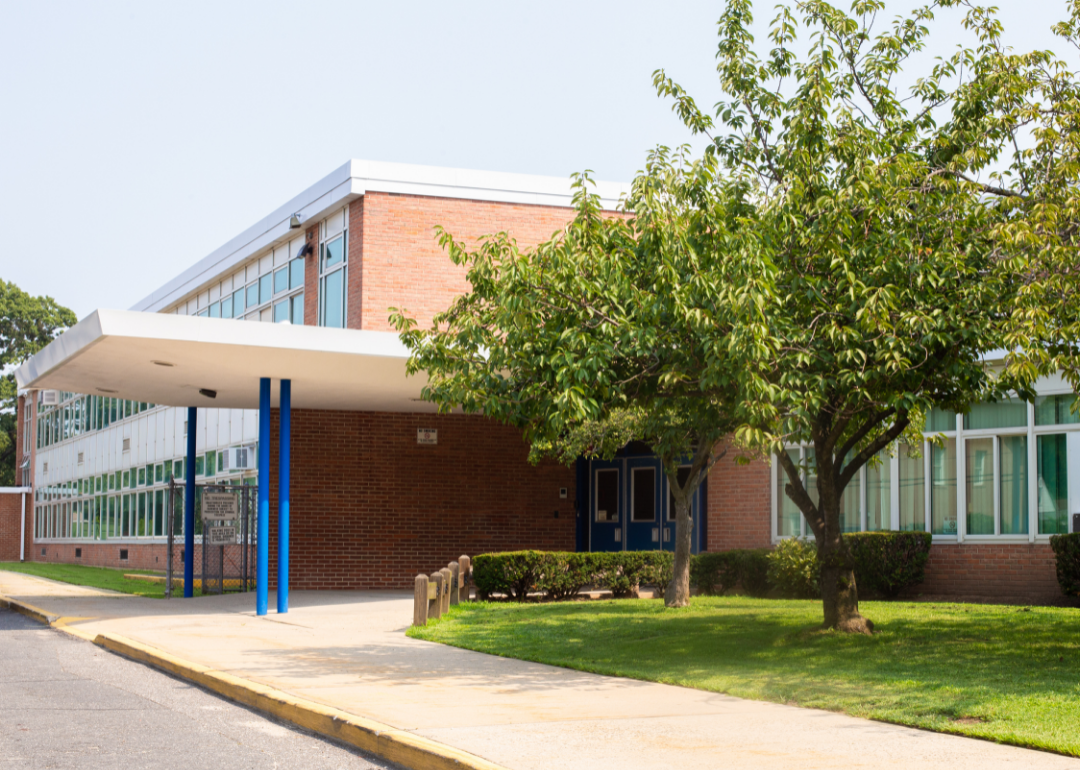
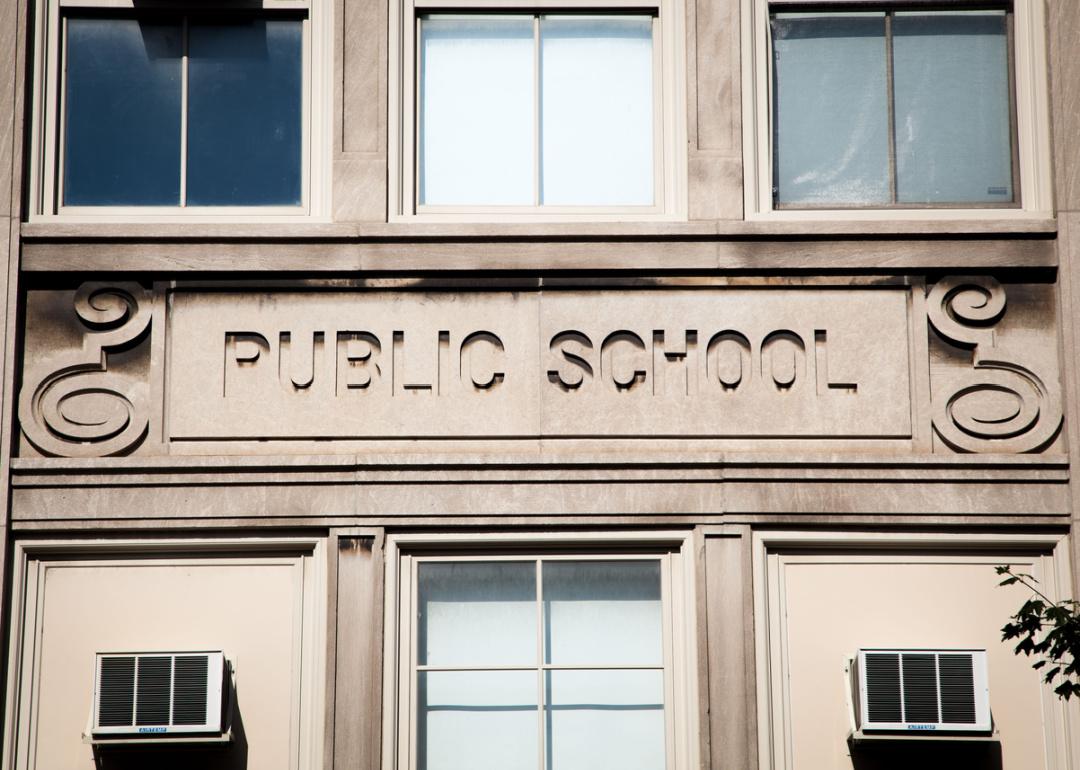
#51. Idaho
Exterior of public school building.
– Per pupil spending: $9,053 (26.5% increase from 2016)
– Total expenditures: $2.7 million
– Total revenue: $3.0 million
— Local sources: $706,358
— State sources: $1.8 million
— Federal sources: $472,735
Monkey Business Images // Shutterstock
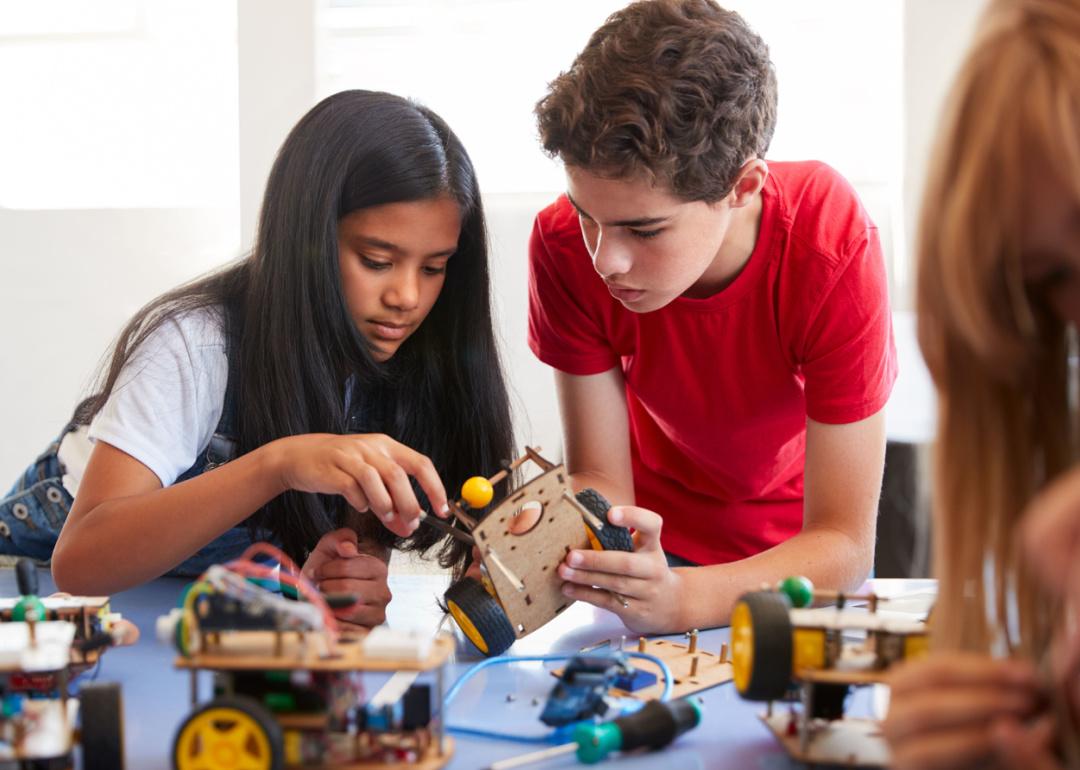
#50. Utah
Two female students building machine in science robotics class.
– Per pupil spending: $9,095 (30.8% increase from 2016)
– Total expenditures: $6.5 million
– Total revenue: $6.5 million
— Local sources: $2.5 million
— State sources: $3.3 million
— Federal sources: $636,977
Ellen McKnight // Shutterstock
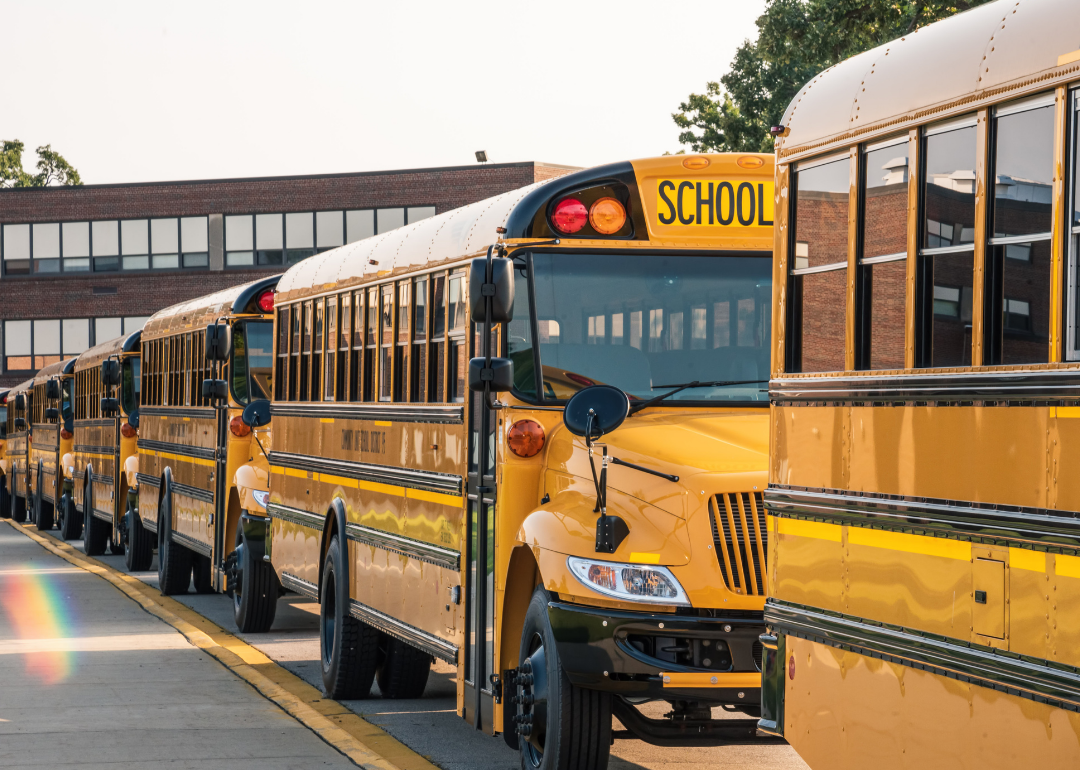
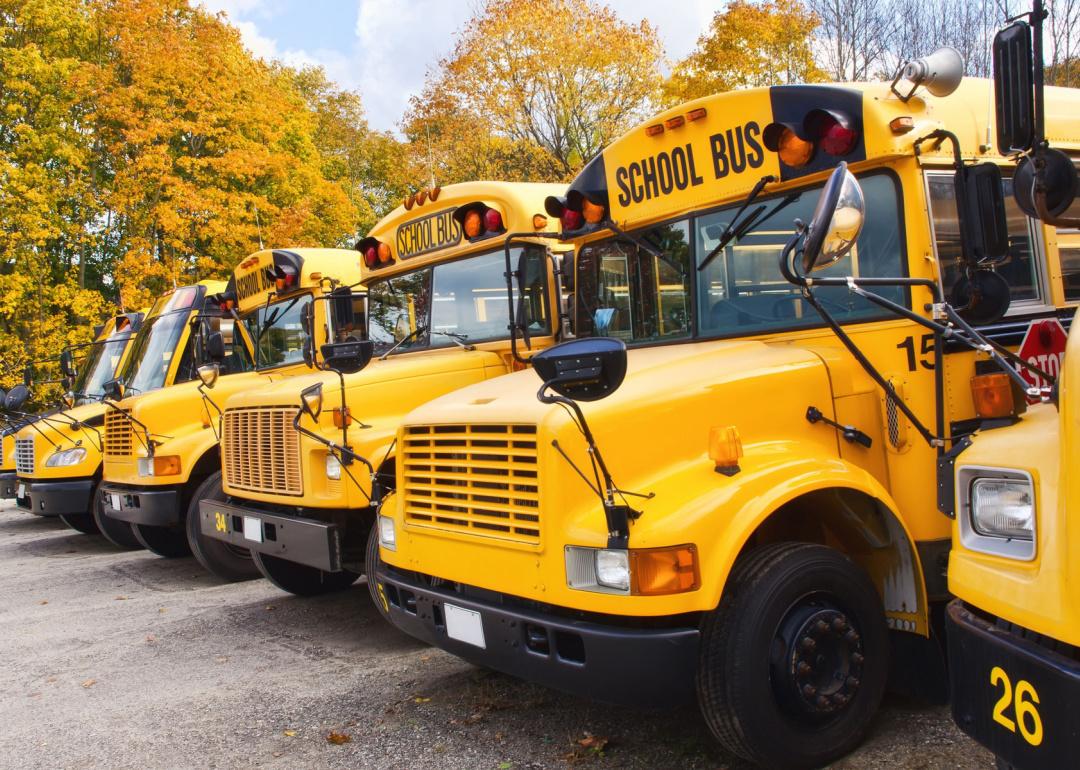
#49. Arizona
Group of school buses in parking lot.
– Per pupil spending: $9,605 (26.2% increase from 2016)
– Total expenditures: $10.3 million
– Total revenue: $10.5 million
— Local sources: $4.5 million
— State sources: $4.2 million
— Federal sources: $1.9 million
pyzata // Shutterstock
#48. Nevada*
Exterior public school building on clear day.
– Per pupil spending: $9,814 (9.5% increase from 2016)
– Total expenditures: $5.3 million
– Total revenue: $5.3 million
— Local sources: $1.6 million
— State sources: $3.3 million
— Federal sources: $408,478
Ground Picture // Shutterstock
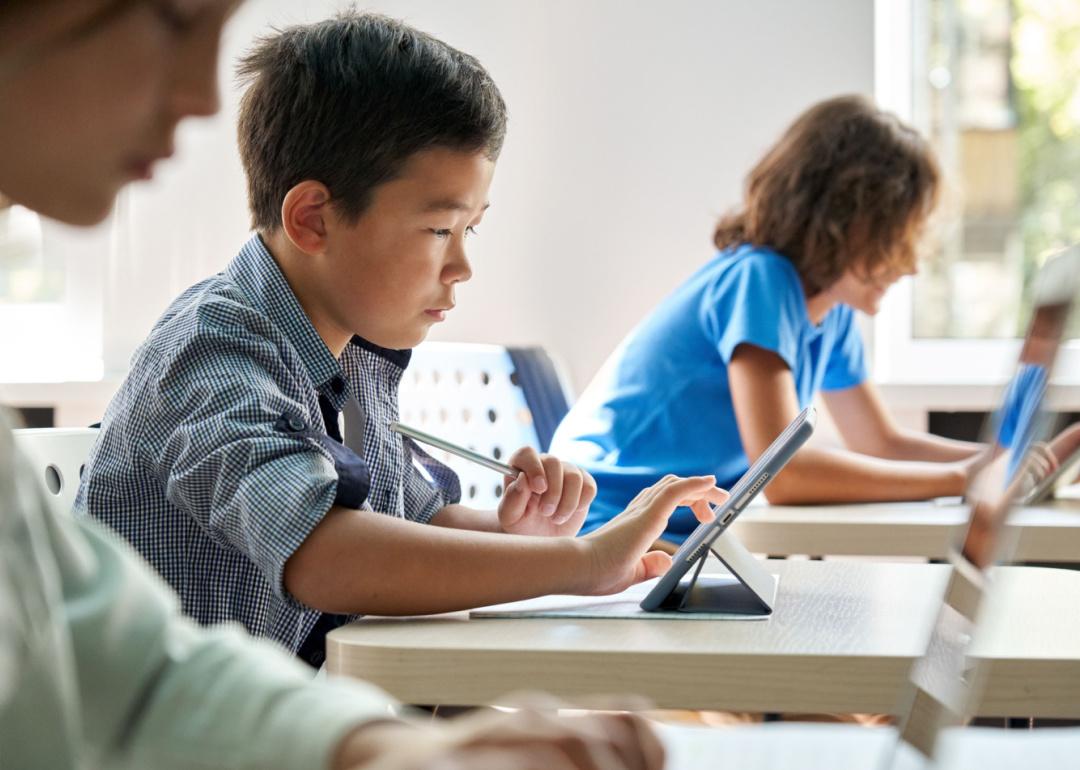
#47. Tennessee*
Boy using digital tablet during class in classroom.
– Per pupil spending: $9,896 (12.3% increase from 2016)
– Total expenditures: $11.2 million
– Total revenue: $11.1 million
— Local sources: $4.8 million
— State sources: $5.2 million
— Federal sources: $1.1 million
Monkey Business Images // Shutterstock
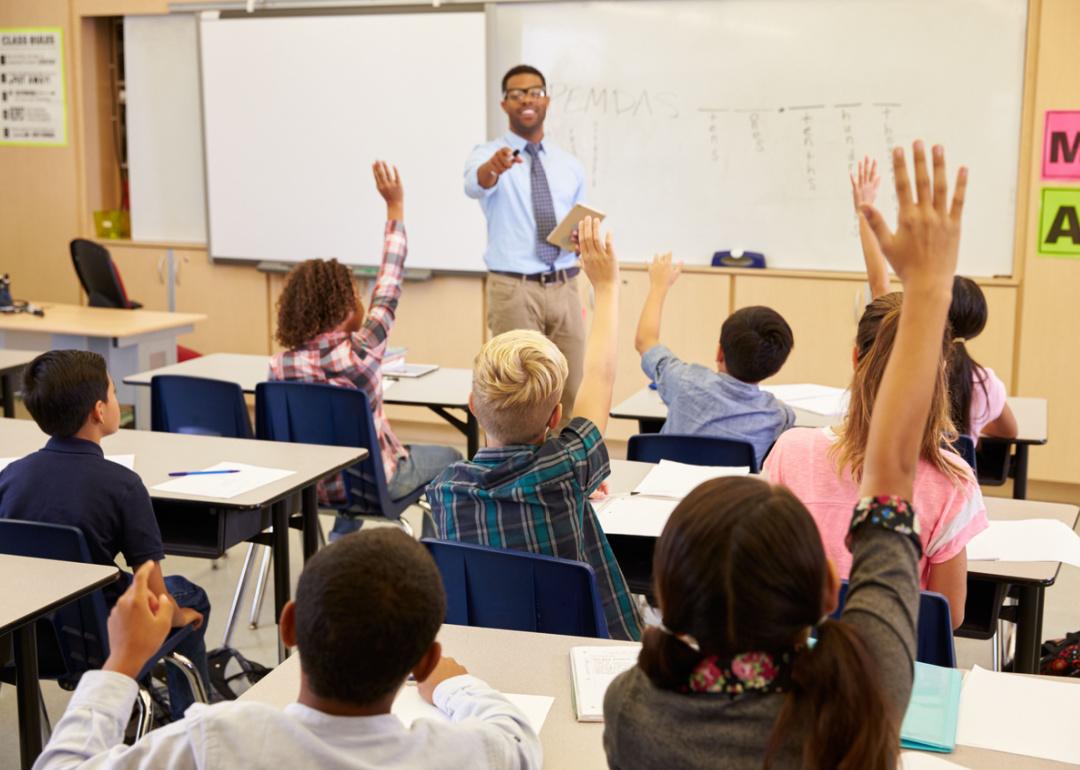
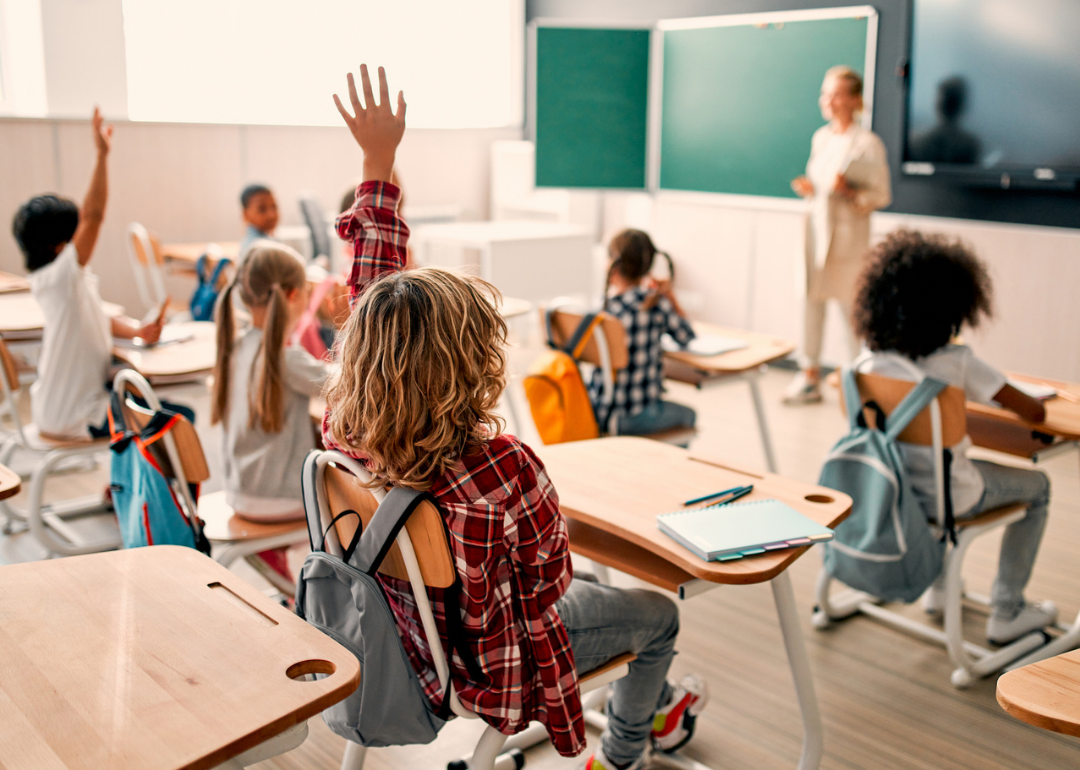
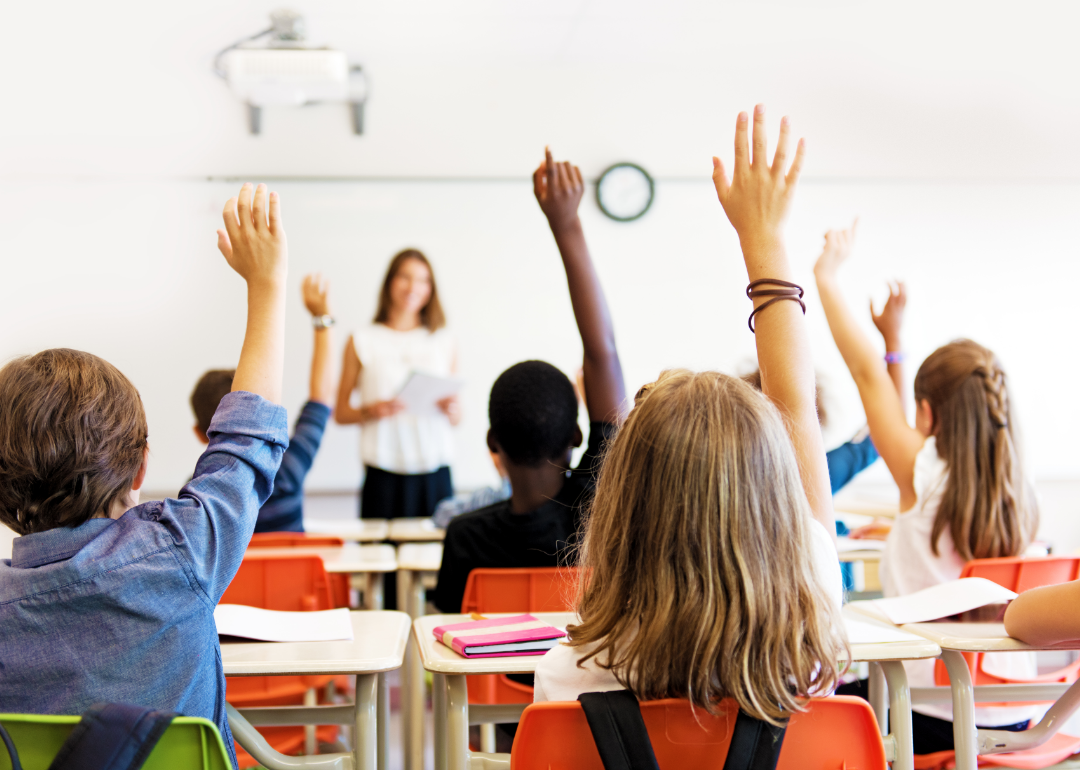
#46. Mississippi
Kids raising hands in classroom.
– Per pupil spending: $10,164 (16.8% increase from 2016)
– Total expenditures: $5.2 million
– Total revenue: $5.3 million
— Local sources: $1.8 million
— State sources: $2.4 million
— Federal sources: $1.0 million
Monkey Business Images // Shutterstock
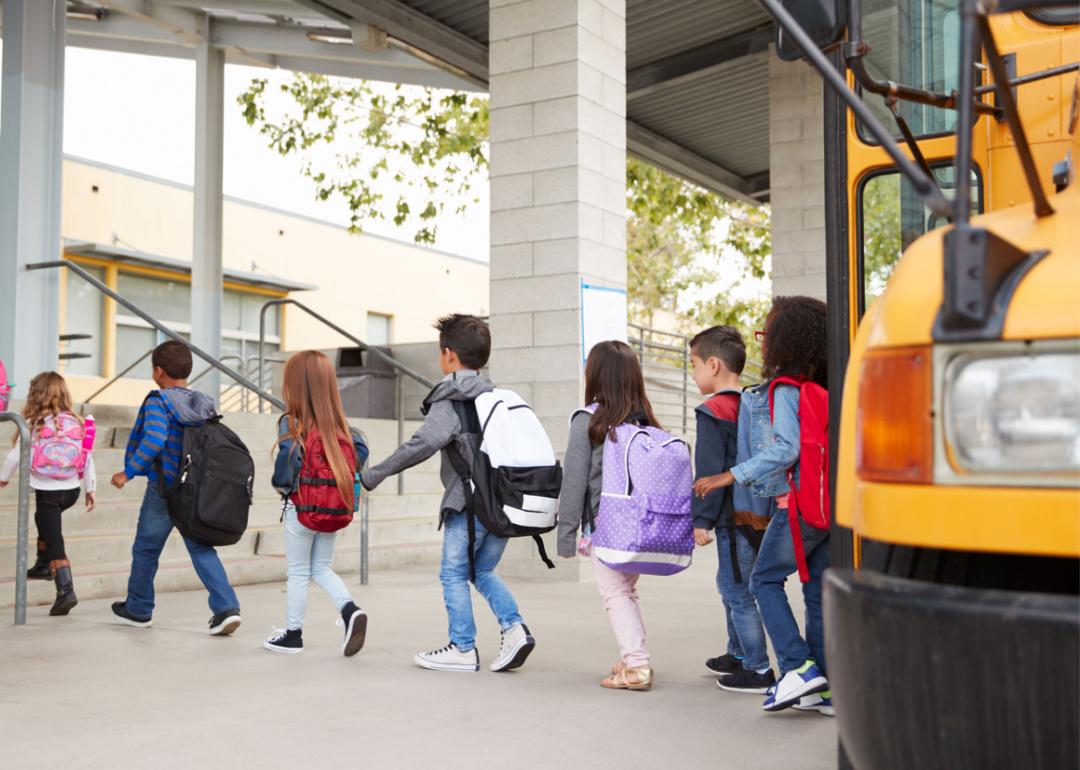
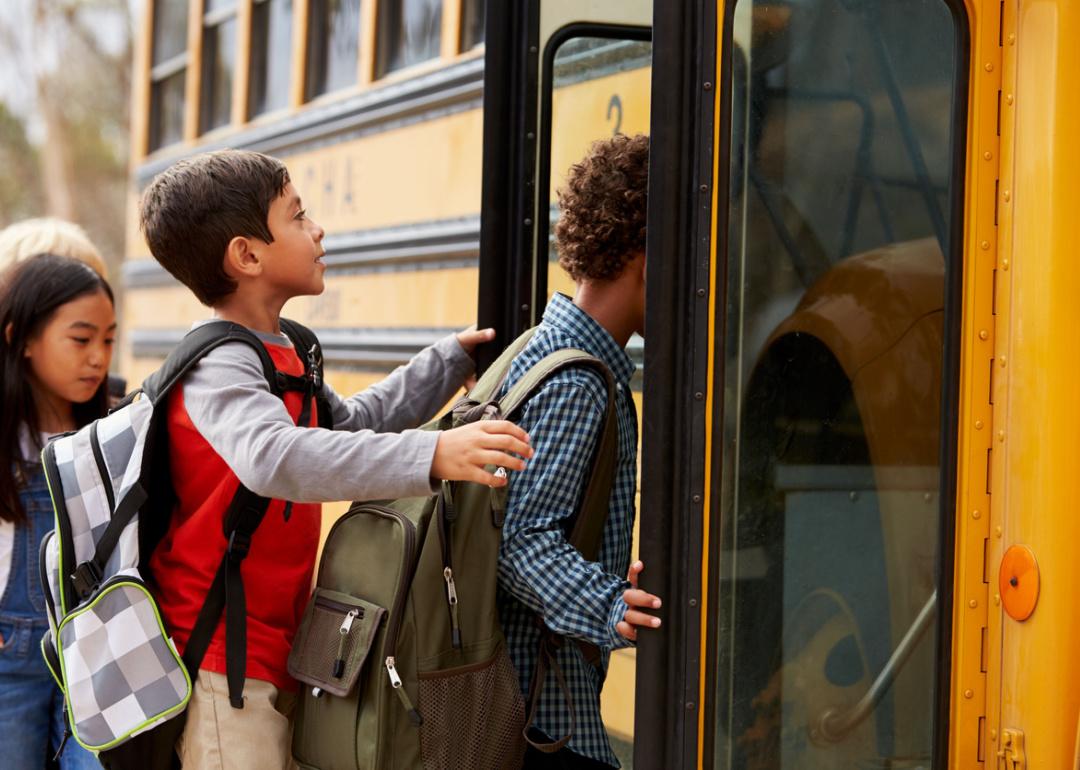
#45. Texas*
Elementary school students walking into school building.
– Per pupil spending: $10,342 (14.7% increase from 2016)
– Total expenditures: $71.9 million
– Total revenue: $68.9 million
— Local sources: $38.5 million
— State sources: $23.5 million
— Federal sources: $6.8 million
4 PM production // Shutterstock
#44. Florida
Classroom with students seated at desk, with teacher at front
– Per pupil spending: $10,401 (16.6% increase from 2016)
– Total expenditures: $33.4 million
– Total revenue: $34.3 million
— Local sources: $17.0 million
— State sources: $12.6 million
— Federal sources: $4.8 million
connel // Shutterstock
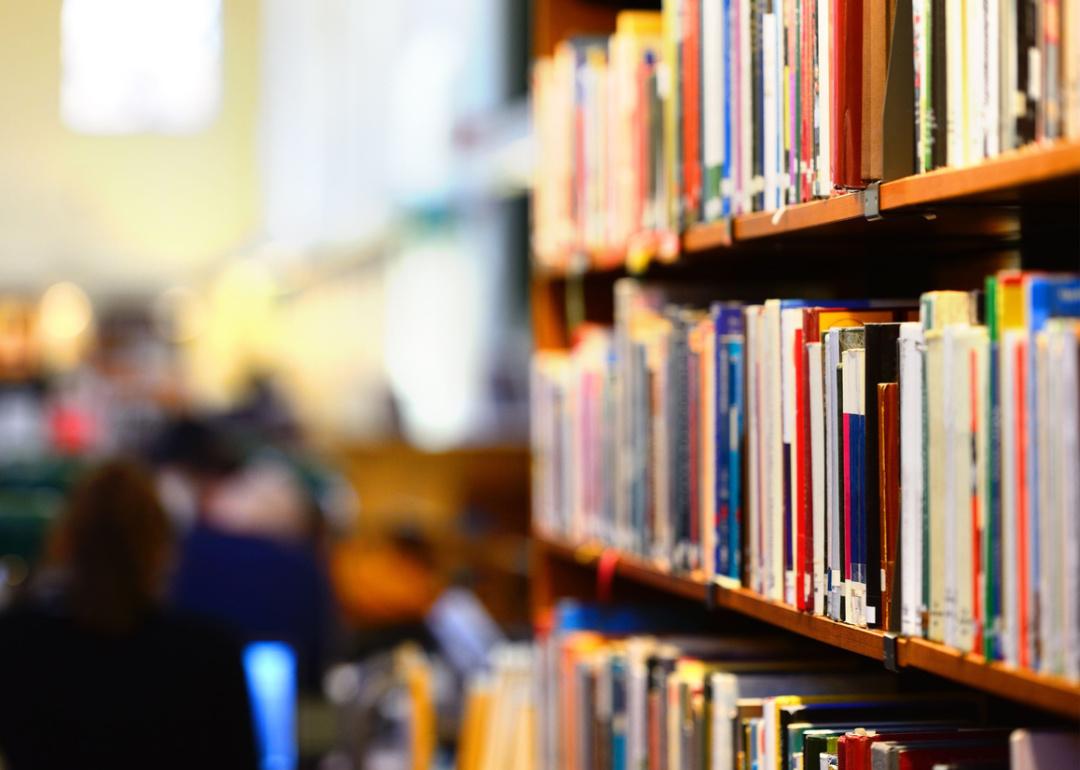
#43. Oklahoma
Selective focus of books on library shelf.
– Per pupil spending: $10,489 (29.5% increase from 2016)
– Total expenditures: $7.4 million
– Total revenue: $7.0 million
— Local sources: $3.1 million
— State sources: $3.2 million
— Federal sources: $781,561
Rawpixel.com// Shutterstock
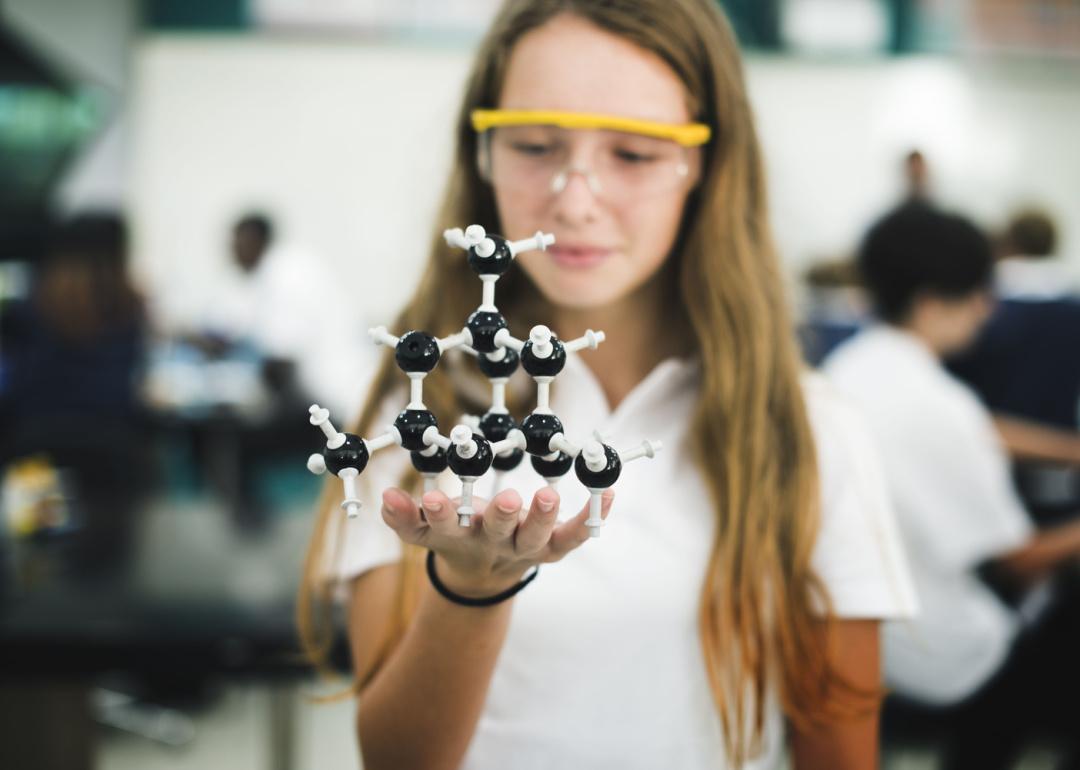
#42. North Carolina
High school student holding molecule structure in chemistry class.
– Per pupil spending: $10,655 (21.2% increase from 2016)
– Total expenditures: $16.4 million
– Total revenue: $16.1 million
— Local sources: $4.2 million
— State sources: $9.8 million
— Federal sources: $2.0 million

Ground Picture // Shutterstock
#41. Alabama
Group of elementary students sitting together in library.
– Per pupil spending: $10,683 (15.6% increase from 2016)
– Total expenditures: $9.1 million
– Total revenue: $9.7 million
— Local sources: $3.0 million
— State sources: $5.2 million
— Federal sources: $1.5 million

Drazen Zigic // Shutterstock
#40. Indiana*
Elementary school teacher giving high-five to student.
– Per pupil spending: $10,935 (10.9% increase from 2016)
– Total expenditures: $13.4 million
– Total revenue: $13.3 million
— Local sources: $4.1 million
— State sources: $8.3 million
— Federal sources: $947,532
Jacob Lund // Shutterstock
#39. South Dakota
Three seated teen students in classroom.
– Per pupil spending: $10,952 (19.4% increase from 2016)
– Total expenditures: $1.8 million
– Total revenue: $1.9 million
— Local sources: $932,103
— State sources: $607,394
— Federal sources: $373,186
David Prahl // Shutterstock
#38. Arkansas
Yellow buses lined up in front of school.
– Per pupil spending: $11,266 (14.4% increase from 2016)
– Total expenditures: $6.1 million
– Total revenue: $6.1 million
— Local sources: $783,222
— State sources: $4.3 million
— Federal sources: $990,370
Canva
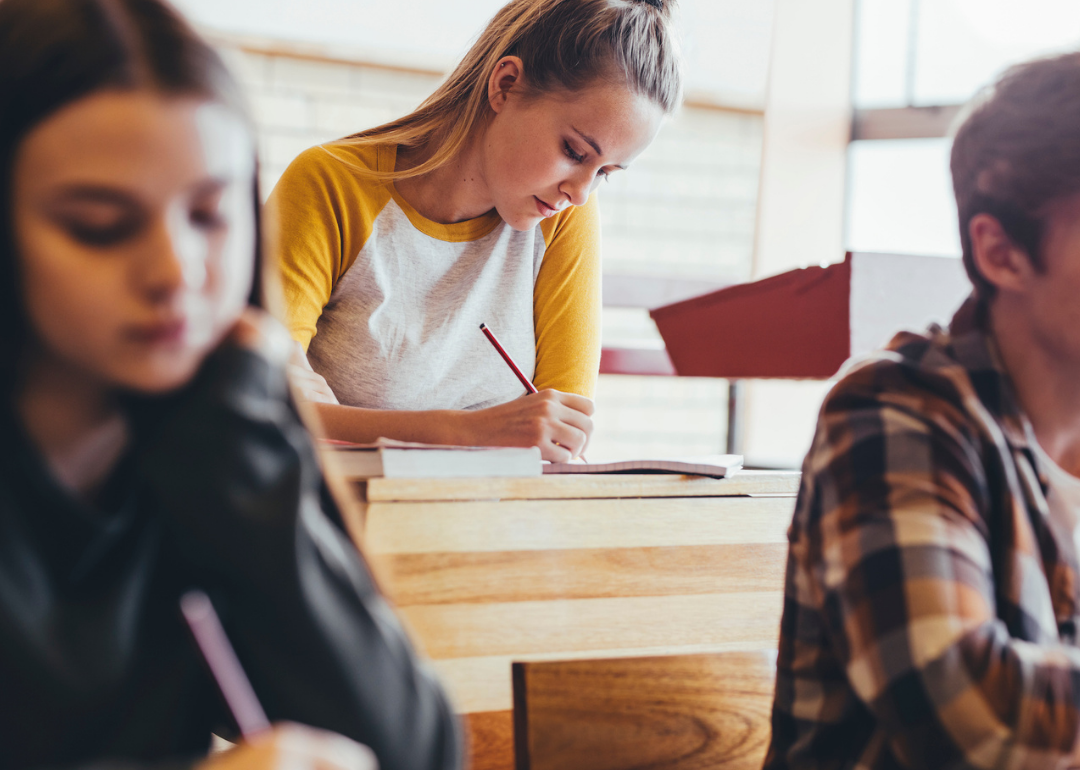
#37. New Mexico*
Four seated teen students writing in class.
– Per pupil spending: $11,332 (16.9% increase from 2016)
– Total expenditures: $4.2 million
– Total revenue: $4.5 million
— Local sources: $828,101
— State sources: $3.1 million
— Federal sources: $633,201
Canva
#36. Louisiana*
Exterior of high school building.
– Per pupil spending: $11,843 (7.3% increase from 2016)
– Total expenditures: $8.2 million
– Total revenue: $8.8 million
— Local sources: $4.1 million
— State sources: $3.6 million
— Federal sources: $1.0 million

Canva
#35. Missouri
Selective focus of hand raised in classroom.
– Per pupil spending: $11,865 (15.0% increase from 2016)
– Total expenditures: $11.9 million
– Total revenue: $11.7 million
— Local sources: $5.3 million
— State sources: $4.8 million
— Federal sources: $1.5 million
Canva
#34. Colorado
Exterior of public school building.
– Per pupil spending: $12,073 (26.1% increase from 2016)
– Total expenditures: $13.0 million
– Total revenue: $12.9 million
— Local sources: $6.7 million
— State sources: $5.4 million
— Federal sources: $831,834
Leena Robinson // Shutterstock
#33. Georgia
Row of parked yellow school busses.
– Per pupil spending: $12,145 (24.3% increase from 2016)
– Total expenditures: $23.1 million
– Total revenue: $24.7 million
— Local sources: $11.4 million
— State sources: $10.3 million
— Federal sources: $3.0 million

Monkey Business Images // Shutterstock
#32. Kentucky
Elementary student and teacher talking to class.
– Per pupil spending: $12,212 (23.8% increase from 2016)
– Total expenditures: $9.2 million
– Total revenue: $9.4 million
— Local sources: $3.2 million
— State sources: $4.7 million
— Federal sources: $1.5 million
Monkey Business Images // Shutterstock
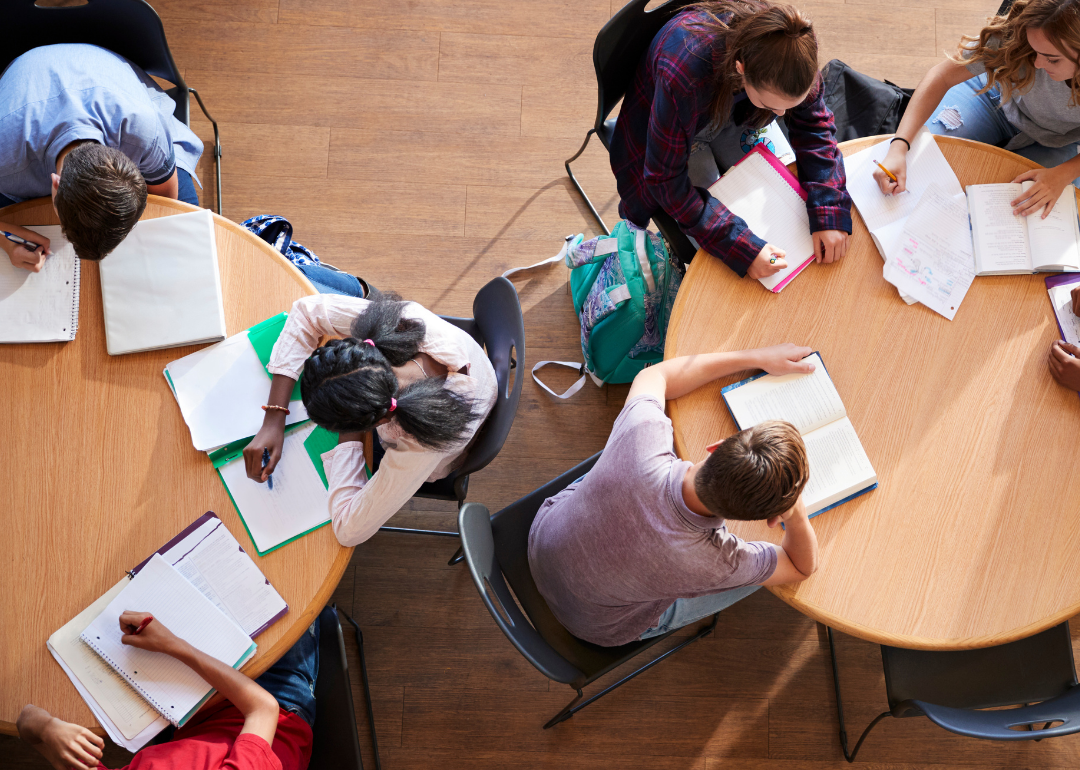
#31. West Virginia*
Overhead view of two round tables with groups of students studying.
– Per pupil spending: $12,375 (9.6% increase from 2016)
– Total expenditures: $3.6 million
– Total revenue: $3.7 million
— Local sources: $1.2 million
— State sources: $2.1 million
— Federal sources: $431,832
Monkey Business Images // Shutterstock
#30. South Carolina
Students seated at desks in classroom.
– Per pupil spending: $12,513 (22.1% increase from 2016)
– Total expenditures: $10.7 million
– Total revenue: $11.1 million
— Local sources: $4.8 million
— State sources: $5.2 million
— Federal sources: $1.2 million

LightField Studios // Shutterstock
#29. Iowa
Group of students raising hands in class.
– Per pupil spending: $12,695 (13.9% increase from 2016)
– Total expenditures: $7.7 million
– Total revenue: $7.9 million
— Local sources: $3.0 million
— State sources: $4.0 million
— Federal sources: $866,314

SeventyFour // Shutterstock
#28. Kansas*
Teenage boy using laptop while studying.
– Per pupil spending: $12,697 (27.5% increase from 2016)
– Total expenditures: $7.6 million
– Total revenue: $7.3 million
— Local sources: $1.9 million
— State sources: $4.9 million
— Federal sources: $521,925
Canva
#27. Montana
Group of students raising hands in class.
– Per pupil spending: $13,299 (17.2% increase from 2016)
– Total expenditures: $2.3 million
– Total revenue: $2.2 million
— Local sources: $925,591
— State sources: $898,971
— Federal sources: $424,944
Canva
#26. Wisconsin
Male student writing at desk.
– Per pupil spending: $13,597 (18.7% increase from 2016)
– Total expenditures: $13.2 million
– Total revenue: $13.2 million
— Local sources: $4.9 million
— State sources: $7.2 million
— Federal sources: $1.1 million
JL Jahn // Shutterstock
#25. Nebraska
Exterior of public school building.
– Per pupil spending: $13,816 (12.3% increase from 2016)
– Total expenditures: $5.5 million
– Total revenue: $5.1 million
— Local sources: $3.1 million
— State sources: $1.6 million
— Federal sources: $484,645
Monkey Business Images // Shutterstock
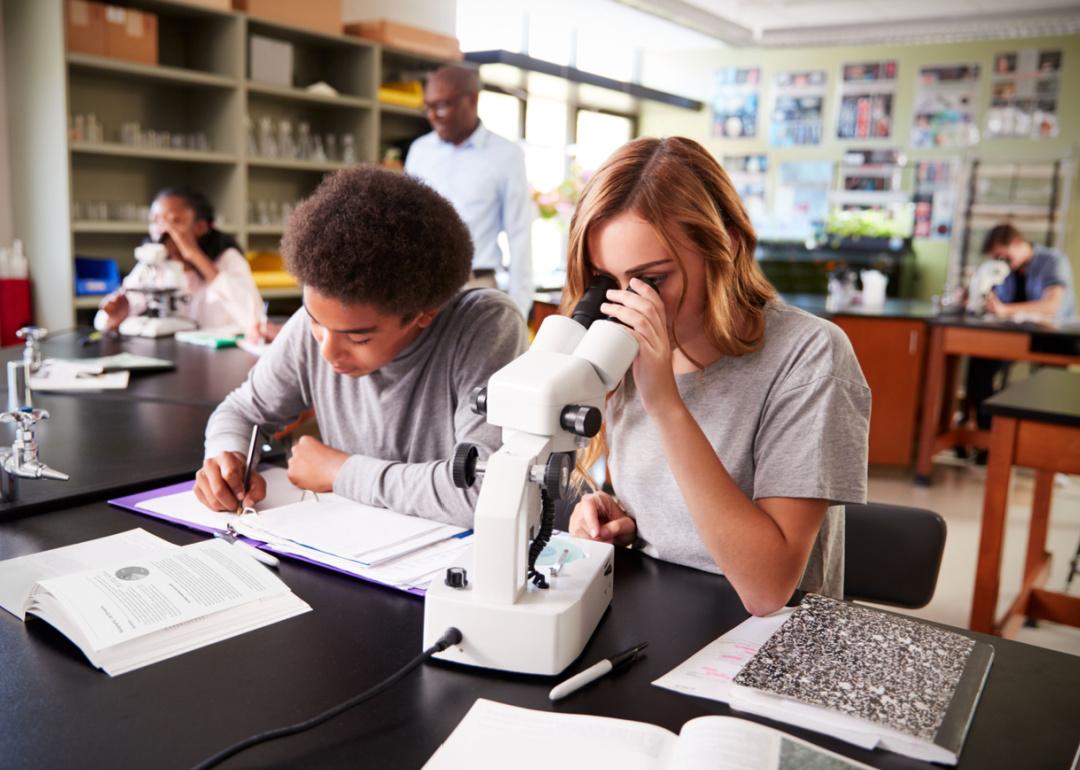
#24. Virginia
High school students in biology lab.
– Per pupil spending: $13,835 (21.0% increase from 2016)
– Total expenditures: $18.9 million
– Total revenue: $19.3 million
— Local sources: $9.7 million
— State sources: $7.8 million
— Federal sources: $1.7 million

Ground Picture // Shutterstock
#23. Oregon
School children raising hands in classroom.
– Per pupil spending: $13,843 (27.7% increase from 2016)
– Total expenditures: $10.4 million
– Total revenue: $9.7 million
— Local sources: $3.7 million
— State sources: $5.3 million
— Federal sources: $707,344
Monkey Business Images // Shutterstock
#22. Michigan
Group of elementary school students getting on bus.
– Per pupil spending: $14,085 (20.7% increase from 2016)
– Total expenditures: $21.0 million
– Total revenue: $22.2 million
— Local sources: $7.2 million
— State sources: $12.1 million
— Federal sources: $2.9 million
Canva
#21. Minnesota
Yellow school sign with buildings in background.
– Per pupil spending: $14,378 (16.1% increase from 2016)
– Total expenditures: $15.0 million
– Total revenue: $14.4 million
— Local sources: $4.1 million
— State sources: $8.9 million
— Federal sources: $1.3 million
Canva
#20. Ohio
Elementary school students lining up for bus.
– Per pupil spending: $14,585 (20.5% increase from 2016)
– Total expenditures: $27.3 million
– Total revenue: $27.4 million
— Local sources: $14.1 million
— State sources: $10.8 million
— Federal sources: $2.4 million

NDAB Creativity // Shutterstock
#19. Maine*
Female student holding book in library.
– Per pupil spending: $14,892 (12.1% increase from 2016)
– Total expenditures: $3.0 million
– Total revenue: $3.1 million
— Local sources: $1.7 million
— State sources: $1.2 million
— Federal sources: $177,918
Gorodenkoff // Shutterstock
#18. California
School children at desk in computer lab.
– Per pupil spending: $15,017 (30.6% increase from 2016)
– Total expenditures: $97.1 million
– Total revenue: $106.6 million
— Local sources: $36.4 million
— State sources: $55.4 million
— Federal sources: $14.8 million
Rawpixel.com// Shutterstock
#17. Massachusetts
Elementary school students sitting in group with hands raised.
– Per pupil spending: $15,092 (3.2% decrease from 2016)
– Total expenditures: $15.8 million
– Total revenue: $9.8 million
— Local sources: $2.2 million
— State sources: $6.6 million
— Federal sources: $1.0 million
BIGANDT.COM// Shutterstock
#16. North Dakota
Child working on math assignment at desk.
– Per pupil spending: $15,140 (13.2% increase from 2016)
– Total expenditures: $2.1 million
– Total revenue: $2.1 million
— Local sources: $693,897
— State sources: $1.1 million
— Federal sources: $336,071
knelson20 // Shutterstock
#15. Washington
Elementary school building exterior.
– Per pupil spending: $15,448 (33.9% increase from 2016)
– Total expenditures: $21.0 million
– Total revenue: $20.5 million
— Local sources: $5.0 million
— State sources: $13.9 million
— Federal sources: $1.7 million
michaeljung // Shutterstock
#14. Maryland
Elementary school students in computer class.
– Per pupil spending: $16,417 (15.6% increase from 2016)
– Total expenditures: $16.2 million
– Total revenue: $17.4 million
— Local sources: $8.7 million
— State sources: $7.5 million
— Federal sources: $1.2 million
Stuart Monk // Shutterstock
#13. Hawaii*
Group of young children getting on school bus.
– Per pupil spending: $16,564 (20.5% increase from 2016)
– Total expenditures: $3.2 million
– Total revenue: $3.4 million
— Local sources: $51,323
— State sources: $3.1 million
— Federal sources: $278,259
Drazen Zigic // Shutterstock
#12. Delaware
Teacher leading elementary school class.
– Per pupil spending: $17,549 (19.3% increase from 2016)
– Total expenditures: $2.3 million
– Total revenue: $2.6 million
— Local sources: $803,051
— State sources: $1.6 million
— Federal sources: $189,228
Cynthia Farmer // Shutterstock
#11. Pennsylvania
Exterior of American high school building.
– Per pupil spending: $17,884 (15.9% increase from 2016)
– Total expenditures: $33.9 million
– Total revenue: $34.8 million
— Local sources: $18.8 million
— State sources: $13.0 million
— Federal sources: $3.0 million
LStockStudio // Shutterstock
#10. Wyoming
Students focused on desks during class
– Per pupil spending: $18,144 (10.4% increase from 2016)
– Total expenditures: $1.9 million
– Total revenue: $1.9 million
— Local sources: $718,270
— State sources: $976,134
— Federal sources: $233,888
LStockStudio // Shutterstock
#9. Illinois
Closeup of male student writing in notebook
– Per pupil spending: $18,353 (29.4% increase from 2016)
– Total expenditures: $39.1 million
– Total revenue: $40.6 million
— Local sources: $21.3 million
— State sources: $16.1 million
— Federal sources: $3.2 million
LStockStudio // Shutterstock
#8. Rhode Island
Group of high school students seated in classroom
– Per pupil spending: $18,366 (18.2% increase from 2016)
– Total expenditures: $2.7 million
– Total revenue: $2.7 million
— Local sources: $1.4 million
— State sources: $1.1 million
— Federal sources: $258,934
Inside Creative House // Shutterstock
#7. New York
School children lined up to board bus.
– Per pupil spending: $18,858 (15.7% decrease from 2016)
– Total expenditures: $58.9 million
– Total revenue: $77.4 million
— Local sources: $45.0 million
— State sources: $29.6 million
— Federal sources: $2.8 million
Ground Picture // Shutterstock
#6. New Hampshire
Student taking standardized test at desk.
– Per pupil spending: $19,443 (26.7% increase from 2016)
– Total expenditures: $3.3 million
– Total revenue: $3.5 million
— Local sources: $2.2 million
— State sources: $1.1 million
— Federal sources: $219,164

LStockStudio // Shutterstock
#5. Alaska
Hands raised in classroom.
– Per pupil spending: $19,447 (11.1% increase from 2016)
– Total expenditures: $2.7 million
– Total revenue: $2.6 million
— Local sources: $563,831
— State sources: $1.6 million
— Federal sources: $427,239
Monkey Business Images // Shutterstock
#4. New Jersey
Students in computer coding class.
– Per pupil spending: $19,695 (7.0% increase from 2016)
– Total expenditures: $29.5 million
– Total revenue: $33.7 million
— Local sources: $17.3 million
— State sources: $15.0 million
— Federal sources: $1.4 million
Gorodenkoff // Shutterstock
#3. Vermont
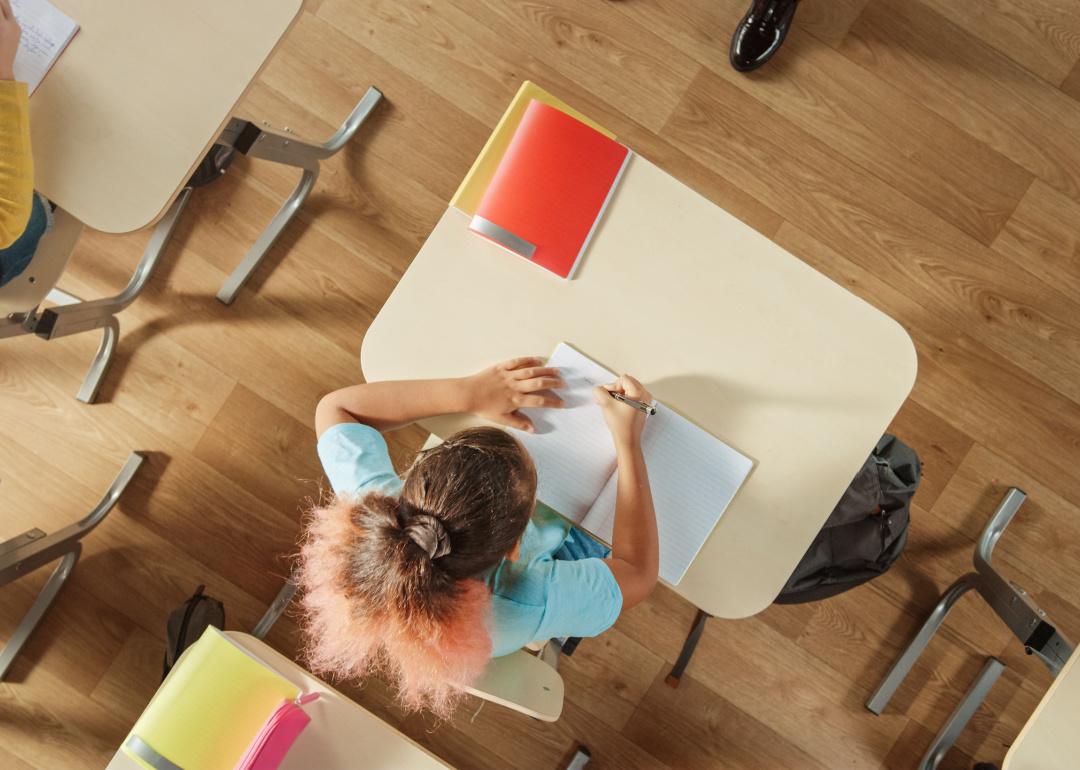
Top view of student at desk in school classroom.
– Per pupil spending: $22,740 (27.2% increase from 2016)
– Total expenditures: $2.0 million
– Total revenue: $2.1 million
— Local sources: $8,139
— State sources: $1.8 million
— Federal sources: $201,153

Canva
#2. Connecticut
Teacher calls on student with raised hand in class.
– Per pupil spending: $22,769 (20.1% increase from 2016)
– Total expenditures: $12.0 million
– Total revenue: $12.4 million
— Local sources: $7.2 million
— State sources: $4.5 million
— Federal sources: $663,398
Kosoff // Shutterstock
#1. District of Columbia
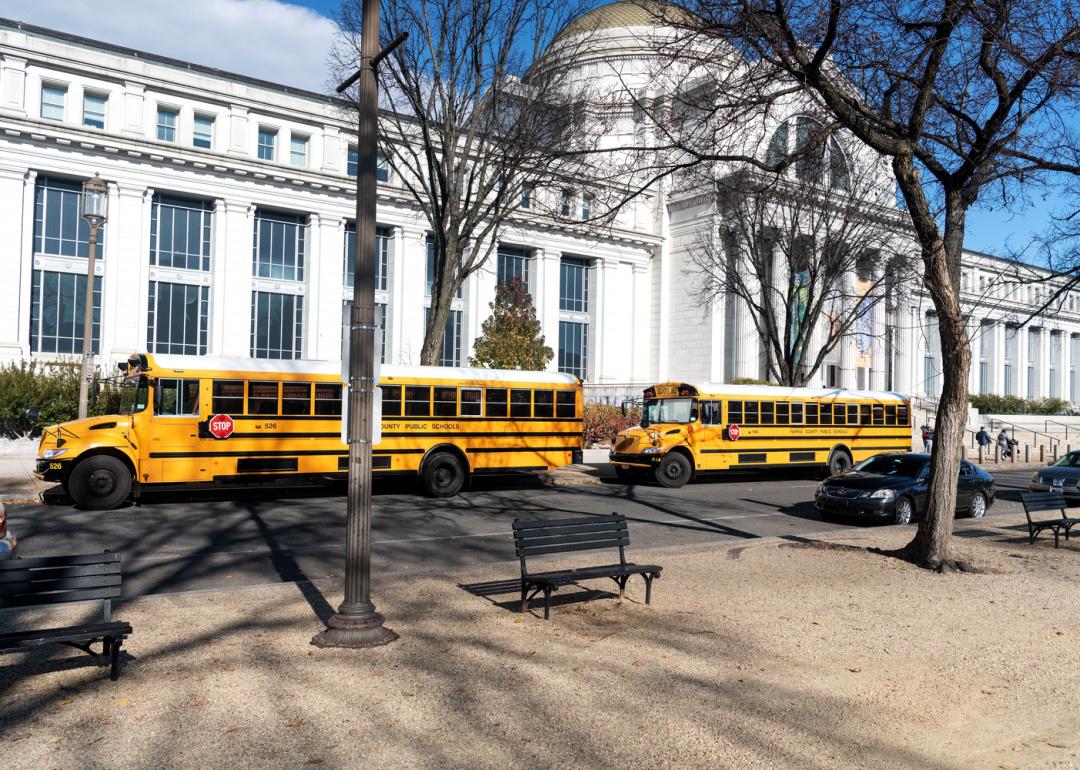
School buses parked outside museum in Washington DC.
– Per pupil spending: $24,535 (21.3% increase from 2016)
– Total expenditures: $1.7 million
– Total revenue: $1.7 million
— Local sources: $1.5 million
— State sources: Not applicable
— Federal sources: $166,591
This story originally appeared on Best Universities and was produced and
distributed in partnership with Stacker Studio.
