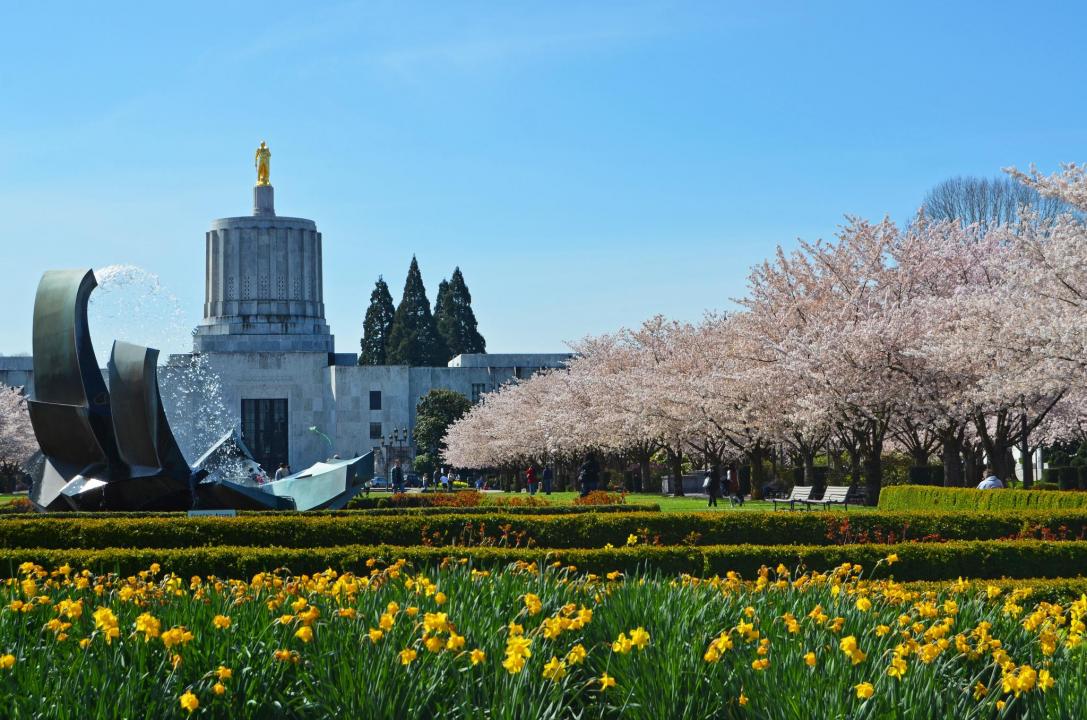
Most diverse counties in Oregon

M.O. Stevens // Wikimedia Commons
Most diverse counties in Oregon
The United States has a longstanding reputation as being a melting pot (or salad bowl), with its diversity manifesting itself across many different demographics. However, some places across the country are notably more heterogeneous than others.
Stacker compiled a list of the most diverse counties in Oregon using data from using data from the U.S. Census Bureau. Counties are ranked by the highest Simpson’s diversity index score. Simpson’s diversity index measures community diversity on a scale of 0 (least diverse) to 1 (most diverse), more on the calculation can be read here.
Think you know which counties in your home state might be the most diverse? Keep reading to see if your predictions are correct.
You may also like: Fastest-growing counties in Oregon
![]()
Sam Beebe // Wikimedia Commons
#36. Wallowa County
– Index: 0.099
– Total population: 7,004
– White: 94.9% (6,647)
– Black or African American: 0.2% (12)
– American Indian and Alaska Native: 1.1% (77)
– Asian: 0.3% (18)
– Native Hawaiian and other Pacific Islander: 0.1% (9)
– 2 or more races: 2.5% (176)
– Some other Race: 0.9% (65)
Finetooth // Wikimedia Commons
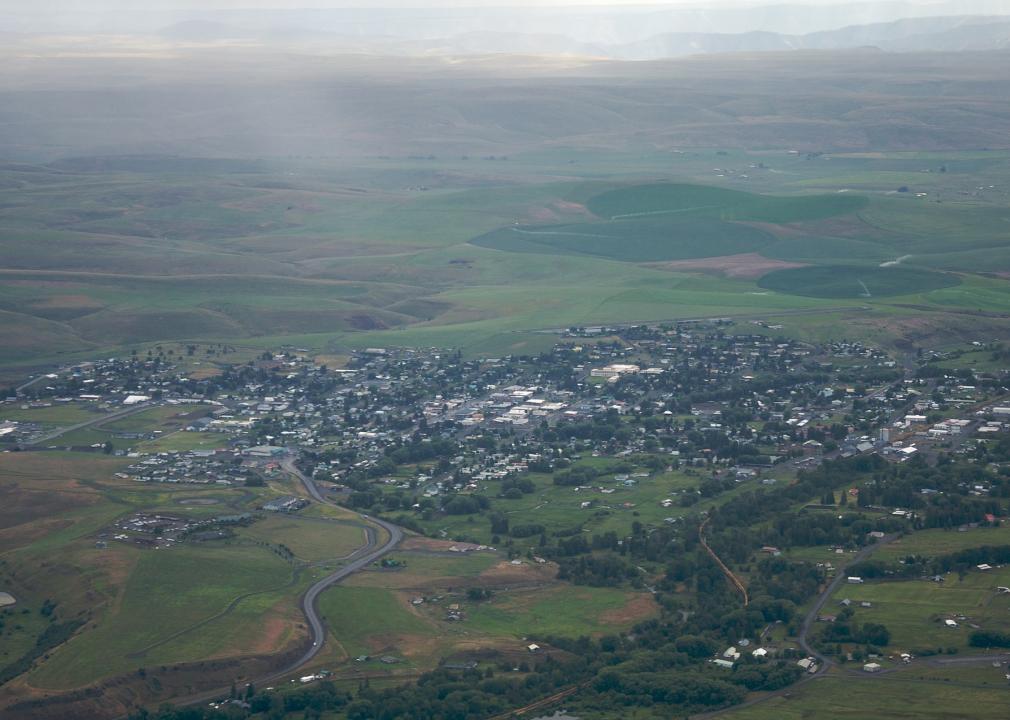
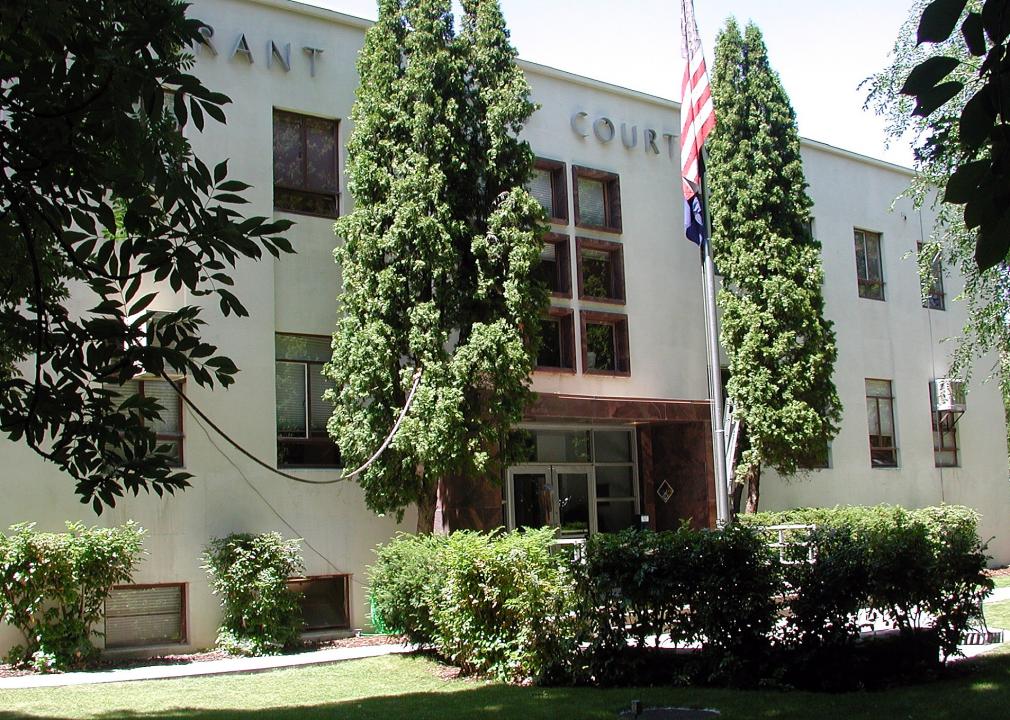
#35. Grant County
– Index: 0.102
– Total population: 7,189
– White: 94.7% (6,811)
– Black or African American: 0.1% (7)
– American Indian and Alaska Native: 1.3% (96)
– Asian: 0.8% (55)
– Native Hawaiian and other Pacific Islander: 0.2% (17)
– 2 or more races: 2.3% (168)
– Some other Race: 0.5% (35)
Tomas Nevesely // Shutterstock
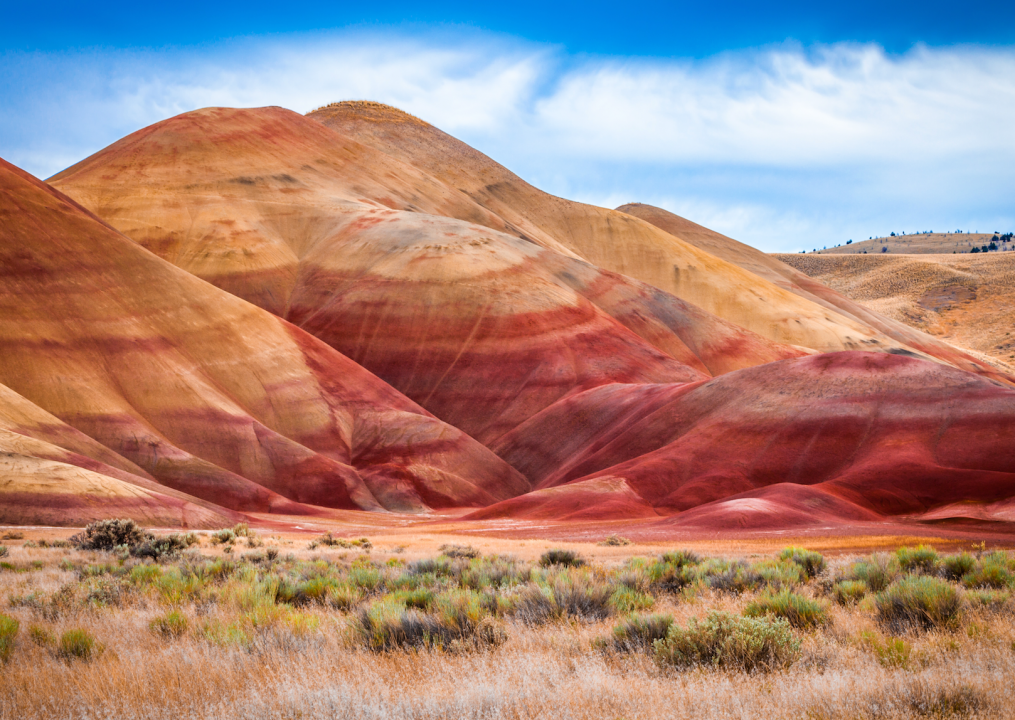
#34. Wheeler County
– Index: 0.129
– Total population: 1,415
– White: 93.2% (1,319)
– Black or African American: 0.0% (0)
– American Indian and Alaska Native: 0.8% (12)
– Asian: 0.3% (4)
– Native Hawaiian and other Pacific Islander: 0.1% (2)
– 2 or more races: 3.7% (53)
– Some other Race: 1.8% (25)
Ian Poellet // Wikimedia Commons
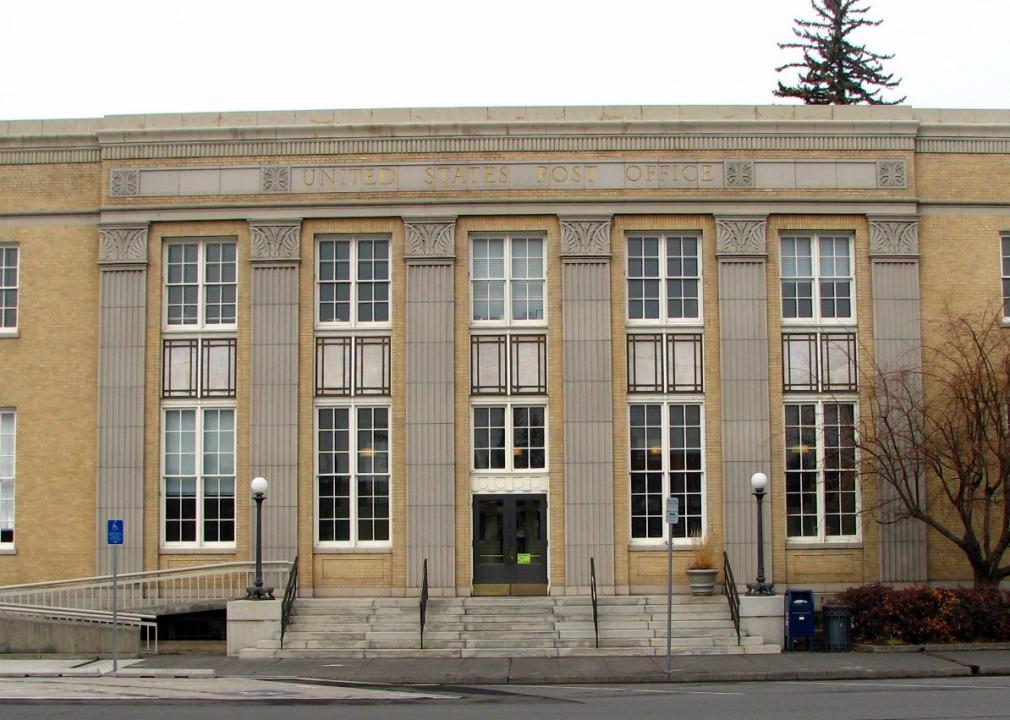
#33. Deschutes County
– Index: 0.130
– Total population: 186,251
– White: 93.2% (173,615)
– Black or African American: 0.6% (1,188)
– American Indian and Alaska Native: 0.6% (1,166)
– Asian: 1.1% (2,067)
– Native Hawaiian and other Pacific Islander: 0.2% (313)
– 2 or more races: 3.0% (5,550)
– Some other Race: 1.3% (2,352)
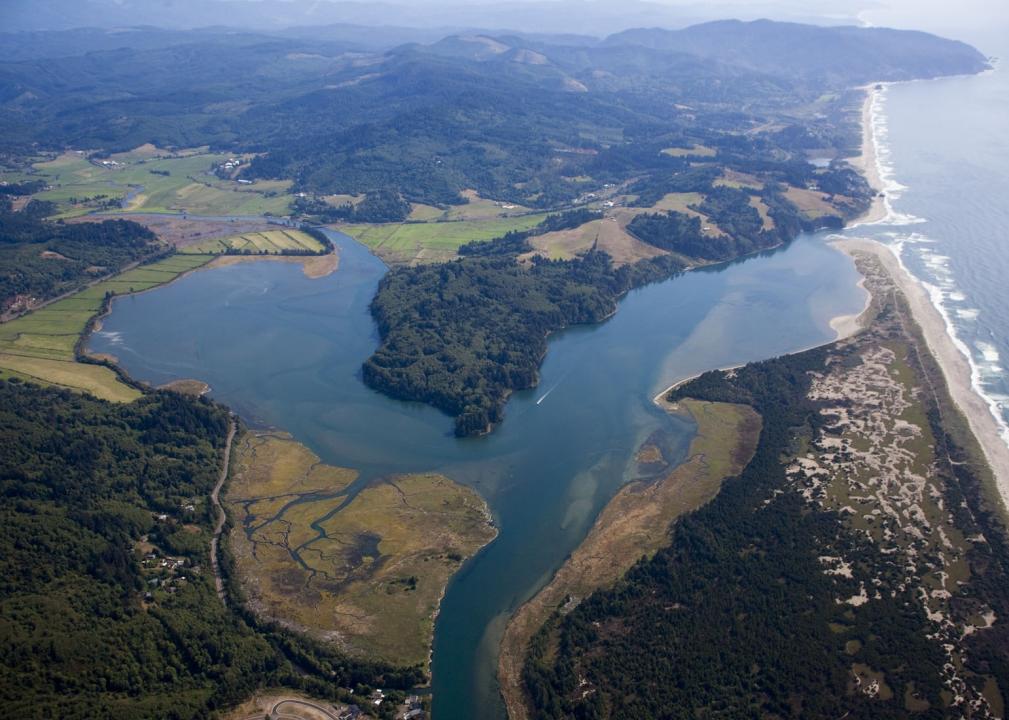
USFWS Headquarters’ photostream // Wikimedia Commons
#32. Tillamook County
– Index: 0.132
– Total population: 26,389
– White: 93.1% (24,561)
– Black or African American: 0.4% (110)
– American Indian and Alaska Native: 0.9% (236)
– Asian: 0.7% (181)
– Native Hawaiian and other Pacific Islander: 0.5% (123)
– 2 or more races: 3.5% (916)
– Some other Race: 1.0% (262)
You may also like: Best places to retire in Oregon
Cacophony // Wikimedia Commons
#31. Crook County
– Index: 0.133
– Total population: 23,011
– White: 93.0% (21,410)
– Black or African American: 0.5% (126)
– American Indian and Alaska Native: 1.0% (229)
– Asian: 0.3% (80)
– Native Hawaiian and other Pacific Islander: 0.4% (101)
– 2 or more races: 3.0% (687)
– Some other Race: 1.6% (378)
Cacophony // Wikimedia Commons
#30. Columbia County
– Index: 0.139
– Total population: 51,375
– White: 92.7% (47,618)
– Black or African American: 0.5% (248)
– American Indian and Alaska Native: 0.9% (478)
– Asian: 1.0% (509)
– Native Hawaiian and other Pacific Islander: 0.2% (88)
– 2 or more races: 4.1% (2,110)
– Some other Race: 0.6% (324)
Finetooth // Wikimedia Commons
#29. Baker County
– Index: 0.140
– Total population: 16,019
– White: 92.7% (14,844)
– Black or African American: 0.9% (147)
– American Indian and Alaska Native: 1.2% (198)
– Asian: 0.7% (109)
– Native Hawaiian and other Pacific Islander: 0.4% (59)
– 2 or more races: 2.2% (350)
– Some other Race: 1.9% (312)
English: Gary Halvorson, Oregon State Archives // Wikimedia Commons
#28. Douglas County
– Index: 0.144
– Total population: 109,114
– White: 92.4% (100,807)
– Black or African American: 0.4% (462)
– American Indian and Alaska Native: 1.1% (1,221)
– Asian: 1.0% (1,078)
– Native Hawaiian and other Pacific Islander: 0.1% (99)
– 2 or more races: 4.4% (4,782)
– Some other Race: 0.6% (665)
Joseph Novak // Wikicommons
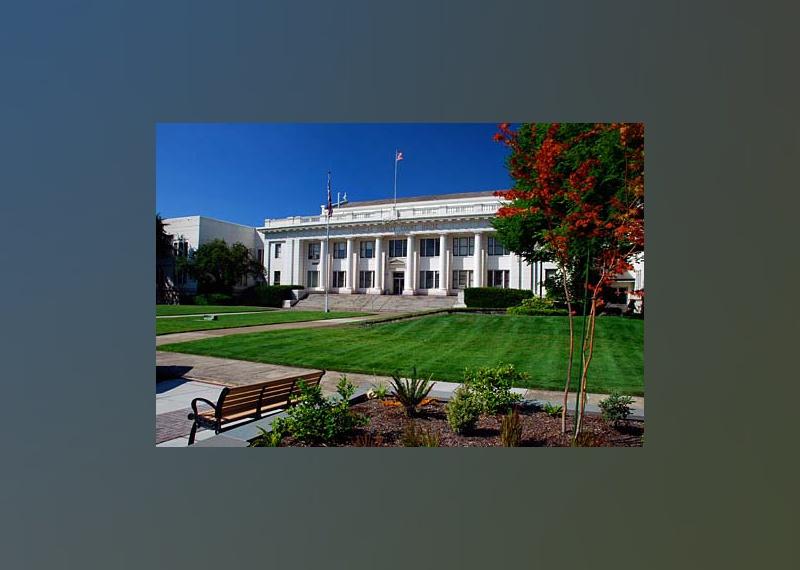
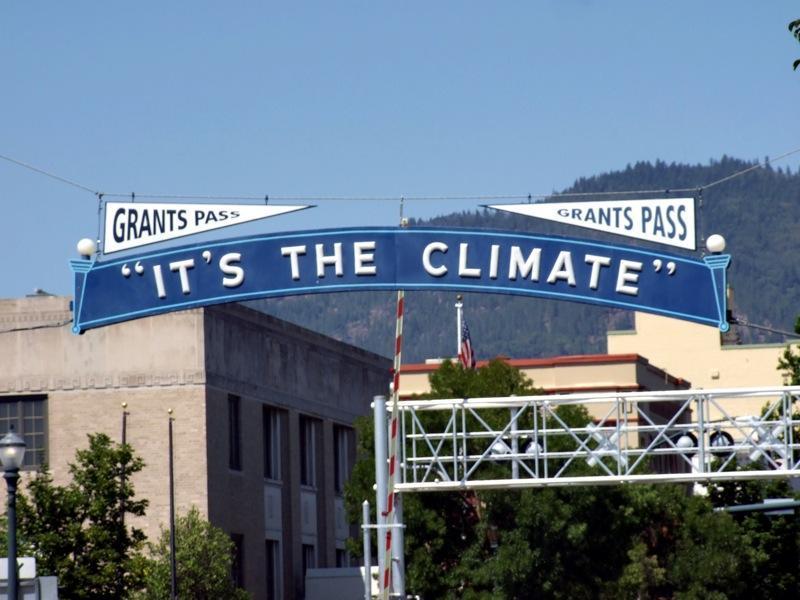
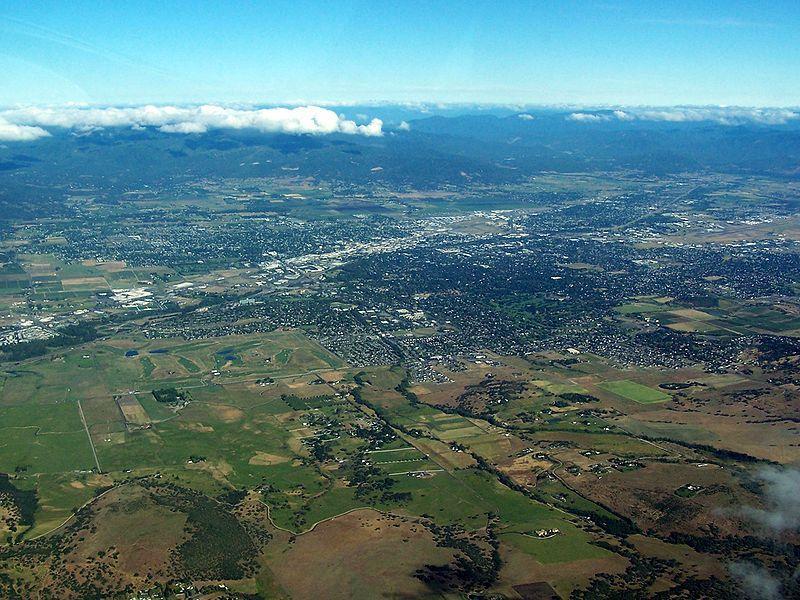
#27. Josephine County
– Index: 0.145
– Total population: 86,251
– White: 92.4% (79,658)
– Black or African American: 0.5% (442)
– American Indian and Alaska Native: 1.2% (1,014)
– Asian: 1.0% (866)
– Native Hawaiian and other Pacific Islander: 0.1% (50)
– 2 or more races: 3.6% (3,093)
– Some other Race: 1.3% (1,128)
You may also like: States sending the most people to Oregon
English: Gary Halvorson, Oregon State Archives // Wikimedia Commons
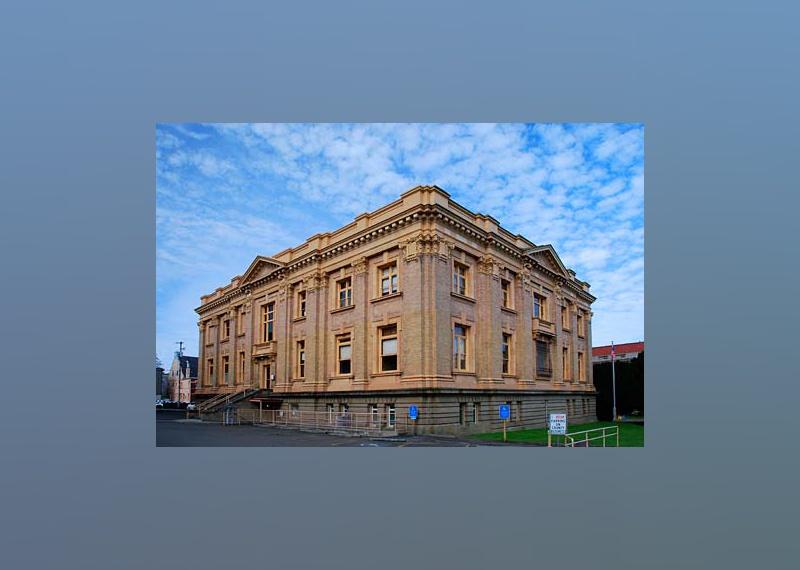
#26. Clatsop County
– Index: 0.153
– Total population: 39,102
– White: 91.9% (35,929)
– Black or African American: 0.8% (314)
– American Indian and Alaska Native: 0.4% (175)
– Asian: 1.0% (387)
– Native Hawaiian and other Pacific Islander: 0.3% (128)
– 2 or more races: 4.6% (1,792)
– Some other Race: 1.0% (377)
Tedder // Wikimedia Commons
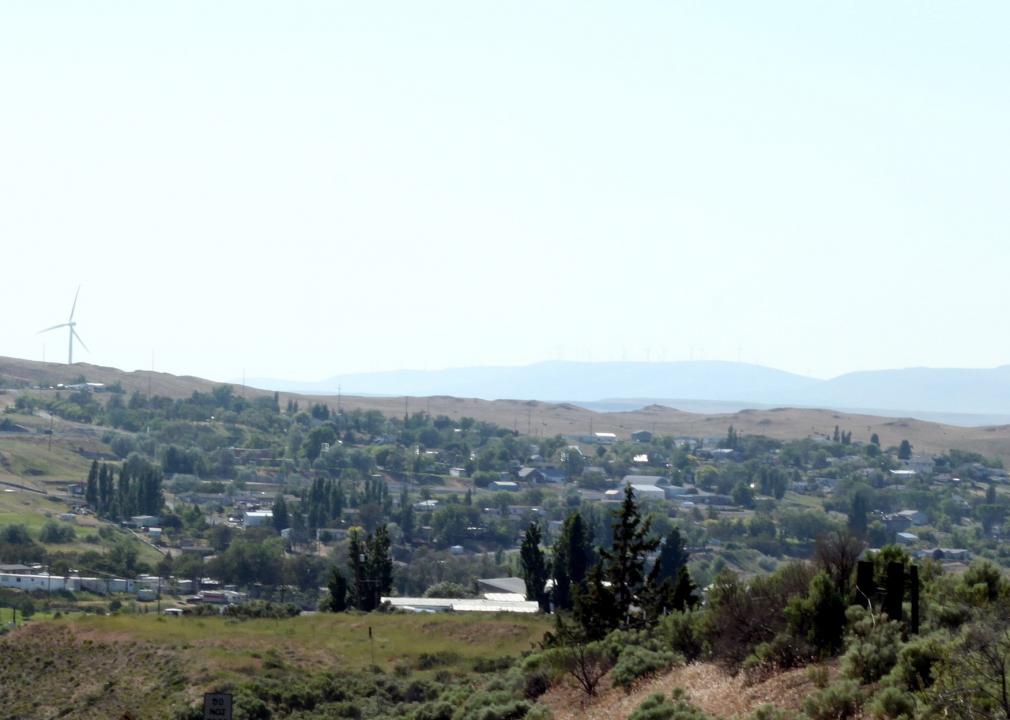
#25. Gilliam County
– Index: 0.154
– Total population: 1,878
– White: 91.9% (1,725)
– Black or African American: 0.0% (0)
– American Indian and Alaska Native: 3.9% (74)
– Asian: 0.8% (15)
– Native Hawaiian and other Pacific Islander: 0.7% (13)
– 2 or more races: 2.1% (39)
– Some other Race: 0.6% (12)
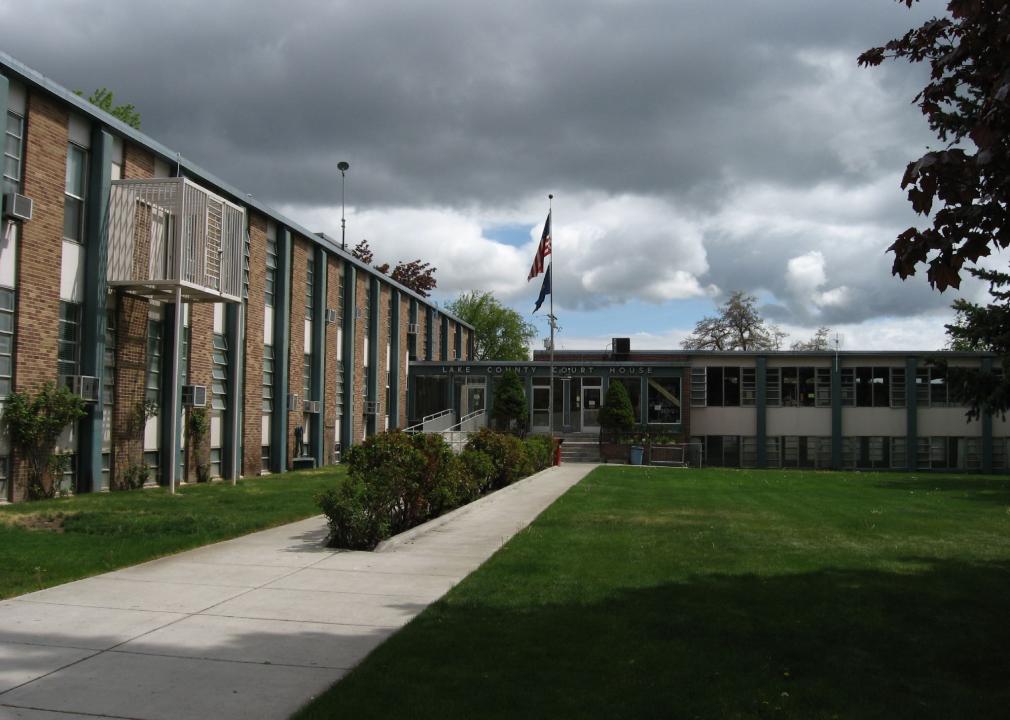
Ken L. // Wikimedia Commons
#24. Lake County
– Index: 0.155
– Total population: 7,837
– White: 91.8% (7,193)
– Black or African American: 0.3% (27)
– American Indian and Alaska Native: 2.5% (199)
– Asian: 1.1% (85)
– Native Hawaiian and other Pacific Islander: 0.0% (0)
– 2 or more races: 3.6% (283)
– Some other Race: 0.6% (50)
Williamborg // Wikimedia Commons
#23. Union County
– Index: 0.157
– Total population: 26,337
– White: 91.7% (24,158)
– Black or African American: 0.8% (198)
– American Indian and Alaska Native: 1.2% (329)
– Asian: 1.1% (297)
– Native Hawaiian and other Pacific Islander: 1.5% (385)
– 2 or more races: 2.9% (769)
– Some other Race: 0.8% (201)
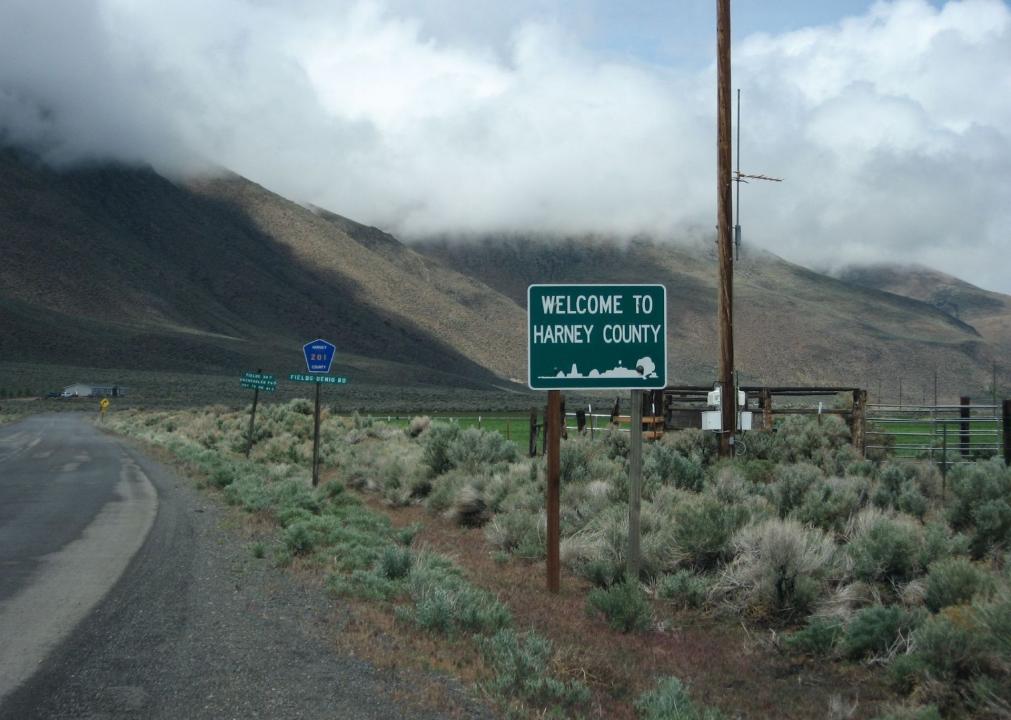
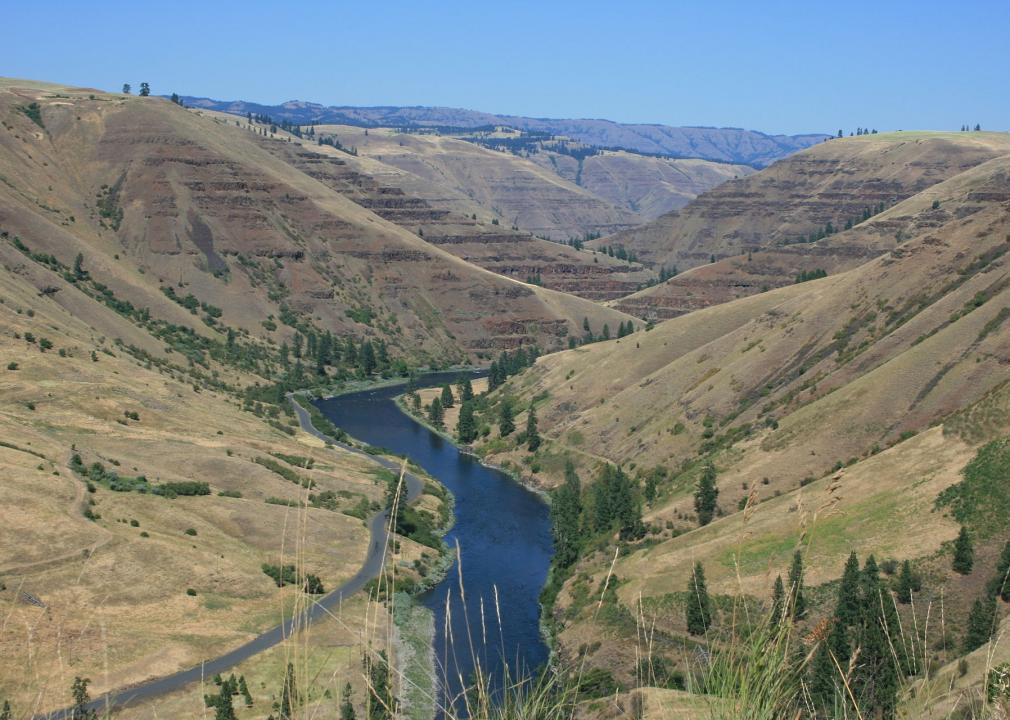
Ken L. // Wikimedia Commons
#22. Harney County
– Index: 0.157
– Total population: 7,267
– White: 91.6% (6,654)
– Black or African American: 0.5% (35)
– American Indian and Alaska Native: 1.5% (107)
– Asian: 0.0% (0)
– Native Hawaiian and other Pacific Islander: 0.0% (2)
– 2 or more races: 6.3% (460)
– Some other Race: 0.1% (9)
You may also like: Highest-earning counties in Oregon
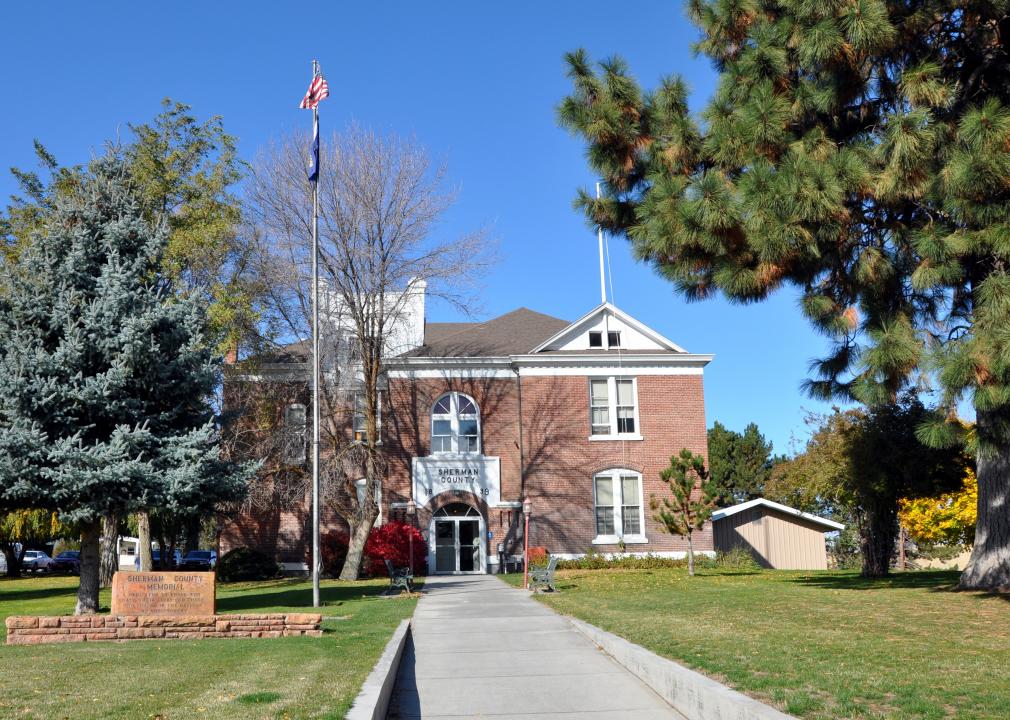
Finetooth // Wikimedia Commons
#21. Sherman County
– Index: 0.158
– Total population: 1,642
– White: 91.6% (1,504)
– Black or African American: 0.2% (3)
– American Indian and Alaska Native: 0.7% (12)
– Asian: 0.1% (2)
– Native Hawaiian and other Pacific Islander: 1.4% (23)
– 2 or more races: 5.2% (86)
– Some other Race: 0.7% (12)
Little Mountain 5 // Wikicommons
#20. Jackson County
– Index: 0.164
– Total population: 216,574
– White: 91.3% (197,752)
– Black or African American: 0.7% (1,486)
– American Indian and Alaska Native: 1.3% (2,740)
– Asian: 1.3% (2,837)
– Native Hawaiian and other Pacific Islander: 0.3% (727)
– 2 or more races: 3.7% (7,964)
– Some other Race: 1.4% (3,068)
Manuela Durson // Shutterstock
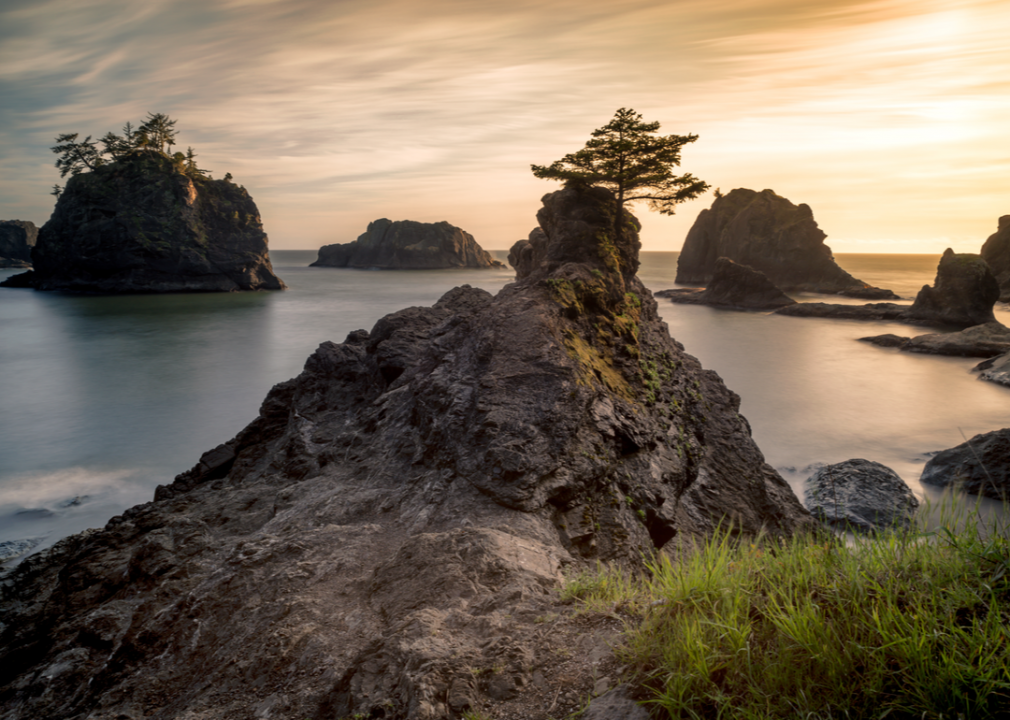
#19. Curry County
– Index: 0.170
– Total population: 22,650
– White: 90.9% (20,583)
– Black or African American: 0.4% (99)
– American Indian and Alaska Native: 1.5% (336)
– Asian: 0.5% (118)
– Native Hawaiian and other Pacific Islander: 0.1% (12)
– 2 or more races: 6.3% (1,436)
– Some other Race: 0.3% (66)
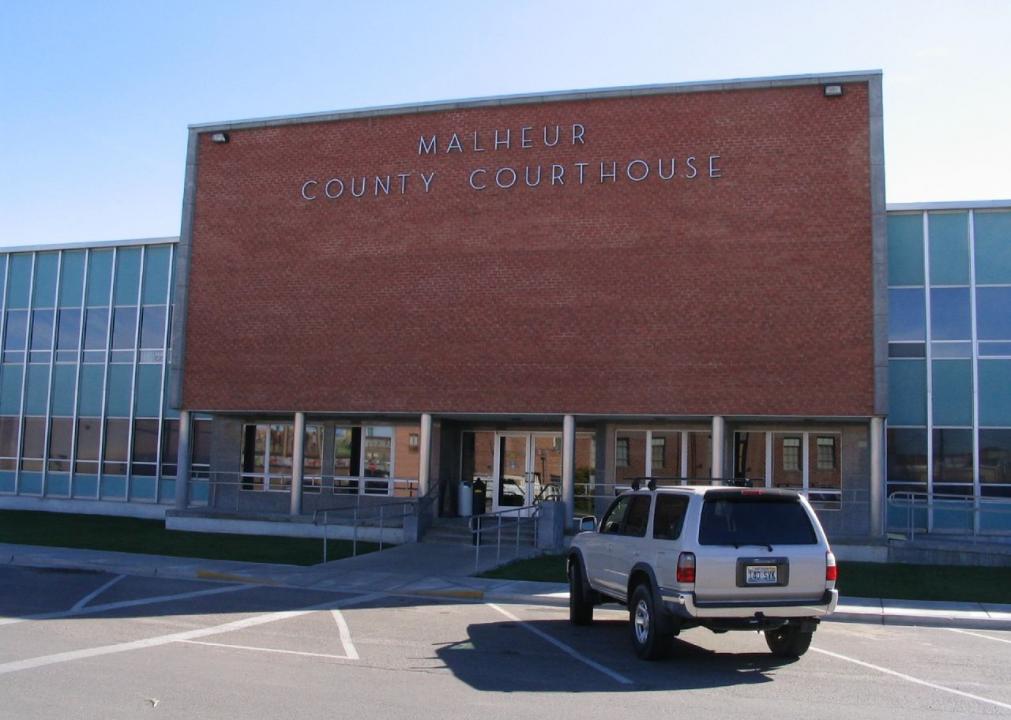
Ken L. from Reno, Nevada, USA // Wikimedia Commons
#18. Malheur County
– Index: 0.192
– Total population: 30,412
– White: 89.7% (27,291)
– Black or African American: 1.1% (345)
– American Indian and Alaska Native: 1.3% (385)
– Asian: 1.4% (430)
– Native Hawaiian and other Pacific Islander: 0.1% (41)
– 2 or more races: 3.0% (918)
– Some other Race: 3.3% (1,002)
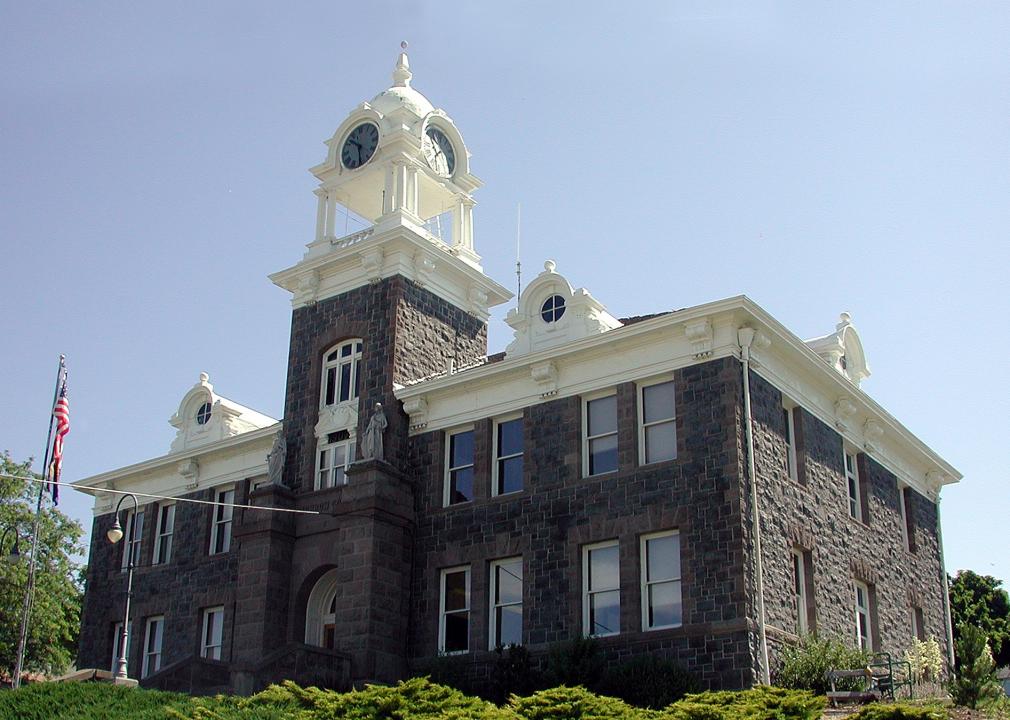
Finetooth // Wikimedia Commons
#17. Morrow County
– Index: 0.193
– Total population: 11,303
– White: 89.6% (10,131)
– Black or African American: 0.3% (30)
– American Indian and Alaska Native: 1.4% (153)
– Asian: 0.6% (70)
– Native Hawaiian and other Pacific Islander: 0.5% (58)
– 2 or more races: 3.1% (348)
– Some other Race: 4.5% (513)
You may also like: Biggest sources of immigrants to Oregon
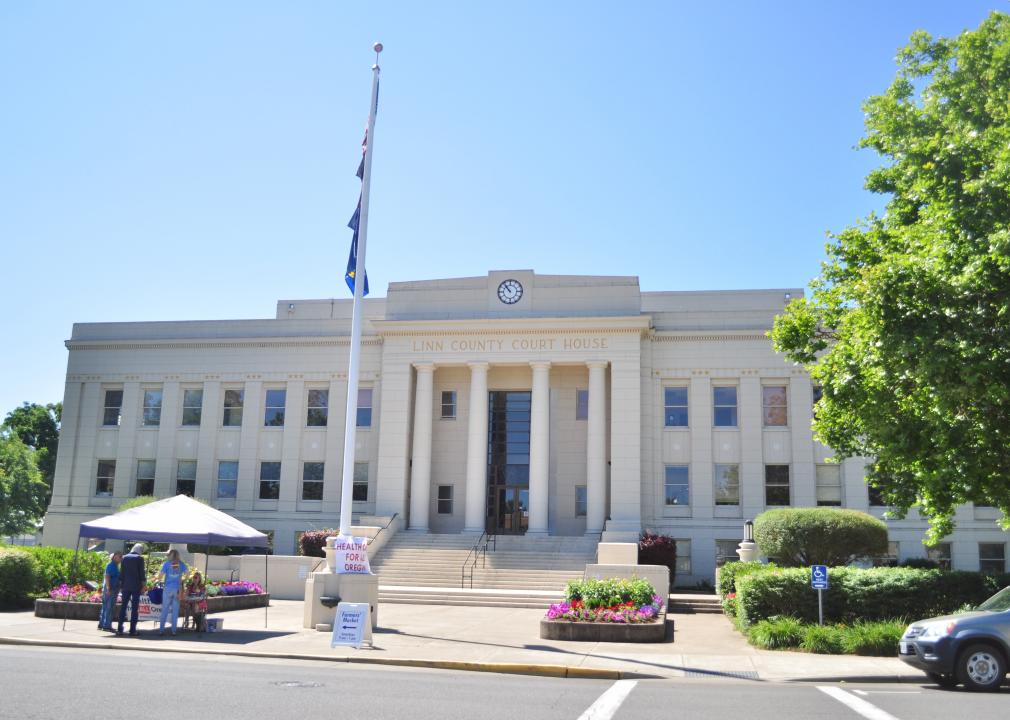
Jmabel // Wikimedia Commons
#16. Linn County
– Index: 0.194
– Total population: 125,048
– White: 89.6% (112,036)
– Black or African American: 0.5% (627)
– American Indian and Alaska Native: 1.0% (1,192)
– Asian: 1.1% (1,344)
– Native Hawaiian and other Pacific Islander: 0.1% (123)
– 2 or more races: 4.6% (5,729)
– Some other Race: 3.2% (3,997)
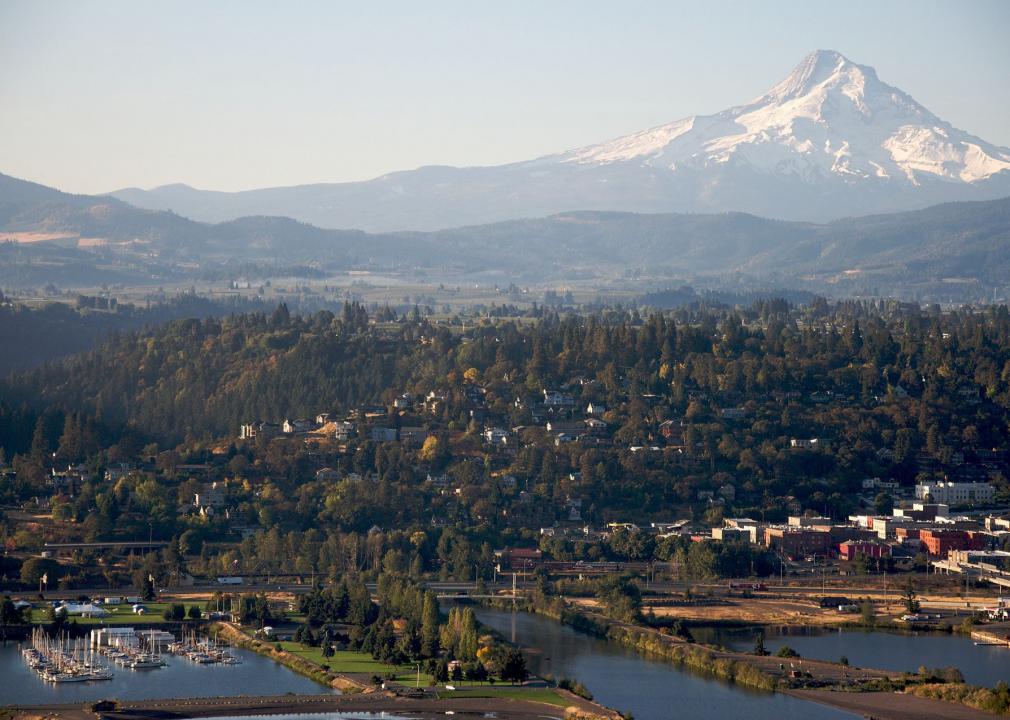
Sam Beebe // Wikimedia Commons
#15. Hood River County
– Index: 0.203
– Total population: 23,209
– White: 89.1% (20,679)
– Black or African American: 0.6% (136)
– American Indian and Alaska Native: 0.7% (152)
– Asian: 1.7% (383)
– Native Hawaiian and other Pacific Islander: 0.0% (0)
– 2 or more races: 3.7% (863)
– Some other Race: 4.3% (996)
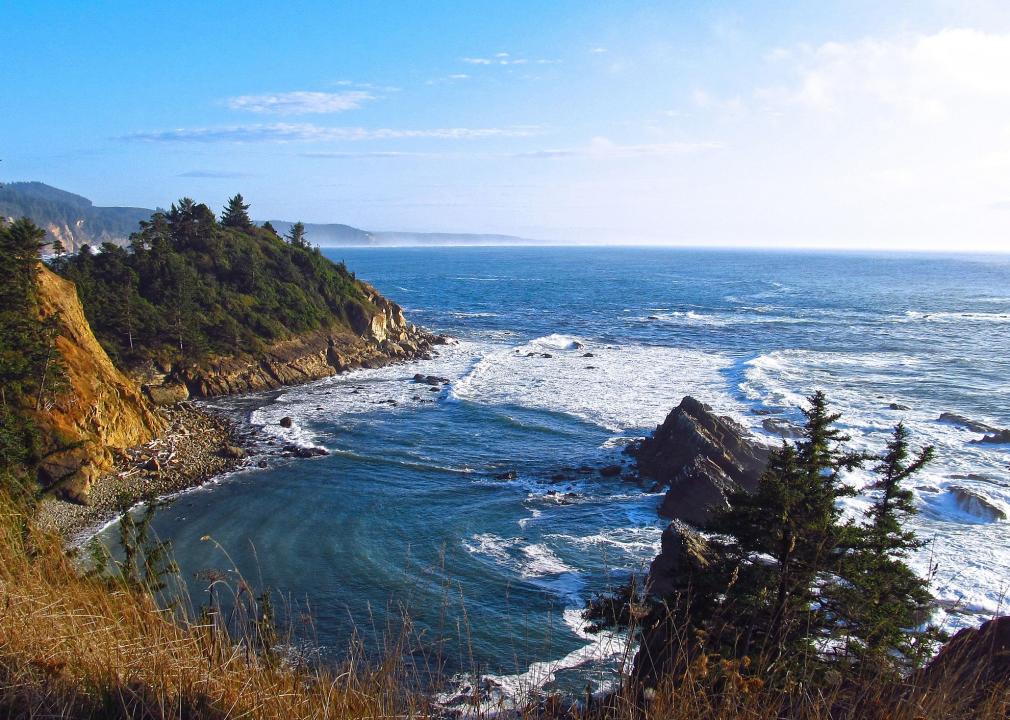
Debbie Tegtmeier // Wikimedia Commons
#14. Coos County
– Index: 0.214
– Total population: 63,686
– White: 88.4% (56,319)
– Black or African American: 0.5% (327)
– American Indian and Alaska Native: 2.1% (1,349)
– Asian: 1.0% (652)
– Native Hawaiian and other Pacific Islander: 0.1% (33)
– 2 or more races: 5.8% (3,662)
– Some other Race: 2.1% (1,344)
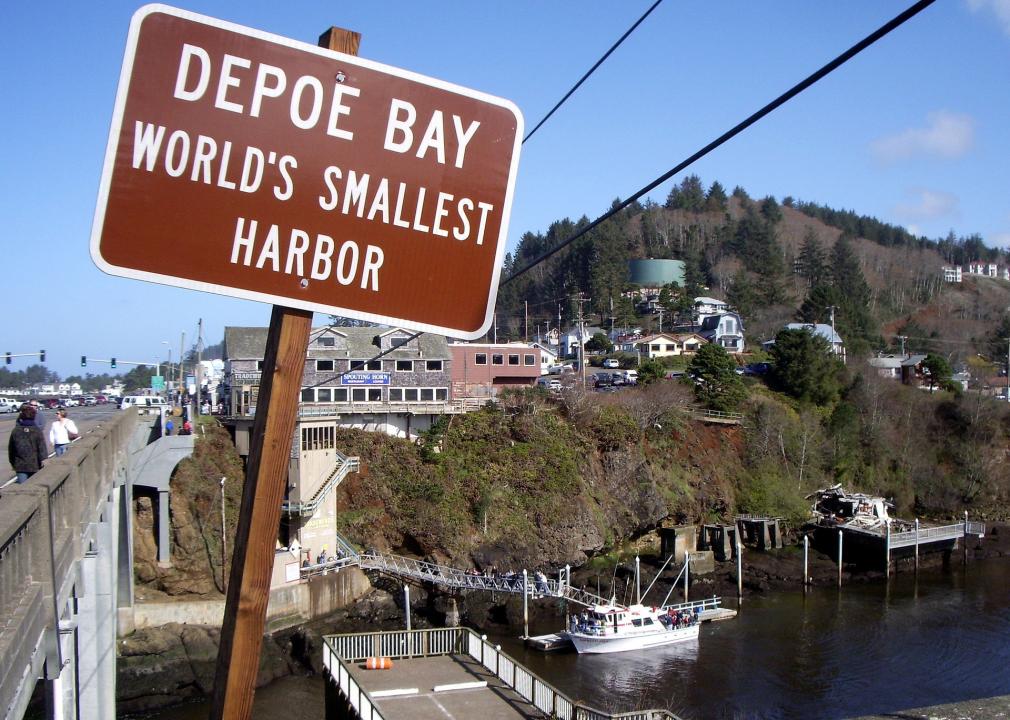
EncMstr // Wikimedia Commons
#13. Lincoln County
– Index: 0.218
– Total population: 48,547
– White: 88.2% (42,835)
– Black or African American: 0.6% (271)
– American Indian and Alaska Native: 2.8% (1,358)
– Asian: 1.2% (603)
– Native Hawaiian and other Pacific Islander: 0.2% (96)
– 2 or more races: 4.6% (2,225)
– Some other Race: 2.4% (1,159)
Cacophony // Wikimedia Commons
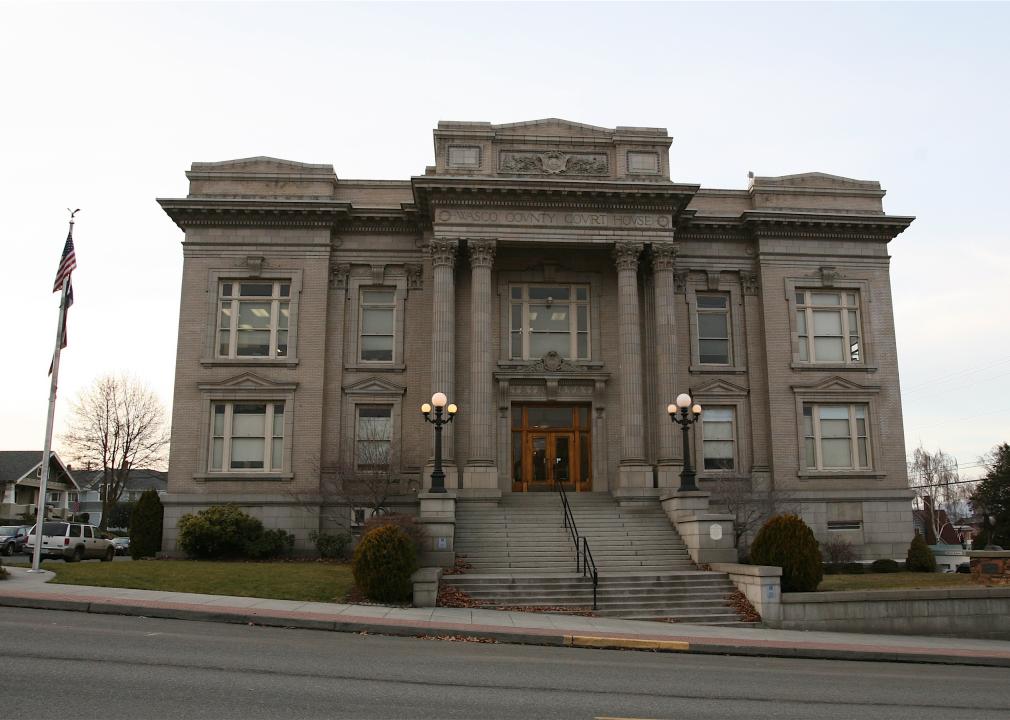
#12. Wasco County
– Index: 0.220
– Total population: 26,130
– White: 88.1% (23,029)
– Black or African American: 0.3% (80)
– American Indian and Alaska Native: 3.1% (815)
– Asian: 0.9% (238)
– Native Hawaiian and other Pacific Islander: 0.6% (154)
– 2 or more races: 3.2% (838)
– Some other Race: 3.7% (976)
You may also like: Recipes from Oregon
Bruce Fingerhood from Springfield, Oregon, US // Wikimedia Commons
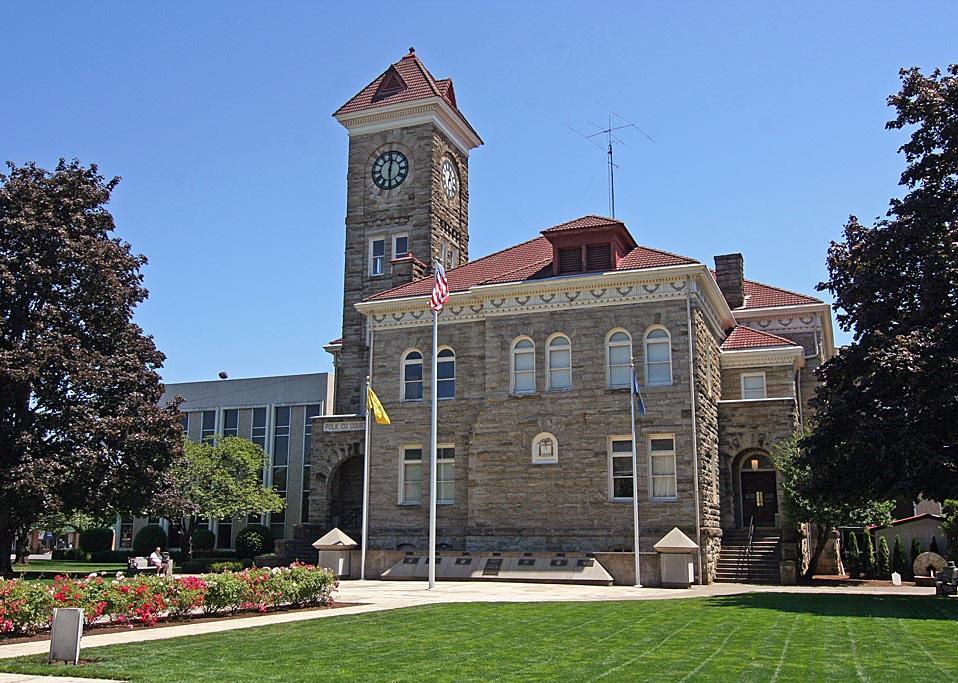
#11. Polk County
– Index: 0.221
– Total population: 83,037
– White: 88.1% (73,159)
– Black or African American: 0.8% (686)
– American Indian and Alaska Native: 2.0% (1,631)
– Asian: 1.9% (1,542)
– Native Hawaiian and other Pacific Islander: 0.5% (414)
– 2 or more races: 3.7% (3,090)
– Some other Race: 3.0% (2,515)
M.O. Stevens // Wikimedia Commons
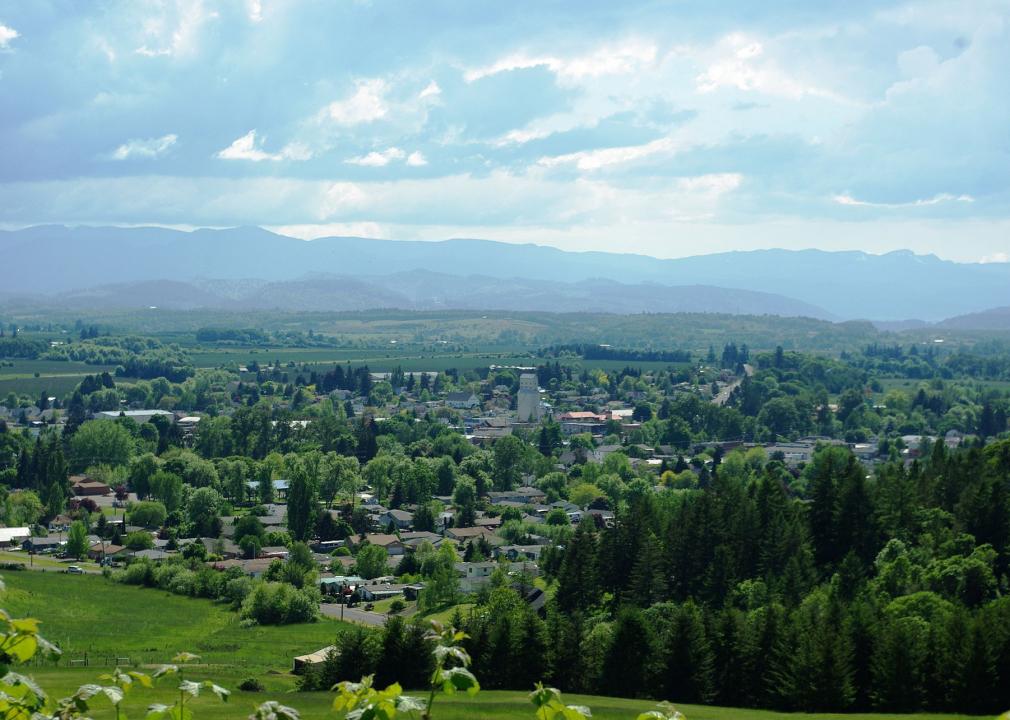
#10. Yamhill County
– Index: 0.229
– Total population: 104,831
– White: 87.5% (91,772)
– Black or African American: 0.8% (878)
– American Indian and Alaska Native: 1.2% (1,271)
– Asian: 1.5% (1,525)
– Native Hawaiian and other Pacific Islander: 0.3% (265)
– 2 or more races: 4.1% (4,332)
– Some other Race: 4.6% (4,788)
Mrgadget51 // Wikimedia Commons
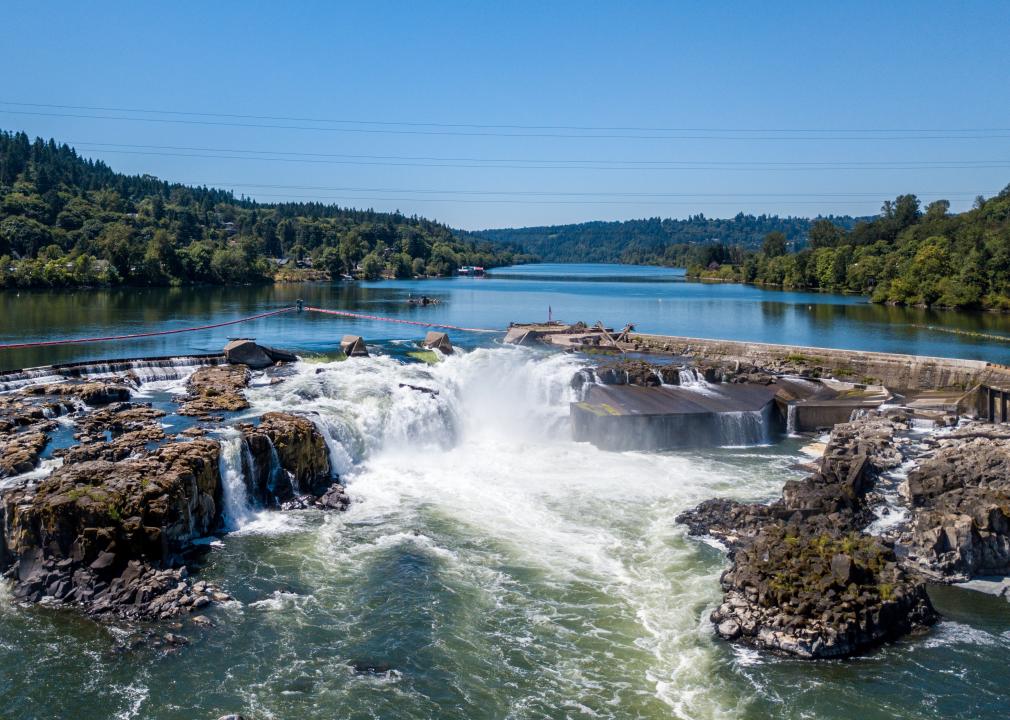
#9. Clackamas County
– Index: 0.230
– Total population: 410,463
– White: 87.5% (359,191)
– Black or African American: 0.9% (3,865)
– American Indian and Alaska Native: 0.8% (3,181)
– Asian: 4.3% (17,543)
– Native Hawaiian and other Pacific Islander: 0.3% (1,126)
– 2 or more races: 4.1% (16,885)
– Some other Race: 2.1% (8,672)
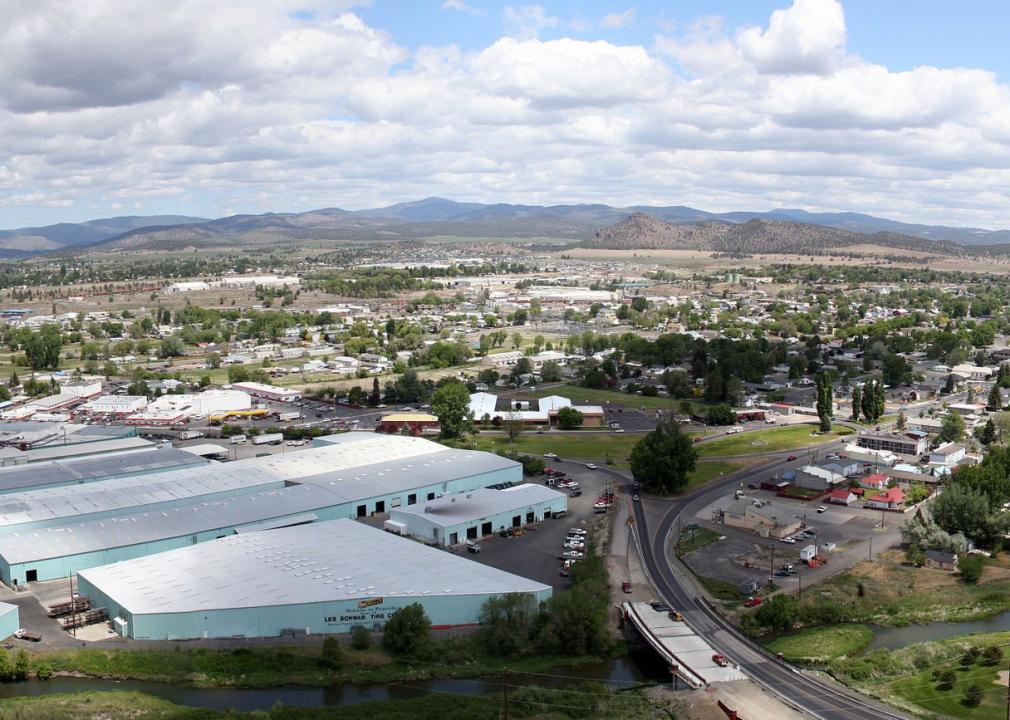
Bobjgalindo // Wikimedia Commons
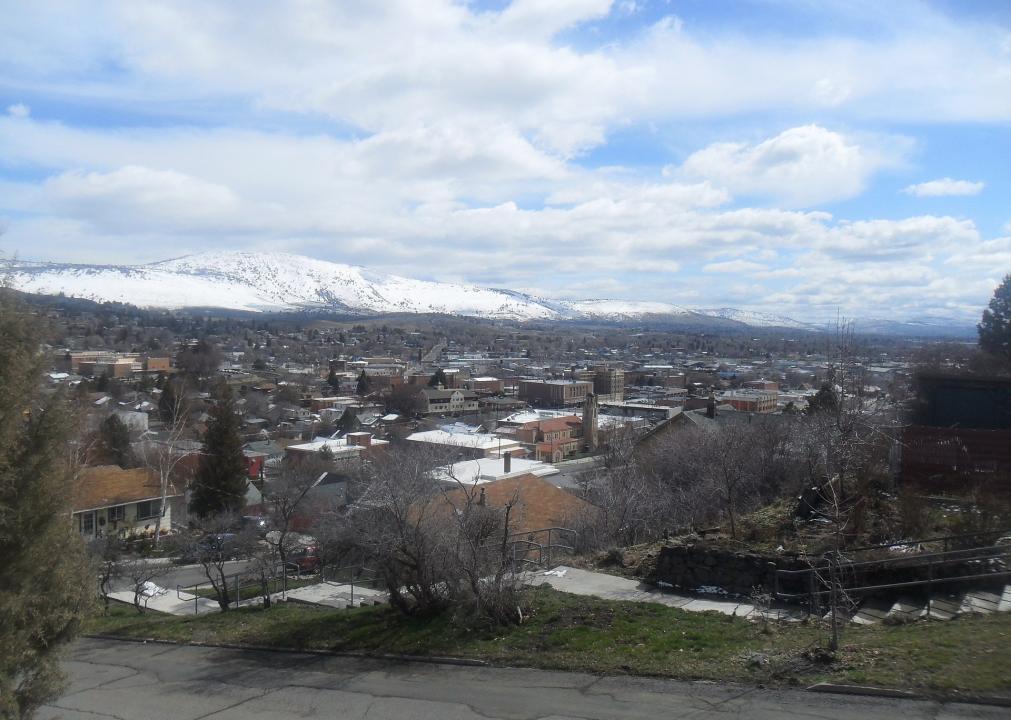
#8. Klamath County
– Index: 0.238
– Total population: 66,921
– White: 87.0% (58,240)
– Black or African American: 0.7% (483)
– American Indian and Alaska Native: 4.3% (2,906)
– Asian: 1.0% (682)
– Native Hawaiian and other Pacific Islander: 0.1% (45)
– 2 or more races: 4.5% (3,034)
– Some other Race: 2.3% (1,531)
Lauram12345 // Wikicommons
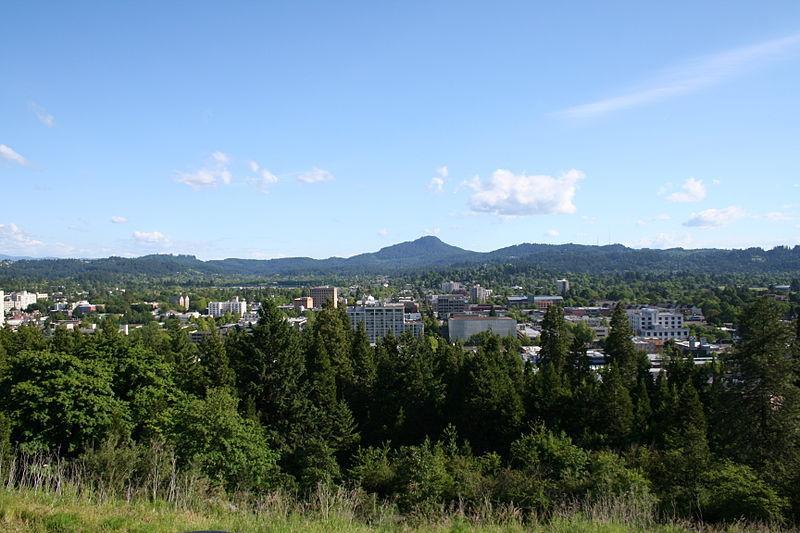
#7. Lane County
– Index: 0.246
– Total population: 373,340
– White: 86.5% (323,102)
– Black or African American: 1.1% (4,064)
– American Indian and Alaska Native: 1.1% (4,132)
– Asian: 2.7% (10,127)
– Native Hawaiian and other Pacific Islander: 0.3% (948)
– 2 or more races: 5.4% (20,059)
– Some other Race: 2.9% (10,908)
You may also like: Best counties to raise a family in Oregon
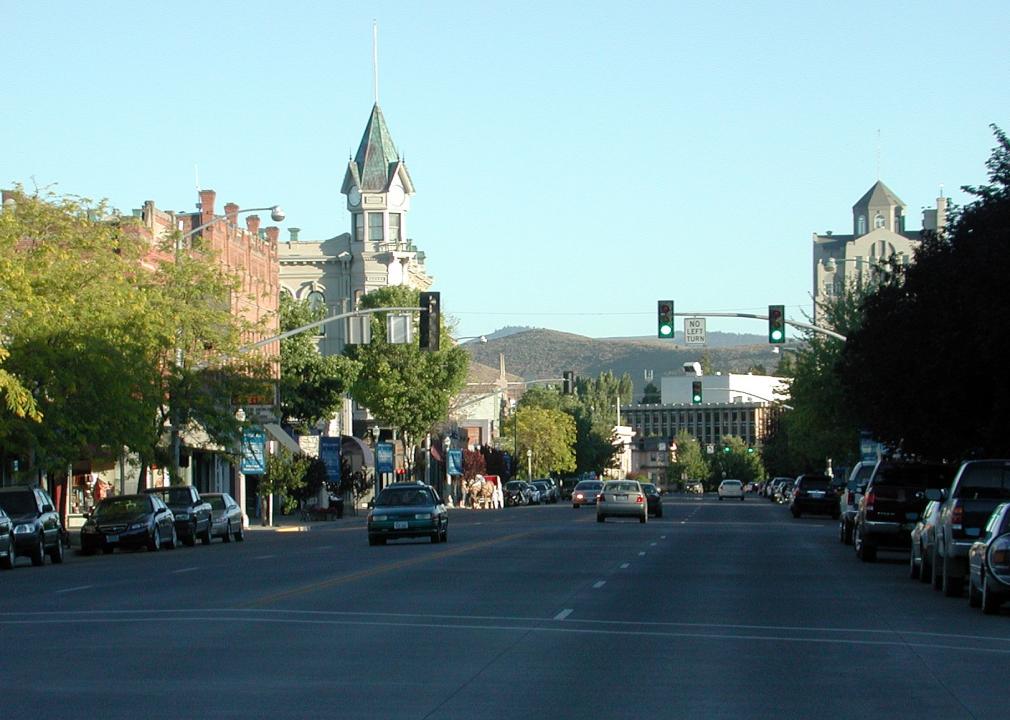
Gancayco // Wikimedia Commons
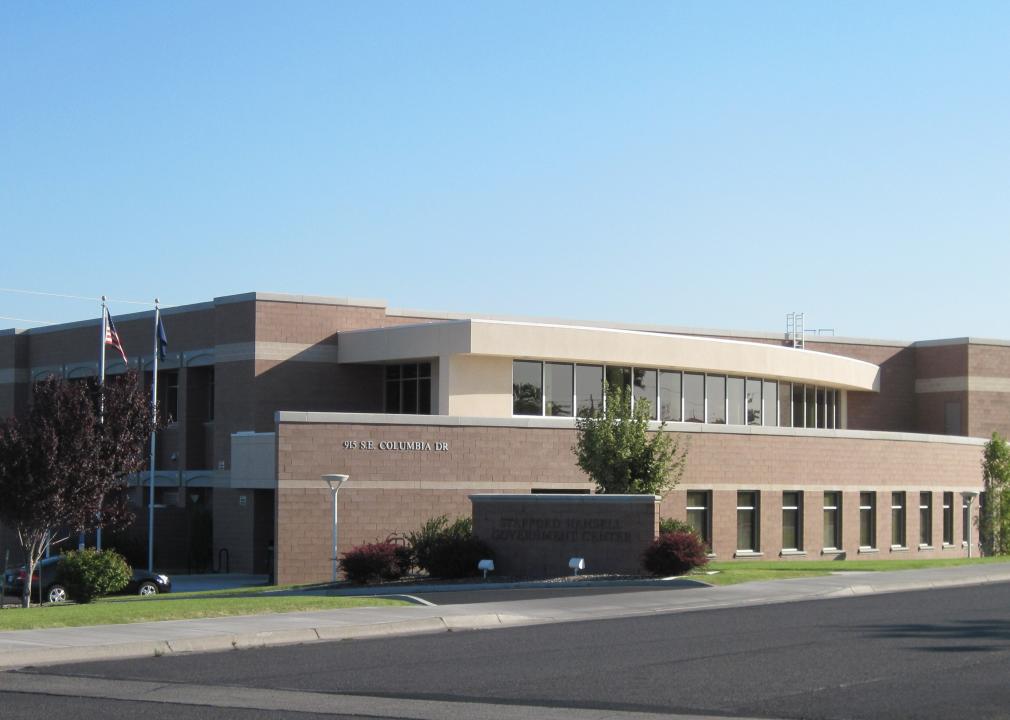
#6. Umatilla County
– Index: 0.259
– Total population: 77,129
– White: 85.8% (66,148)
– Black or African American: 1.0% (740)
– American Indian and Alaska Native: 3.2% (2,463)
– Asian: 1.0% (800)
– Native Hawaiian and other Pacific Islander: 0.3% (199)
– 2 or more races: 4.0% (3,102)
– Some other Race: 4.8% (3,677)
cpaulfell // Shutterstock
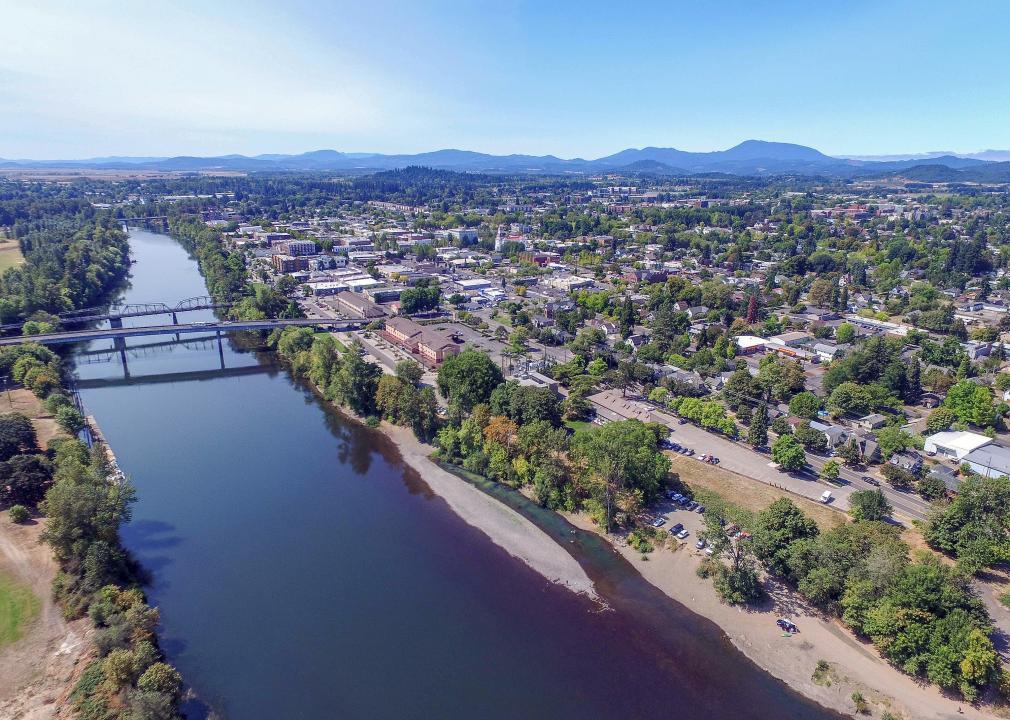
#5. Benton County
– Index: 0.275
– Total population: 91,107
– White: 84.7% (77,177)
– Black or African American: 1.1% (982)
– American Indian and Alaska Native: 0.7% (605)
– Asian: 7.2% (6,528)
– Native Hawaiian and other Pacific Islander: 0.2% (218)
– 2 or more races: 4.3% (3,901)
– Some other Race: 1.9% (1,696)
Edmund Garman // Flickr
#4. Marion County
– Index: 0.330
– Total population: 339,641
– White: 81.3% (275,985)
– Black or African American: 1.2% (4,194)
– American Indian and Alaska Native: 0.9% (2,999)
– Asian: 2.1% (6,999)
– Native Hawaiian and other Pacific Islander: 0.9% (3,019)
– 2 or more races: 6.6% (22,385)
– Some other Race: 7.1% (24,060)
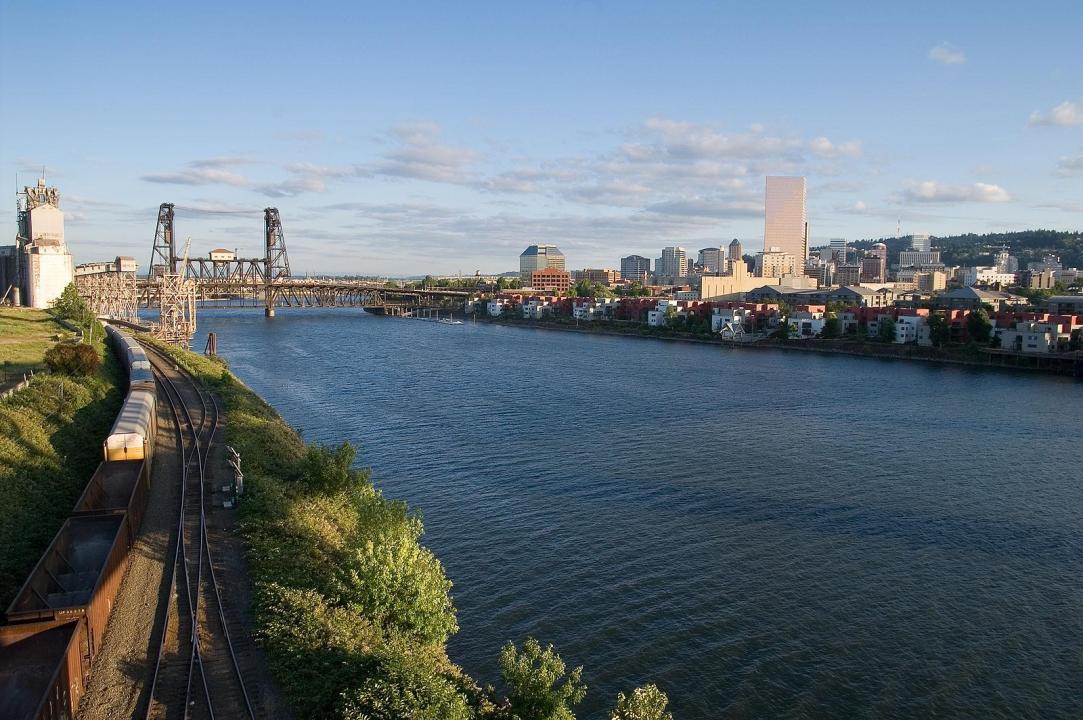
Stuart Seeger // Wikicommons
#3. Multnomah County
– Index: 0.380
– Total population: 804,606
– White: 77.9% (627,124)
– Black or African American: 5.5% (43,988)
– American Indian and Alaska Native: 0.9% (7,217)
– Asian: 7.4% (59,715)
– Native Hawaiian and other Pacific Islander: 0.6% (5,199)
– 2 or more races: 5.4% (43,346)
– Some other Race: 2.2% (18,017)

M.O. Stevens // Wikimedia Commons
#2. Washington County
– Index: 0.407
– Total population: 589,481
– White: 75.9% (447,201)
– Black or African American: 2.0% (11,897)
– American Indian and Alaska Native: 0.6% (3,446)
– Asian: 10.6% (62,545)
– Native Hawaiian and other Pacific Islander: 0.4% (2,514)
– 2 or more races: 5.4% (31,984)
– Some other Race: 5.1% (29,894)
You may also like: Highest-rated Class of 2021 football recruits from Oregon
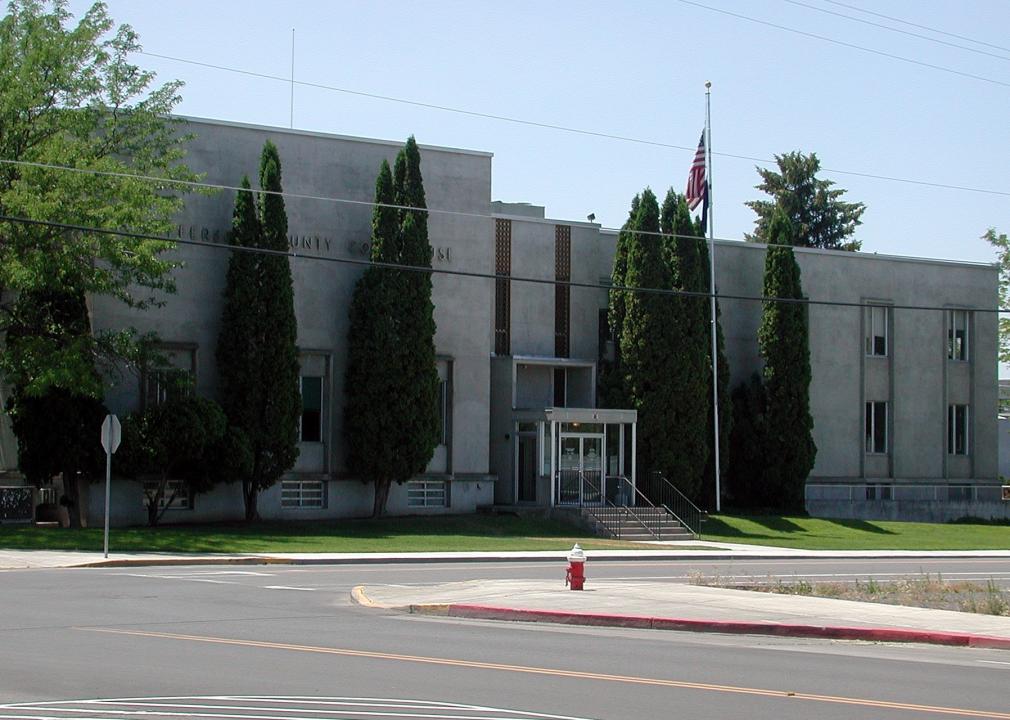
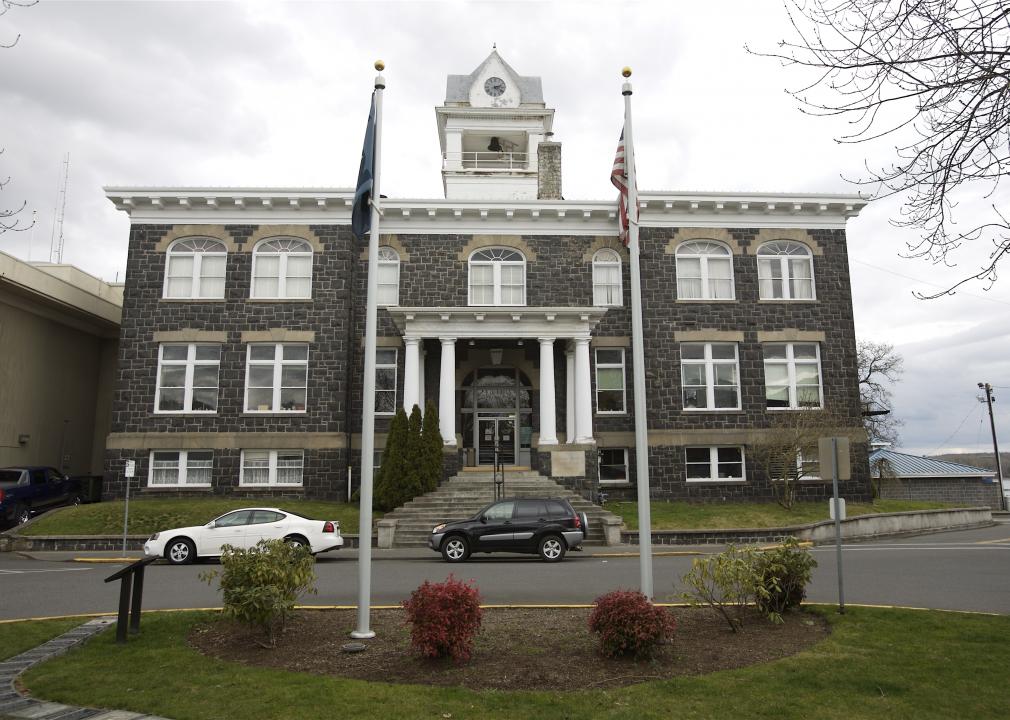
Finetooth // Wikimedia Commons
#1. Jefferson County
– Index: 0.463
– Total population: 23,607
– White: 70.8% (16,713)
– Black or African American: 0.8% (182)
– American Indian and Alaska Native: 17.4% (4,106)
– Asian: 0.6% (146)
– Native Hawaiian and other Pacific Islander: 0.1% (22)
– 2 or more races: 4.0% (937)
– Some other Race: 6.4% (1,501)
