Counties with the highest rates of strokes in Oregon

Canva
Counties with the highest rates of strokes in Oregon
For more than a century, strokes have been a leading cause of death among U.S. adults, according to the Centers for Disease Control and Prevention. The sudden cerebrovascular event affects nearly 800,000 Americans annually and is also a leading cause of disability.
The tragedy of the nation’s stroke rate is amplified by its preventability. Four out of five strokes are preventable, according to the CDC.
Stacker used CDC data to list the counties in Oregon with the highest prevalence of stroke. Data is based on estimates compiled by the CDC, with the confidence range included for each county. Additional data on death rates between 2018 and 2020 for the two most common types of strokes, ischemic and hemorrhagic, are also included for each county. In cases of a tie, the ischemic and hemorrhagic stroke death rates are used as tiebreakers.
An ischemic stroke occurs when a blood clot blocks an artery leading to the brain. These account for 87% of strokes in the U.S. In hemorrhagic strokes, a ruptured blood vessel causes active bleeding in the brain. These kinds of strokes are often more serious.
When someone suffers a stroke, a swift medical response can have a major impact on their recovery. Early treatment by doctors can help dissolve the clot in ischemic strokes and limit the expansion of the brain bleed in hemorrhagic strokes. Knowing the signs—including drooping on one side of the face, inability to lift one arm or leg, and slurred speech—and calling 911 immediately can help save lives.
Research shows that the first one to three months after a stroke are the most crucial for retraining the brain to complete tasks that once felt second nature, with emerging research suggesting progress does not halt after six months. Ongoing therapy has an impact on stroke victims throughout their recovery journey, even if progress slows. Despite these promising findings, many health insurance plans limit how much therapy is covered and make regular, long-term treatment more challenging for survivors of strokes and their families.
The rate of strokes is most prominent throughout the Southeast; public health experts have termed the region the “stroke belt” for its higher death rates than the national average. Racial disparities are also prominent, with Black people experiencing and dying from strokes at higher rates, according to the Office of Minority Health.
Preventative care is critical for lowering stroke risk, even for people who otherwise feel healthy.
Annual check-ins with a physician can help track risk factors including high cholesterol, diabetes, and obesity. Hypertension, or high blood pressure, is the leading cause of stroke, and it can be caused by overconsumption of salty foods, drinking alcohol, smoking, stress, and genetics. High blood pressure has less obvious symptoms, but people can regularly track their metrics using at-home blood pressure cuffs to know if they need to talk to their doctor sooner than scheduled. The American Heart Association has recommendations for which readings require medical intervention.
Read on to see which counties had the highest rates of strokes in Oregon.
![]()
Yanqiang Dai // Shutterstock
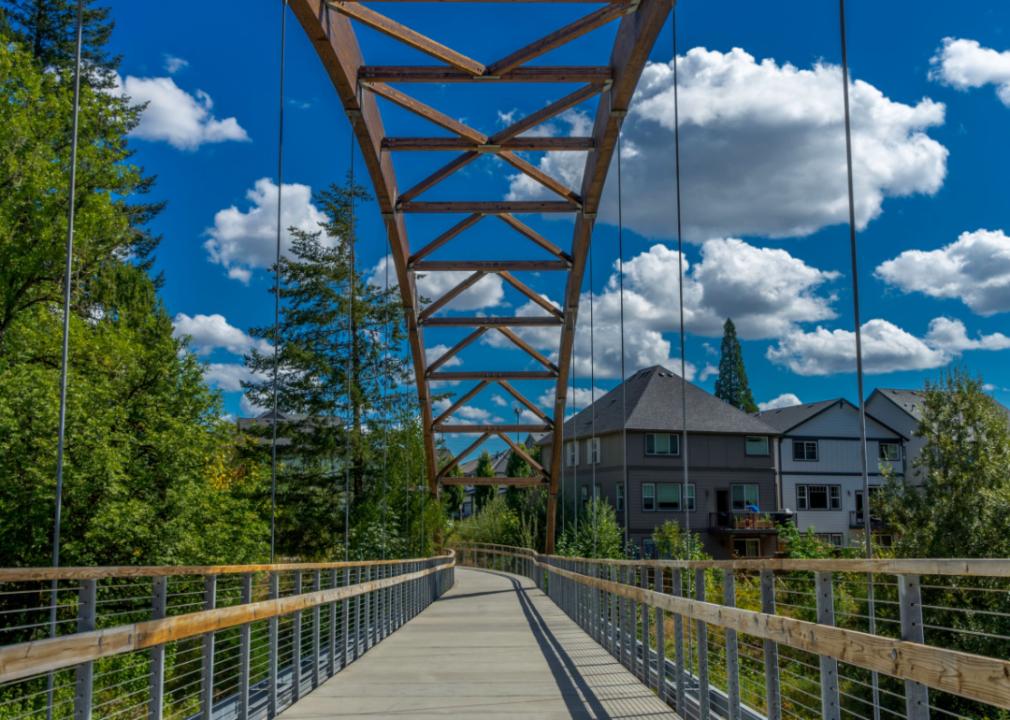
#36. Washington County
– Age-adjusted rate of all strokes among adults, estimates for 2021: 2.3% (range between 2.0% and 2.7%)
– Death rate for ischemic strokes, 2018-20: 15.6 per 100K people
– Death rate for hemorrhagic strokes, 2018-20: 7.2 per 100K people

Canva
#35. Clackamas County
– Age-adjusted rate of all strokes among adults, estimates for 2021: 2.4% (range between 2.1% and 2.7%)
– Death rate for ischemic strokes, 2018-20: 15.4 per 100K people
– Death rate for hemorrhagic strokes, 2018-20: 7.9 per 100K people
Josemaria Toscano // Shutterstock
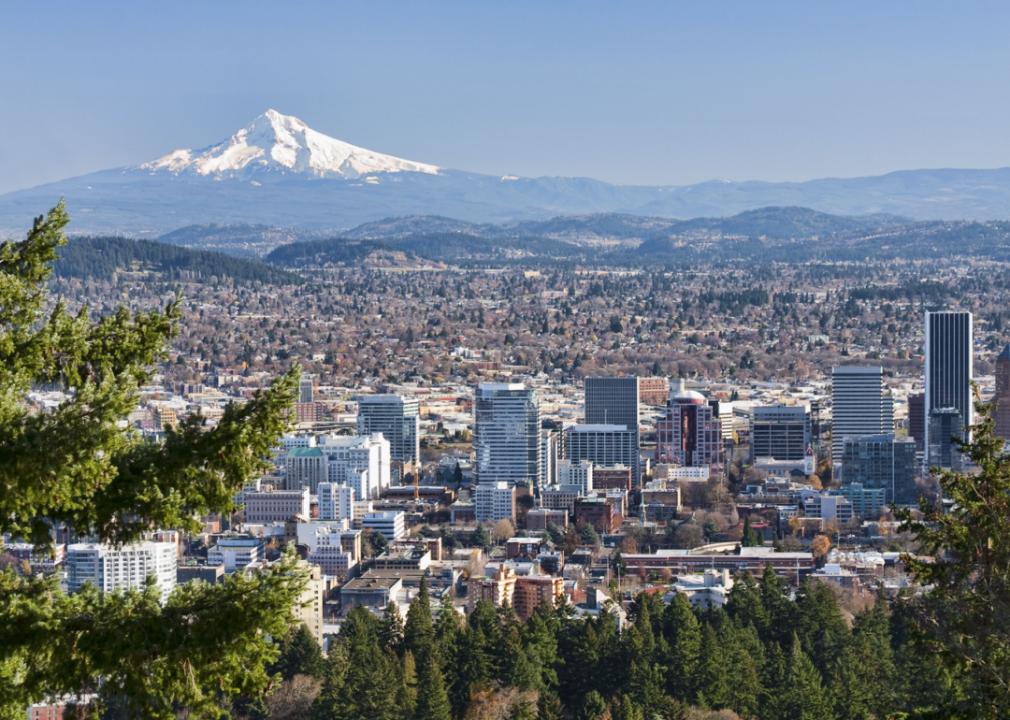
#34. Multnomah County
– Age-adjusted rate of all strokes among adults, estimates for 2021: 2.5% (range between 2.2% and 2.8%)
– Death rate for ischemic strokes, 2018-20: 15.2 per 100K people
– Death rate for hemorrhagic strokes, 2018-20: 8.3 per 100K people
cpaulfell // Shutterstock
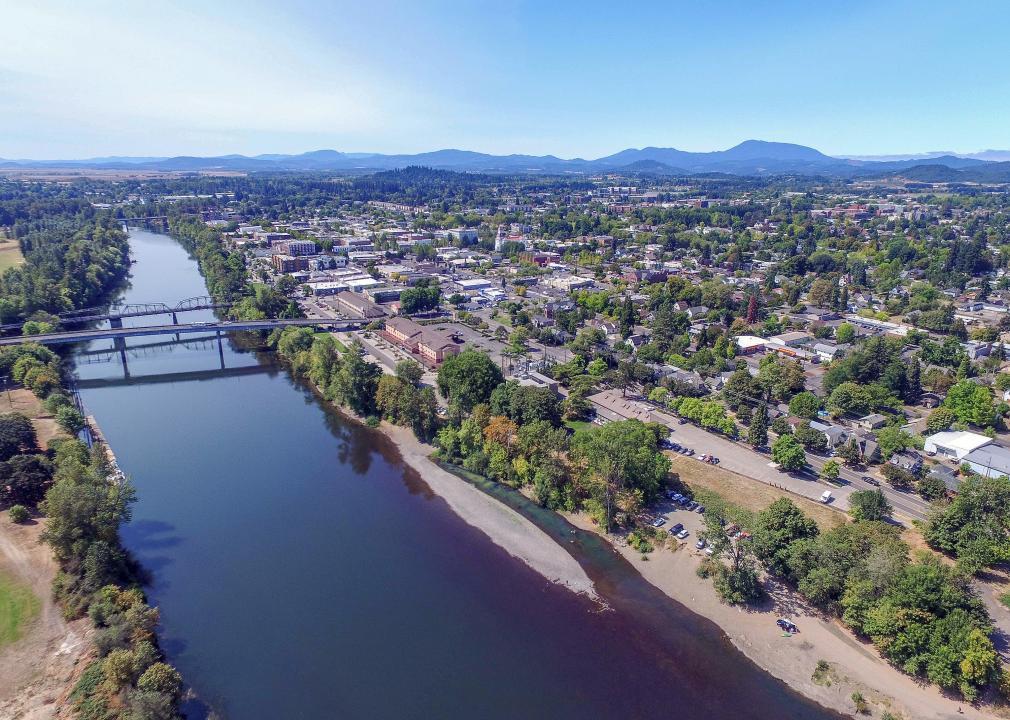
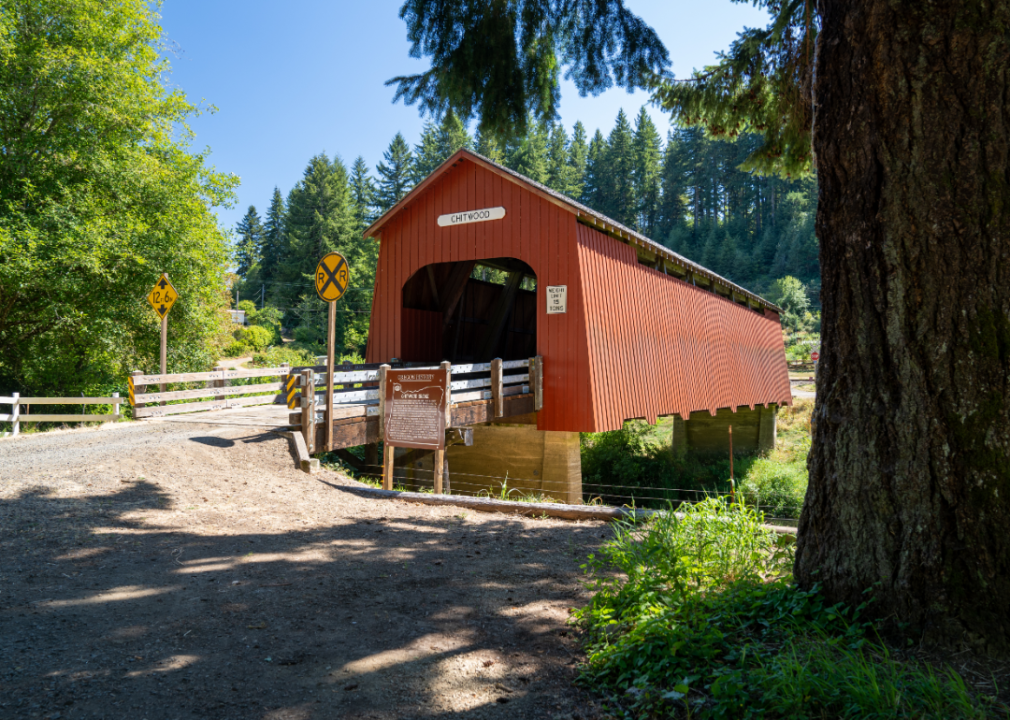
#33. Benton County
– Age-adjusted rate of all strokes among adults, estimates for 2021: 2.5% (range between 2.2% and 2.9%)
– Death rate for ischemic strokes, 2018-20: 17.2 per 100K people
– Death rate for hemorrhagic strokes, 2018-20: 8.3 per 100K people
Canva
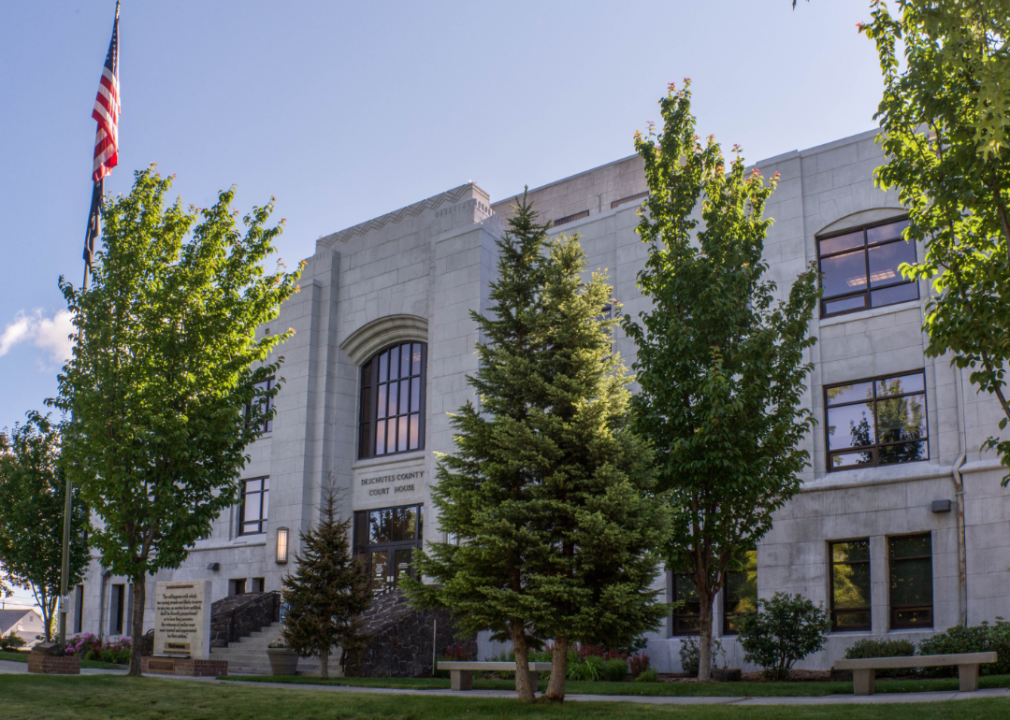
#32. Deschutes County
– Age-adjusted rate of all strokes among adults, estimates for 2021: 2.5% (range between 2.1% and 2.8%)
– Death rate for ischemic strokes, 2018-20: 18.2 per 100K people
– Death rate for hemorrhagic strokes, 2018-20: 7.5 per 100K people
You may also like: Most popular baby names for girls of the last decade in Oregon
Canva
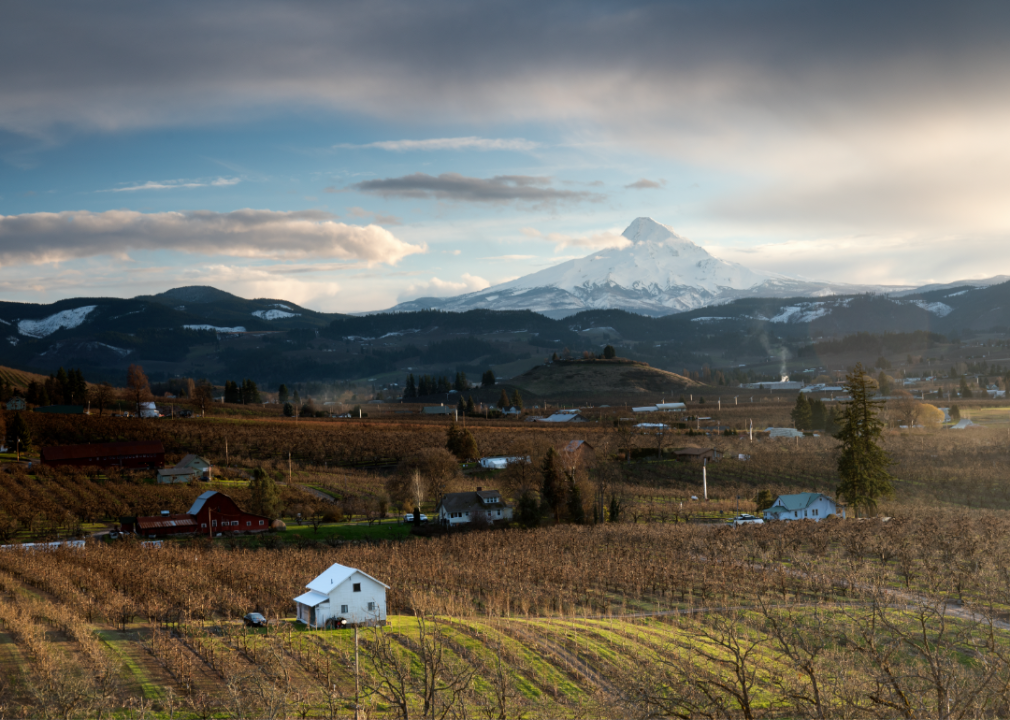
#31. Hood River County
– Age-adjusted rate of all strokes among adults, estimates for 2021: 2.6% (range between 2.3% and 3.0%)
– Death rate for ischemic strokes, 2018-20: 16.1 per 100K people
– Death rate for hemorrhagic strokes, 2018-20: 8.3 per 100K people
Canva
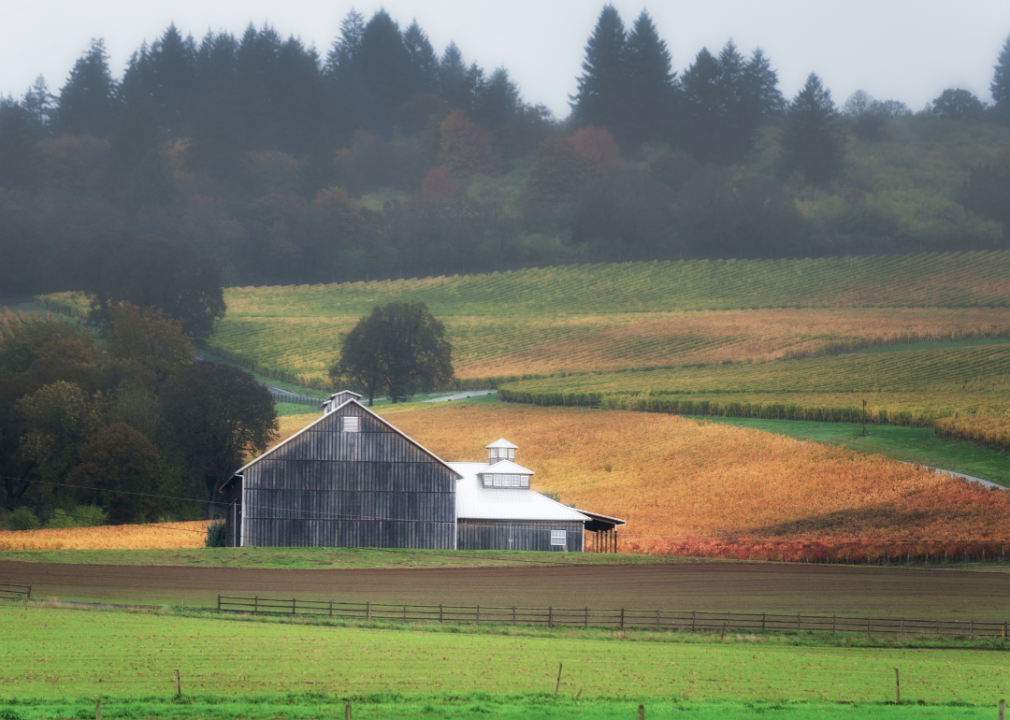
#30. Yamhill County
– Age-adjusted rate of all strokes among adults, estimates for 2021: 2.6% (range between 2.3% and 3.0%)
– Death rate for ischemic strokes, 2018-20: 17.2 per 100K people
– Death rate for hemorrhagic strokes, 2018-20: 8.1 per 100K people
Canva
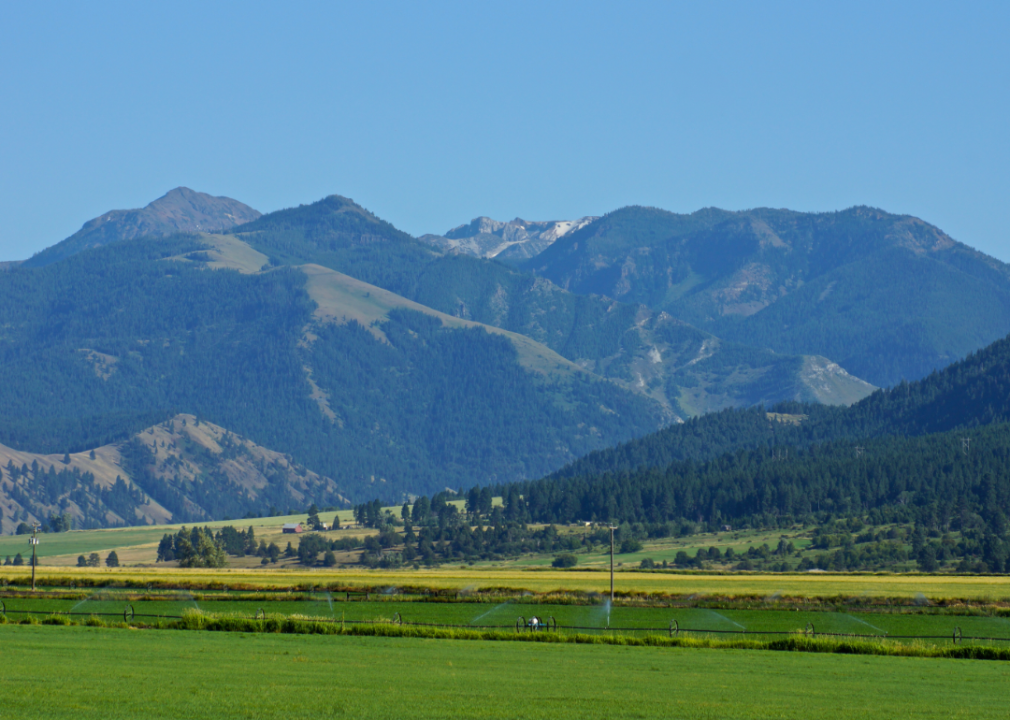
#29. Wallowa County
– Age-adjusted rate of all strokes among adults, estimates for 2021: 2.6% (range between 2.2% and 2.9%)
– Death rate for ischemic strokes, 2018-20: 19.5 per 100K people
– Death rate for hemorrhagic strokes, 2018-20: 8.1 per 100K people
Canva
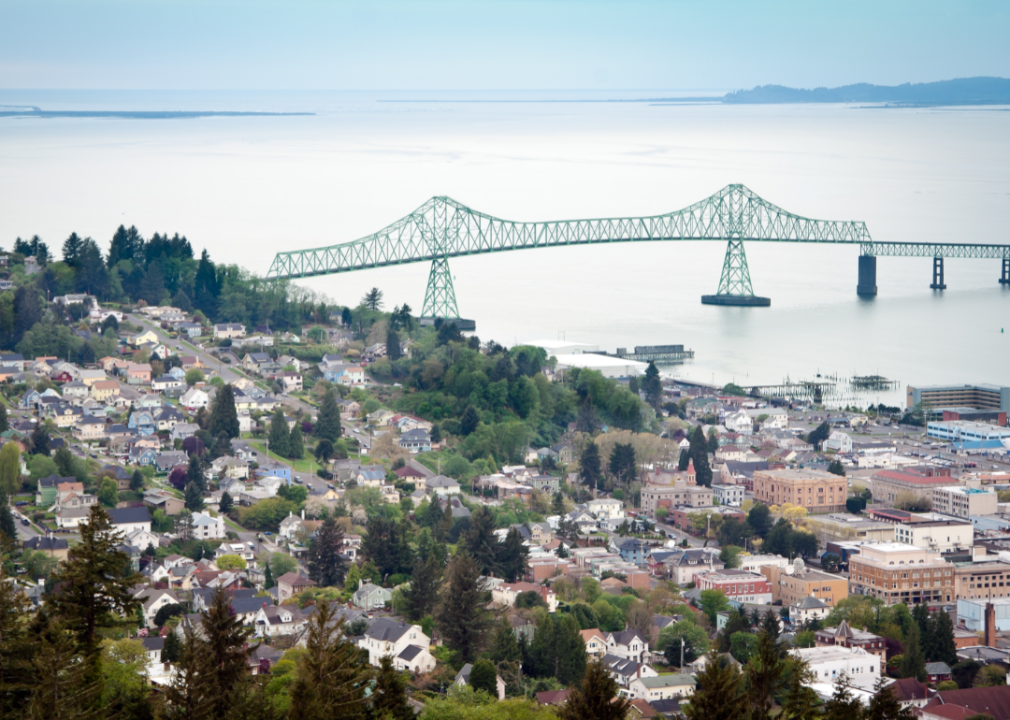
#28. Clatsop County
– Age-adjusted rate of all strokes among adults, estimates for 2021: 2.7% (range between 2.4% and 3.1%)
– Death rate for ischemic strokes, 2018-20: 14.6 per 100K people
– Death rate for hemorrhagic strokes, 2018-20: 6.5 per 100K people
Cynthia Liang // Shutterstock
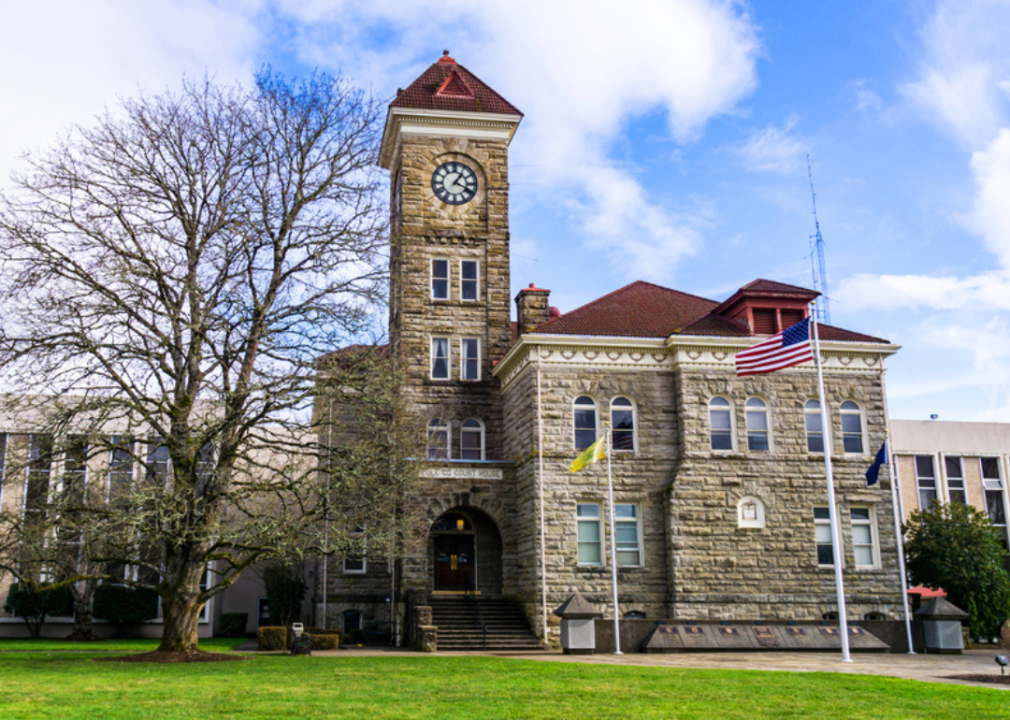
#27. Polk County
– Age-adjusted rate of all strokes among adults, estimates for 2021: 2.7% (range between 2.4% and 3.1%)
– Death rate for ischemic strokes, 2018-20: 18.5 per 100K people
– Death rate for hemorrhagic strokes, 2018-20: 9.2 per 100K people
You may also like: Counties with the highest COVID-19 vaccination rate in Oregon
kenneth korb // Shutterstock
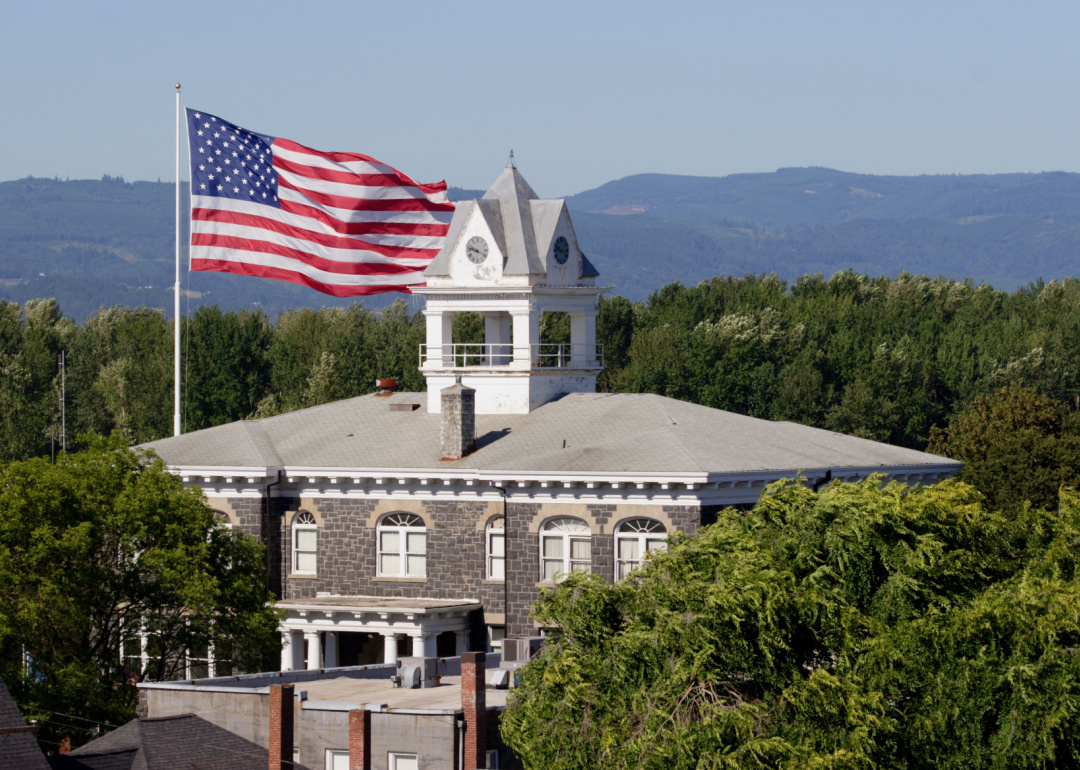
#26. Columbia County
– Age-adjusted rate of all strokes among adults, estimates for 2021: 2.8% (range between 2.4% and 3.1%)
– Death rate for ischemic strokes, 2018-20: 15.3 per 100K people
– Death rate for hemorrhagic strokes, 2018-20: 7.9 per 100K people
Canva
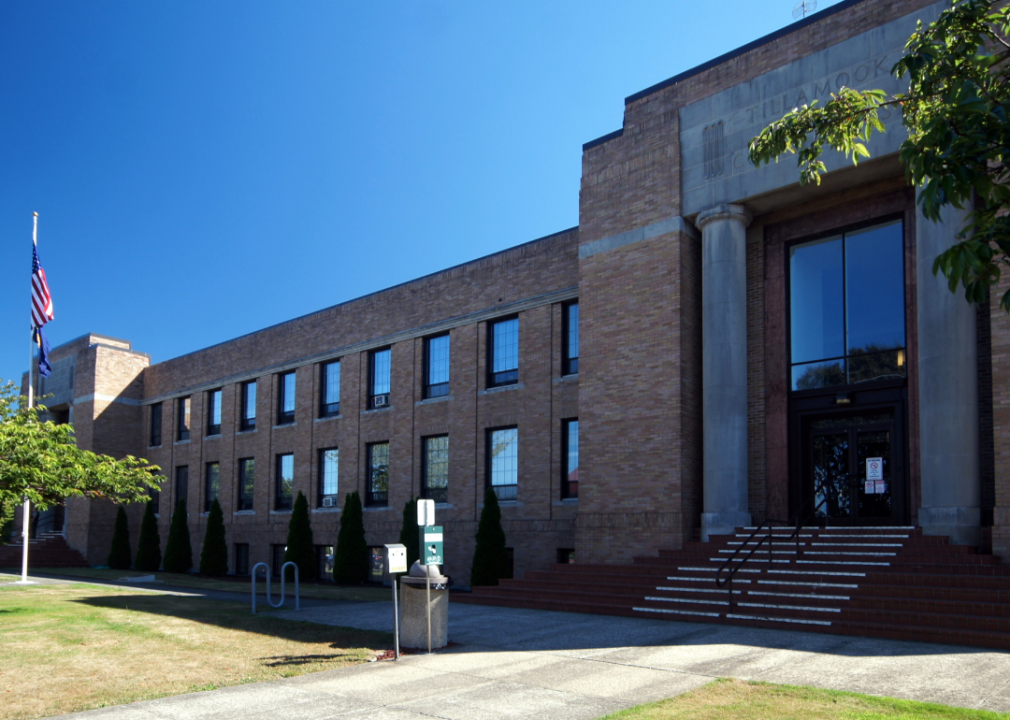
#25. Tillamook County
– Age-adjusted rate of all strokes among adults, estimates for 2021: 2.8% (range between 2.4% and 3.2%)
– Death rate for ischemic strokes, 2018-20: 15.6 per 100K people
– Death rate for hemorrhagic strokes, 2018-20: 7.2 per 100K people
Canva
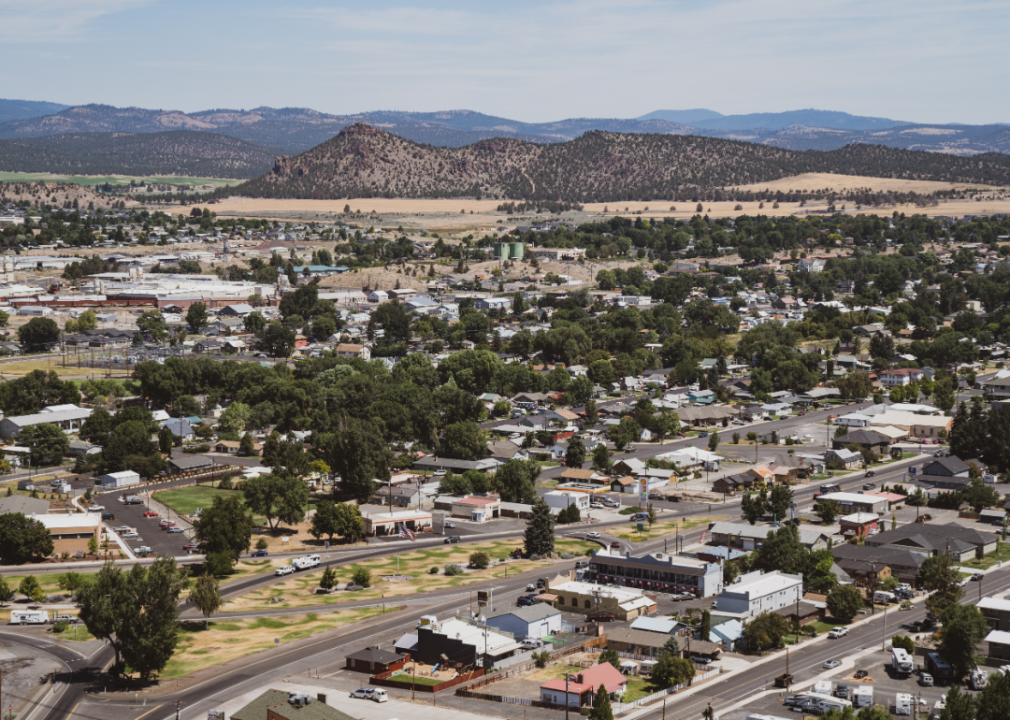
#24. Crook County
– Age-adjusted rate of all strokes among adults, estimates for 2021: 2.8% (range between 2.4% and 3.1%)
– Death rate for ischemic strokes, 2018-20: 18.1 per 100K people
– Death rate for hemorrhagic strokes, 2018-20: 6.0 per 100K people
Canva
#23. Lincoln County
– Age-adjusted rate of all strokes among adults, estimates for 2021: 2.8% (range between 2.4% and 3.2%)
– Death rate for ischemic strokes, 2018-20: 19.5 per 100K people
– Death rate for hemorrhagic strokes, 2018-20: 8.1 per 100K people
Canva
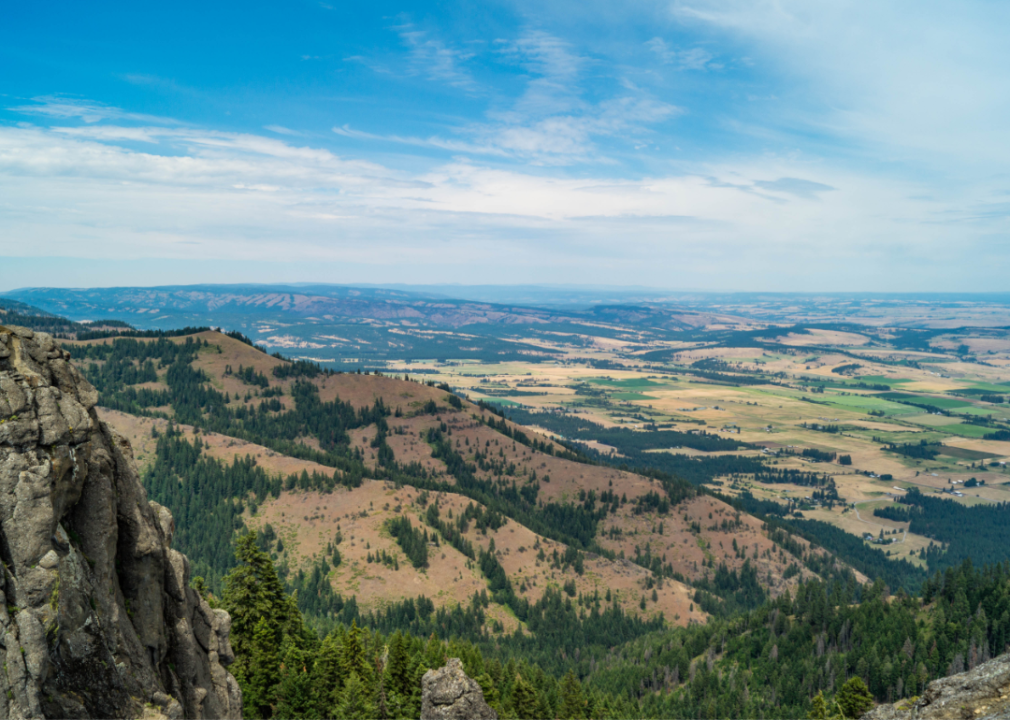
#22. Union County
– Age-adjusted rate of all strokes among adults, estimates for 2021: 2.8% (range between 2.5% and 3.2%)
– Death rate for ischemic strokes, 2018-20: 20.1 per 100K people
– Death rate for hemorrhagic strokes, 2018-20: 8.9 per 100K people
You may also like: 17% of people live near toxic release facilities—here’s how it breaks down in Oregon
Canva
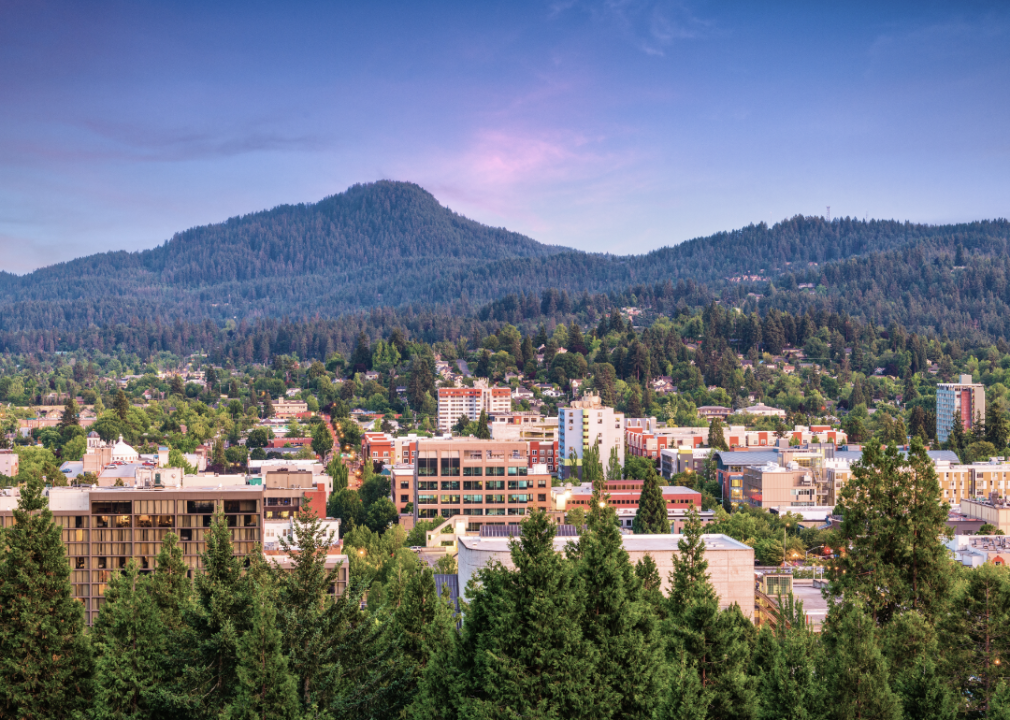
#21. Lane County
– Age-adjusted rate of all strokes among adults, estimates for 2021: 2.8% (range between 2.4% and 3.2%)
– Death rate for ischemic strokes, 2018-20: 21.5 per 100K people
– Death rate for hemorrhagic strokes, 2018-20: 7.8 per 100K people

Manuela Durson // Shutterstock
#20. Curry County
– Age-adjusted rate of all strokes among adults, estimates for 2021: 2.8% (range between 2.5% and 3.2%)
– Death rate for ischemic strokes, 2018-20: 21.5 per 100K people
– Death rate for hemorrhagic strokes, 2018-20: 8.6 per 100K people

Canva
#19. Jackson County
– Age-adjusted rate of all strokes among adults, estimates for 2021: 2.8% (range between 2.4% and 3.2%)
– Death rate for ischemic strokes, 2018-20: 22.4 per 100K people
– Death rate for hemorrhagic strokes, 2018-20: 7.9 per 100K people
Canva
#18. Baker County
– Age-adjusted rate of all strokes among adults, estimates for 2021: 2.9% (range between 2.5% and 3.3%)
– Death rate for ischemic strokes, 2018-20: 16.5 per 100K people
– Death rate for hemorrhagic strokes, 2018-20: 6.1 per 100K people
Canva
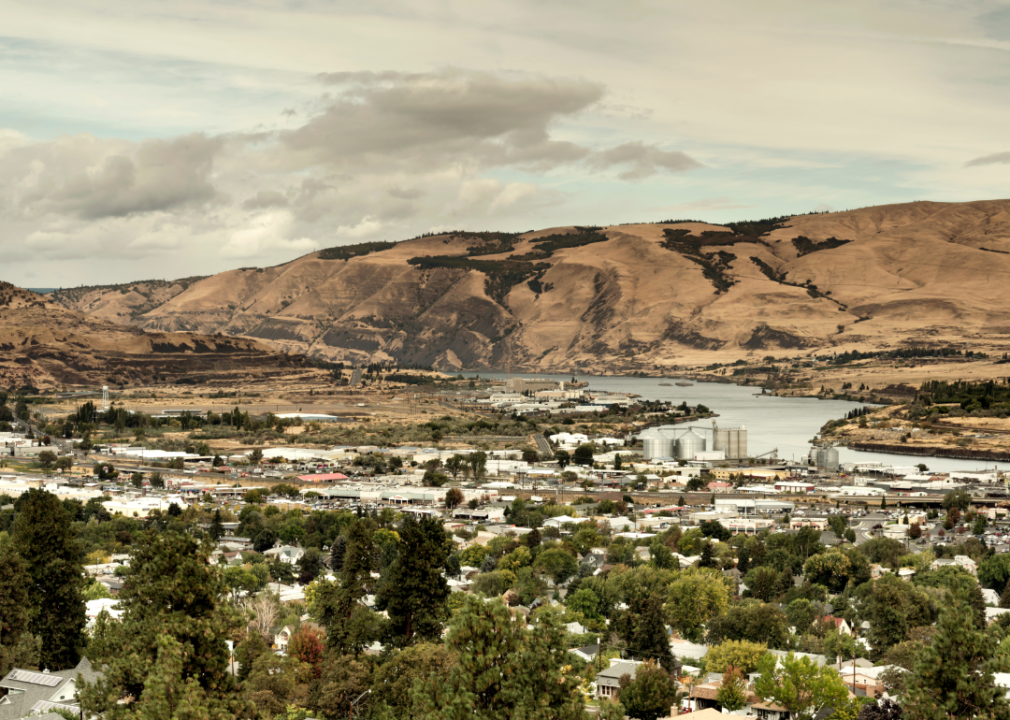
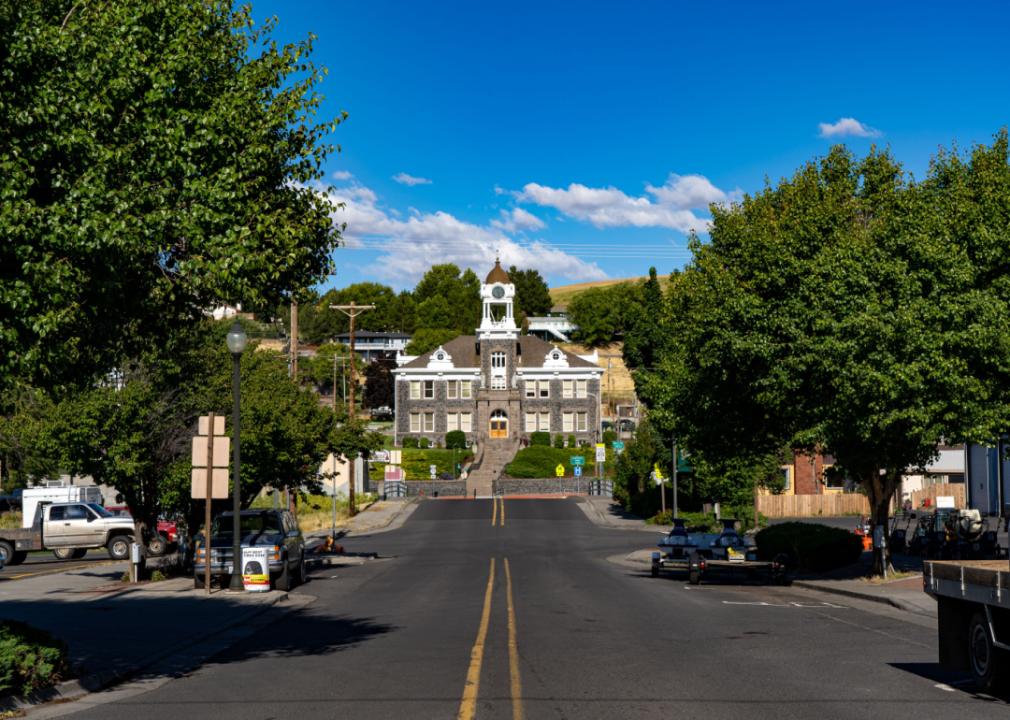
#17. Wasco County
– Age-adjusted rate of all strokes among adults, estimates for 2021: 2.9% (range between 2.6% and 3.3%)
– Death rate for ischemic strokes, 2018-20: 18.4 per 100K people
– Death rate for hemorrhagic strokes, 2018-20: 8.6 per 100K people
You may also like: Most valuable crops grown in Oregon
![]()
Canva
#16. Linn County
– Age-adjusted rate of all strokes among adults, estimates for 2021: 2.9% (range between 2.5% and 3.3%)
– Death rate for ischemic strokes, 2018-20: 19.0 per 100K people
– Death rate for hemorrhagic strokes, 2018-20: 8.7 per 100K people
Canva
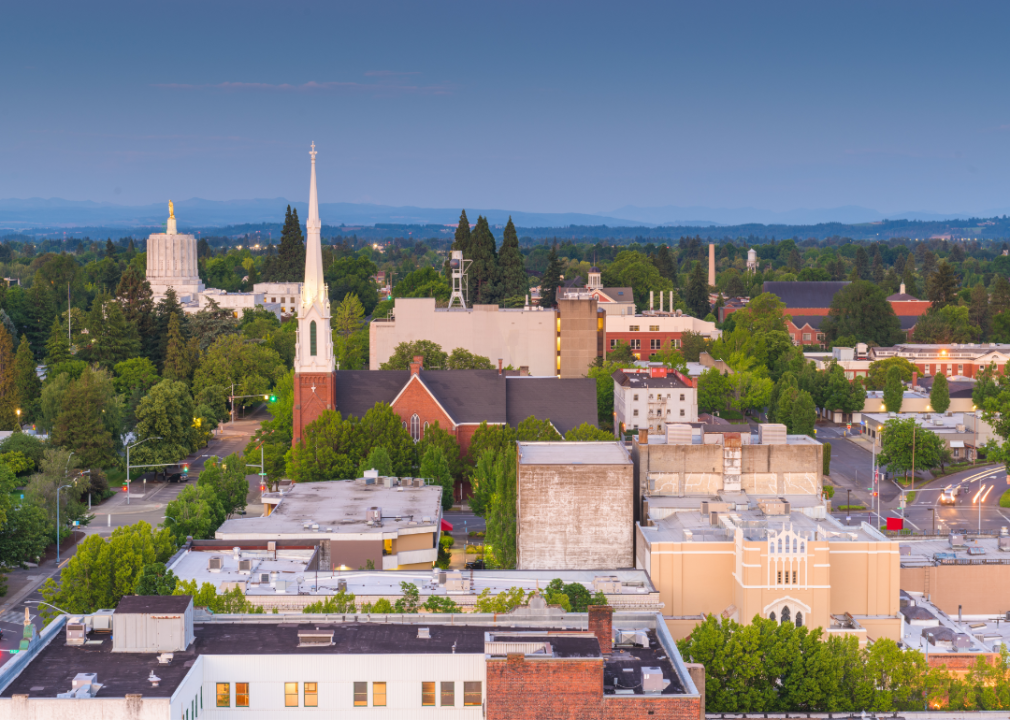
#15. Marion County
– Age-adjusted rate of all strokes among adults, estimates for 2021: 2.9% (range between 2.6% and 3.3%)
– Death rate for ischemic strokes, 2018-20: 19.0 per 100K people
– Death rate for hemorrhagic strokes, 2018-20: 8.9 per 100K people

Dee Browning // Shutterstock
#14. Grant County
– Age-adjusted rate of all strokes among adults, estimates for 2021: 2.9% (range between 2.6% and 3.3%)
– Death rate for ischemic strokes, 2018-20: 20.6 per 100K people
– Death rate for hemorrhagic strokes, 2018-20: 8.3 per 100K people

Canva
#13. Douglas County
– Age-adjusted rate of all strokes among adults, estimates for 2021: 2.9% (range between 2.6% and 3.3%)
– Death rate for ischemic strokes, 2018-20: 22.0 per 100K people
– Death rate for hemorrhagic strokes, 2018-20: 8.2 per 100K people

Arpad Jasko // Shutterstock
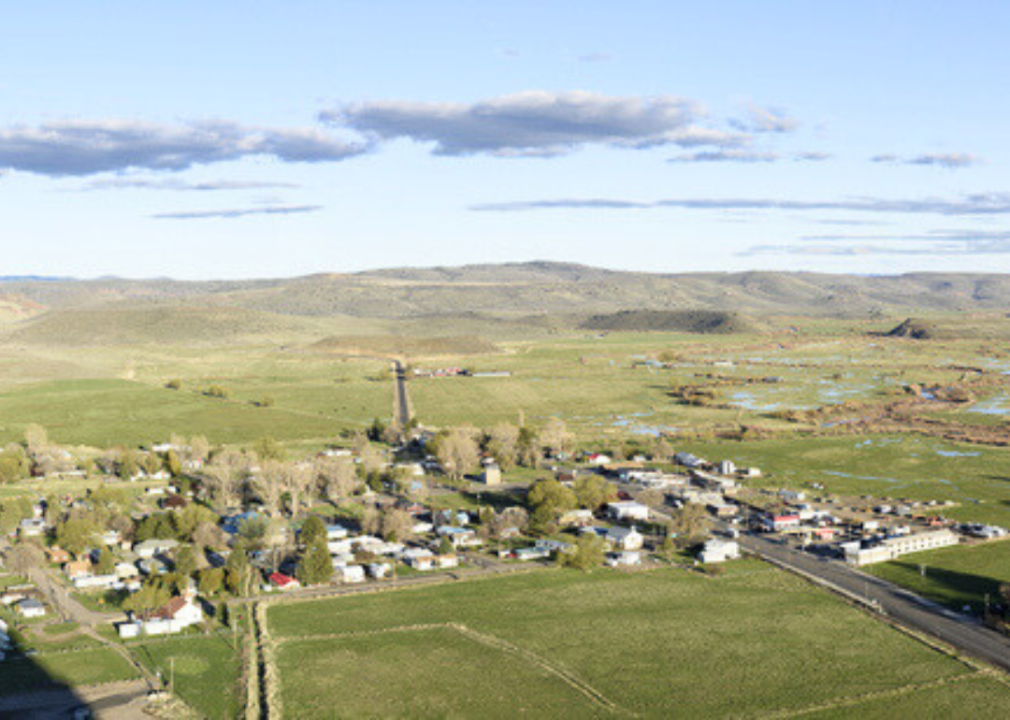
#12. Gilliam County
– Age-adjusted rate of all strokes among adults, estimates for 2021: 2.9% (range between 2.5% and 3.3%)
– Death rate for ischemic strokes, 2018-20: 24.1 per 100K people
– Death rate for hemorrhagic strokes, 2018-20: 8.5 per 100K people
You may also like: See how Oregon will be affected if Roe v. Wade is overturned

Bob Pool // Shutterstock
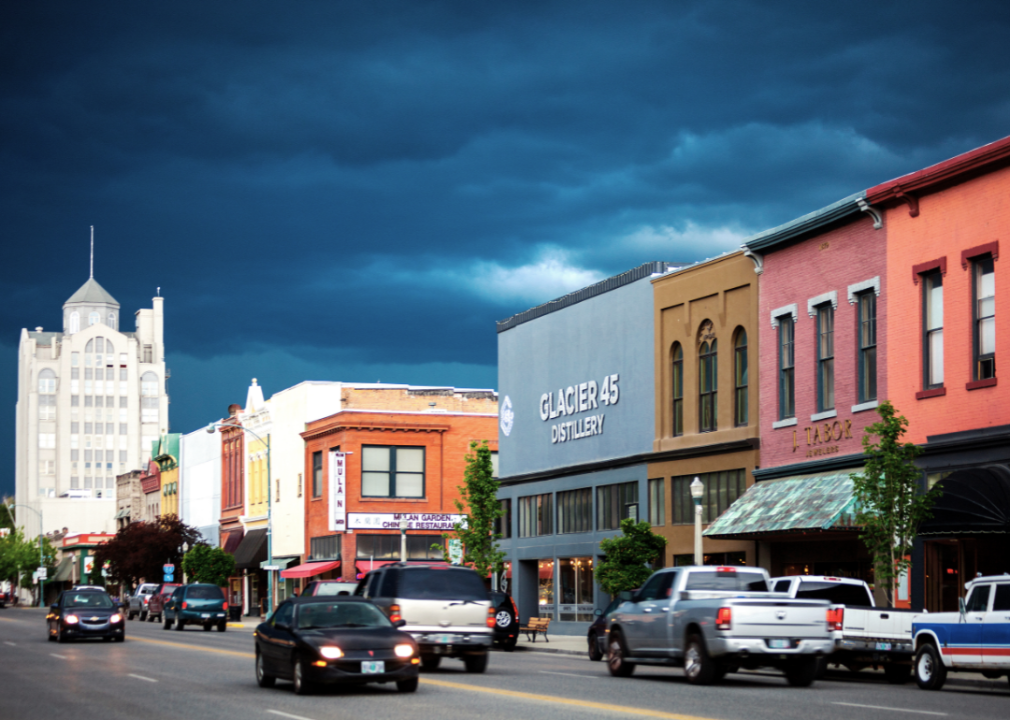
#11. Umatilla County
– Age-adjusted rate of all strokes among adults, estimates for 2021: 3.0% (range between 2.7% and 3.4%)
– Death rate for ischemic strokes, 2018-20: 19.0 per 100K people
– Death rate for hemorrhagic strokes, 2018-20: 9.3 per 100K people
Canva
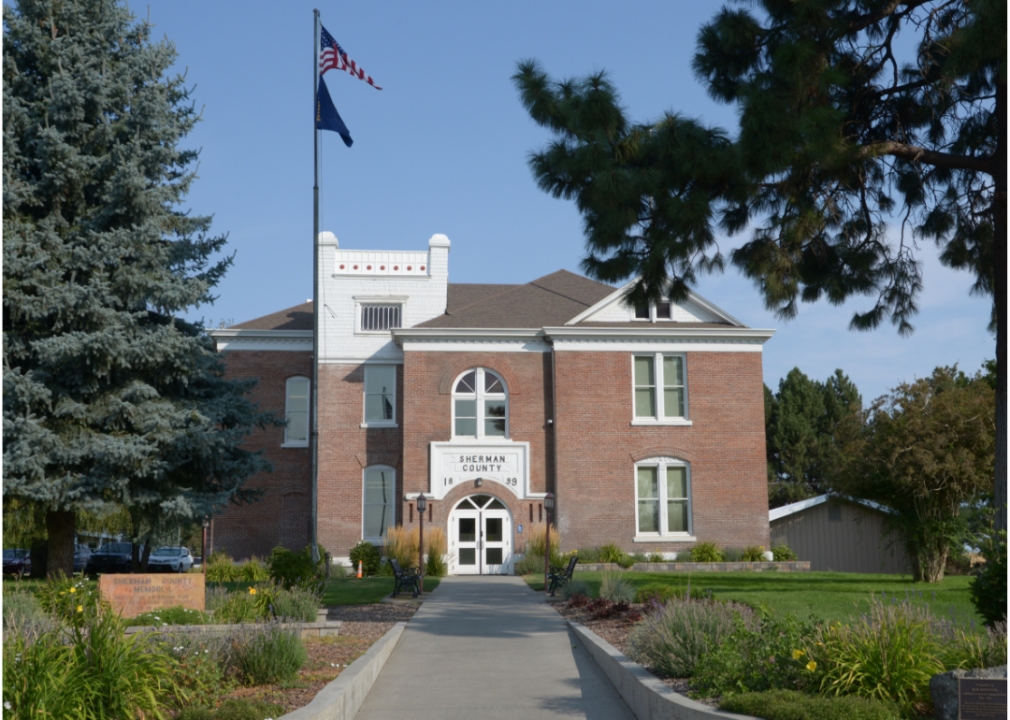
#10. Sherman County
– Age-adjusted rate of all strokes among adults, estimates for 2021: 3.0% (range between 2.6% and 3.4%)
– Death rate for ischemic strokes, 2018-20: 21.4 per 100K people
– Death rate for hemorrhagic strokes, 2018-20: 8.1 per 100K people
Canva
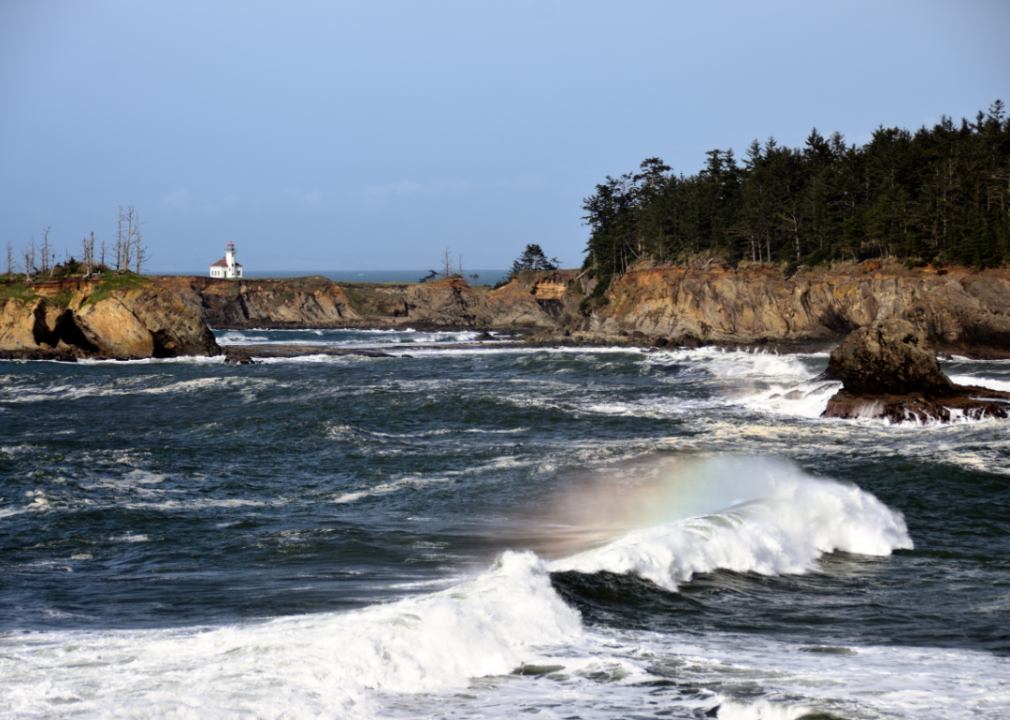
#9. Coos County
– Age-adjusted rate of all strokes among adults, estimates for 2021: 3.0% (range between 2.7% and 3.4%)
– Death rate for ischemic strokes, 2018-20: 21.7 per 100K people
– Death rate for hemorrhagic strokes, 2018-20: 9.1 per 100K people

Tomas Nevesely // Shutterstock
#8. Wheeler County
– Age-adjusted rate of all strokes among adults, estimates for 2021: 3.0% (range between 2.6% and 3.4%)
– Death rate for ischemic strokes, 2018-20: 25.1 per 100K people
– Death rate for hemorrhagic strokes, 2018-20: 7.9 per 100K people
Canva
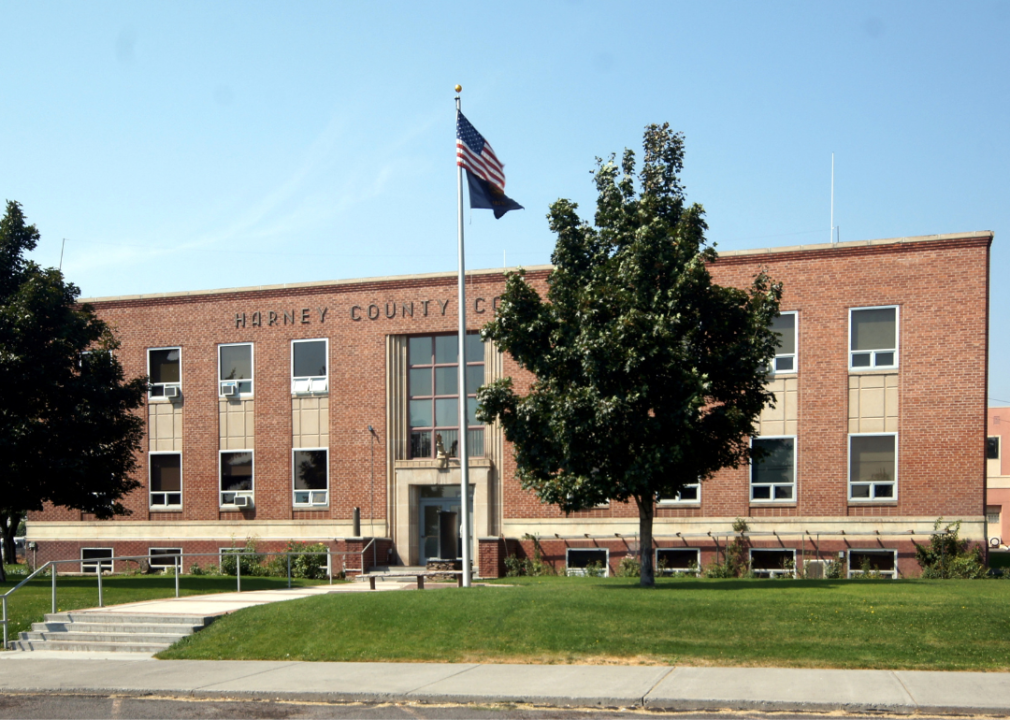
#7. Harney County
– Age-adjusted rate of all strokes among adults, estimates for 2021: 3.1% (range between 2.8% and 3.5%)
– Death rate for ischemic strokes, 2018-20: 16.6 per 100K people
– Death rate for hemorrhagic strokes, 2018-20: 8.3 per 100K people
You may also like: Best private high schools in Oregon
Canva
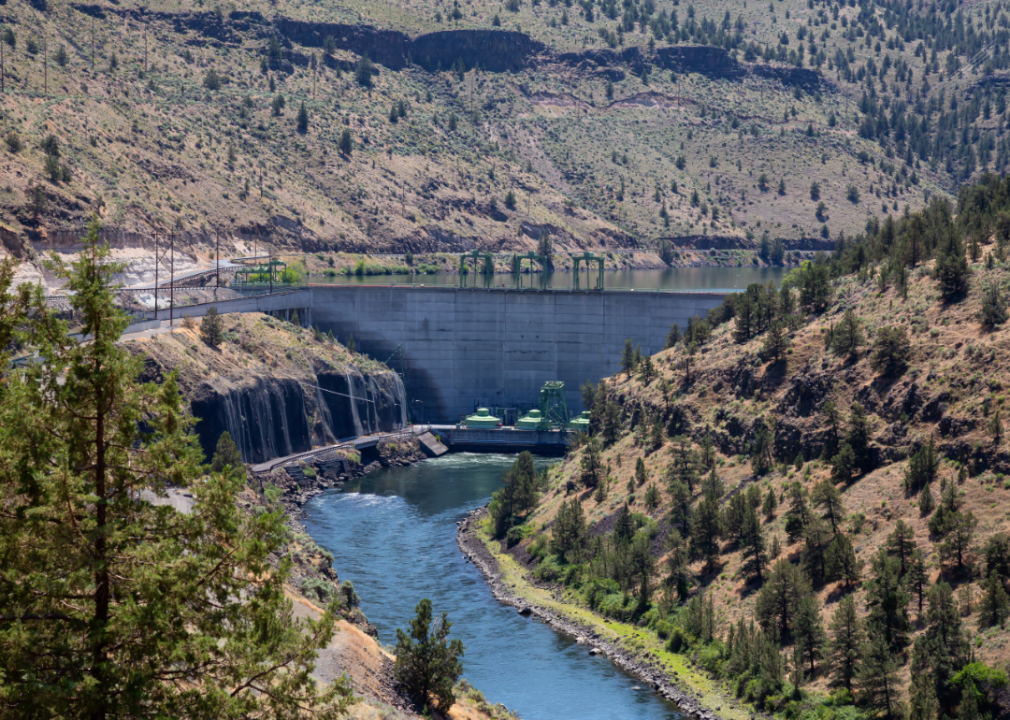
#6. Jefferson County
– Age-adjusted rate of all strokes among adults, estimates for 2021: 3.1% (range between 2.7% and 3.5%)
– Death rate for ischemic strokes, 2018-20: 19.3 per 100K people
– Death rate for hemorrhagic strokes, 2018-20: 8.5 per 100K people
Bob Pool // Shutterstock
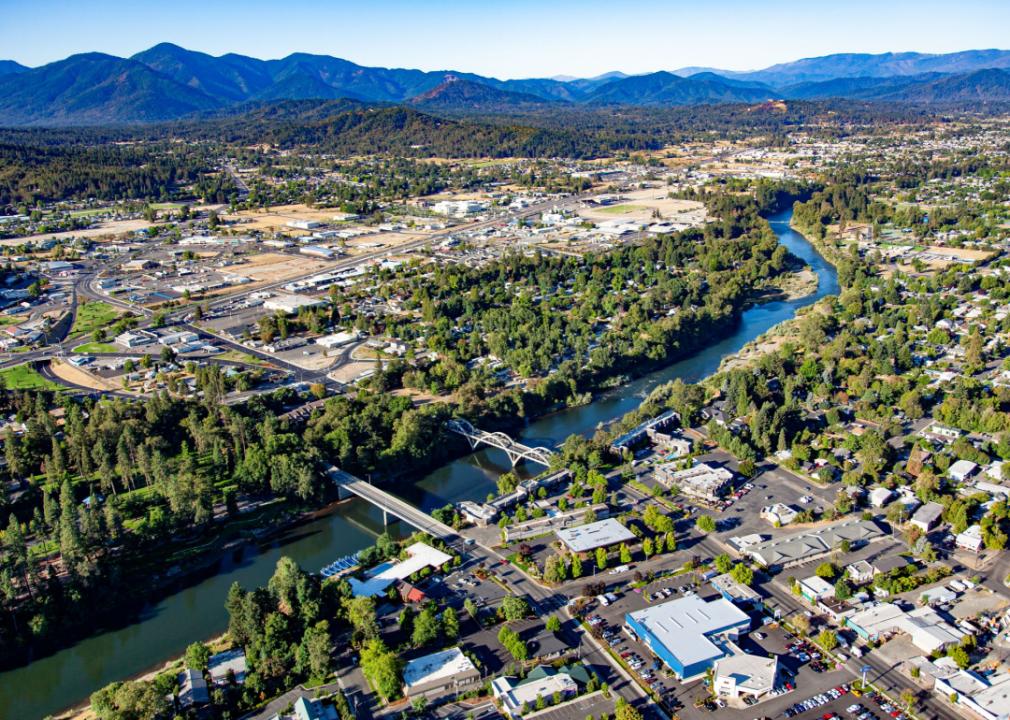
#5. Josephine County
– Age-adjusted rate of all strokes among adults, estimates for 2021: 3.1% (range between 2.7% and 3.5%)
– Death rate for ischemic strokes, 2018-20: 22.3 per 100K people
– Death rate for hemorrhagic strokes, 2018-20: 7.8 per 100K people

Dominic Gentilcore PhD // Shutterstock
#4. Lake County
– Age-adjusted rate of all strokes among adults, estimates for 2021: 3.2% (range between 2.8% and 3.6%)
– Death rate for ischemic strokes, 2018-20: 17.7 per 100K people
– Death rate for hemorrhagic strokes, 2018-20: 9.0 per 100K people
Canva
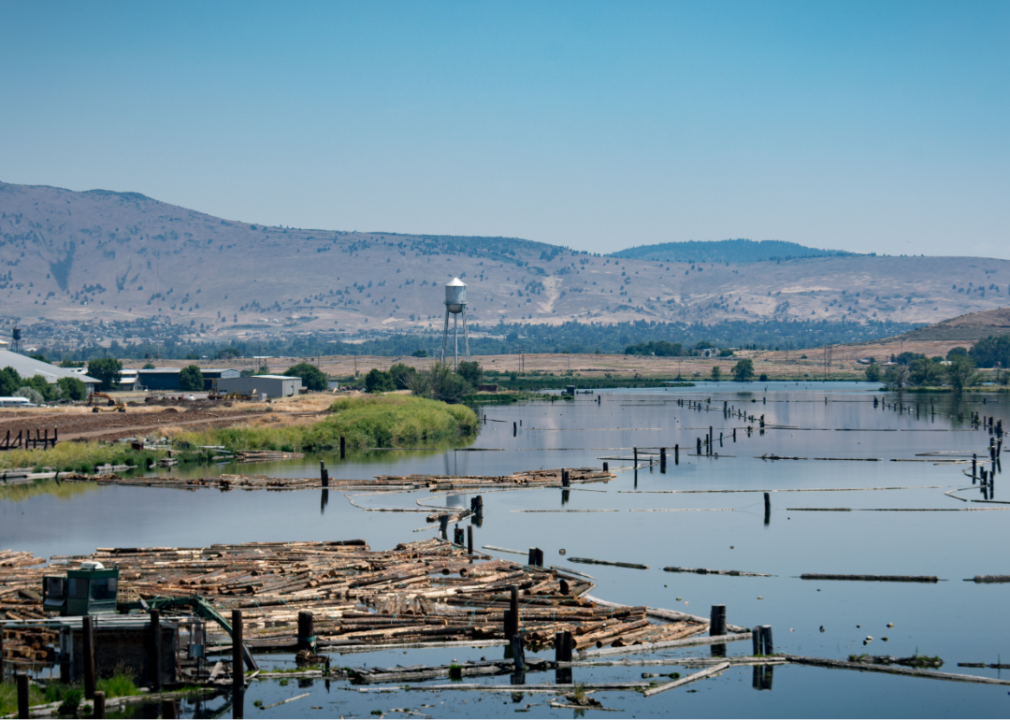
#3. Klamath County
– Age-adjusted rate of all strokes among adults, estimates for 2021: 3.2% (range between 2.8% and 3.6%)
– Death rate for ischemic strokes, 2018-20: 23.8 per 100K people
– Death rate for hemorrhagic strokes, 2018-20: 7.9 per 100K people
Bob Pool // Shutterstock
#2. Morrow County
– Age-adjusted rate of all strokes among adults, estimates for 2021: 3.3% (range between 2.9% and 3.7%)
– Death rate for ischemic strokes, 2018-20: 19.0 per 100K people
– Death rate for hemorrhagic strokes, 2018-20: 9.2 per 100K people
You may also like: Best counties to retire to in Oregon
Hugh K Telleria // Shutterstock
#1. Malheur County
– Age-adjusted rate of all strokes among adults, estimates for 2021: 3.4% (range between 3.0% and 3.8%)
– Death rate for ischemic strokes, 2018-20: 16.9 per 100K people
– Death rate for hemorrhagic strokes, 2018-20: 7.1 per 100K people
This story features data reporting and writing by Emma Rubin and is part of a series utilizing data automation across 49 states.
